Actual units Budgeted units
Budgeted
Budgeted
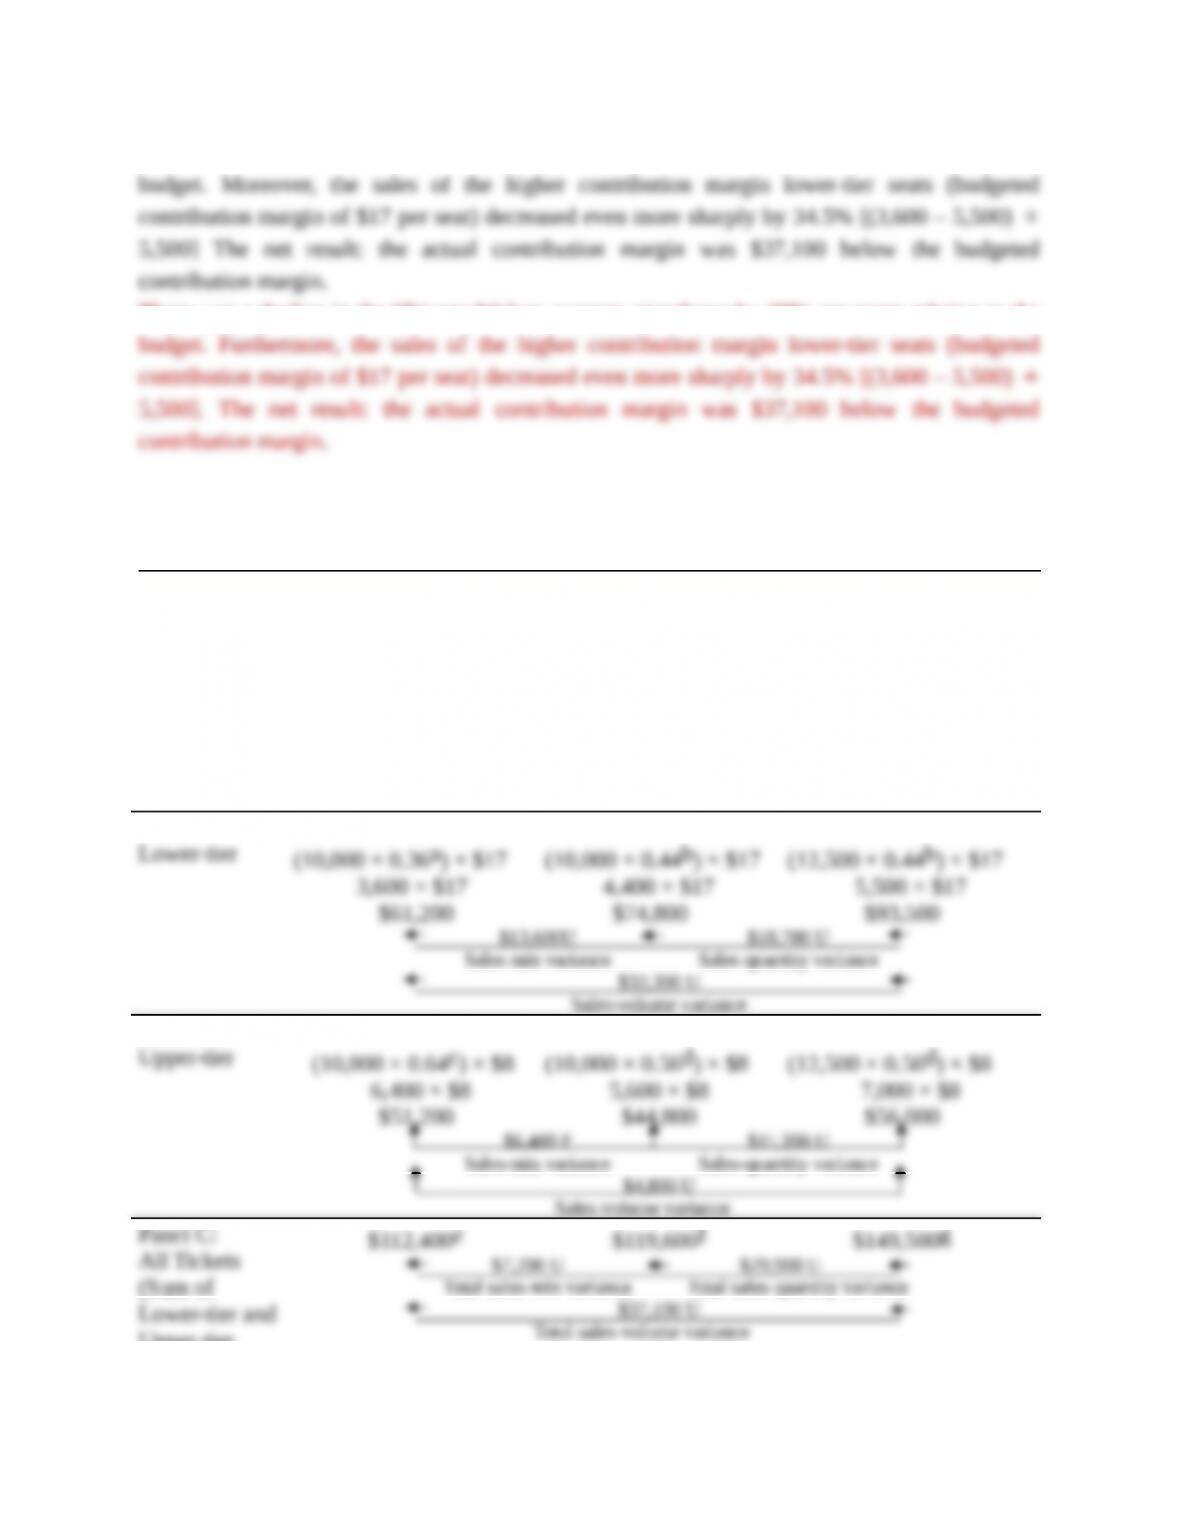
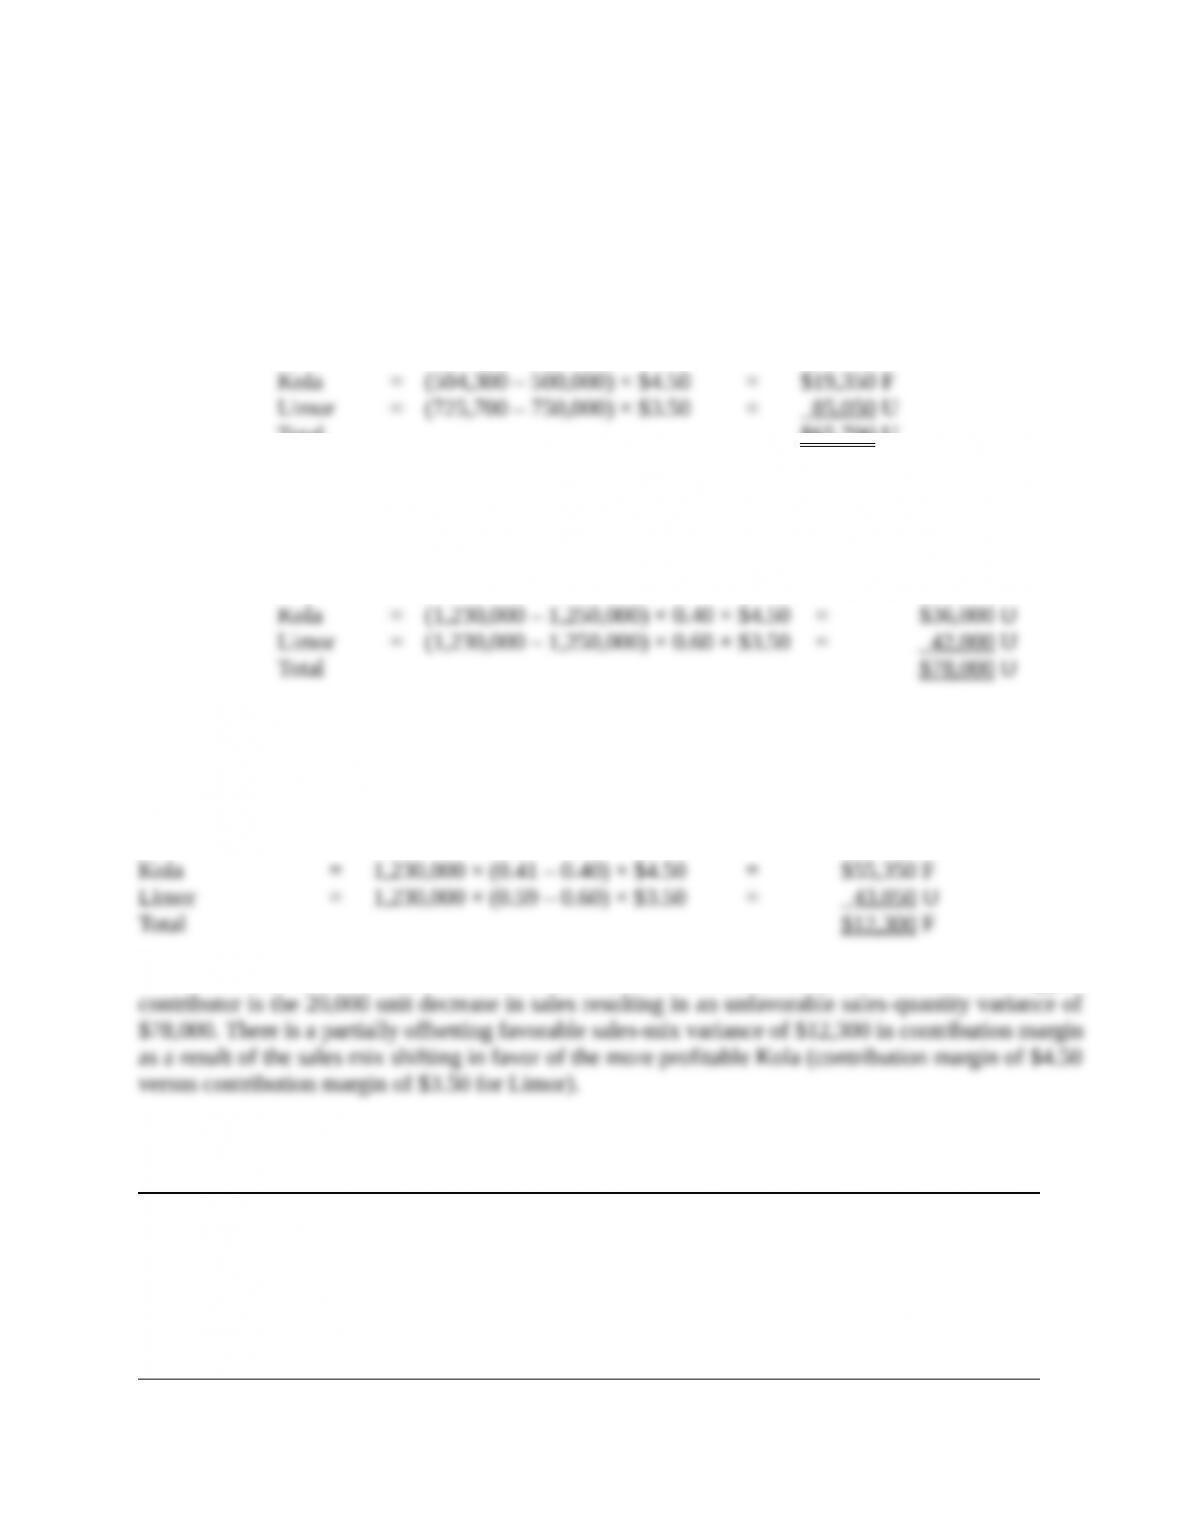
$61,200 $74,800 $93,500
$13,600U $18,700 U
Sales-mix variance Sales-quantity variance
$32,300 U
Sales-volume variance
Panel B:
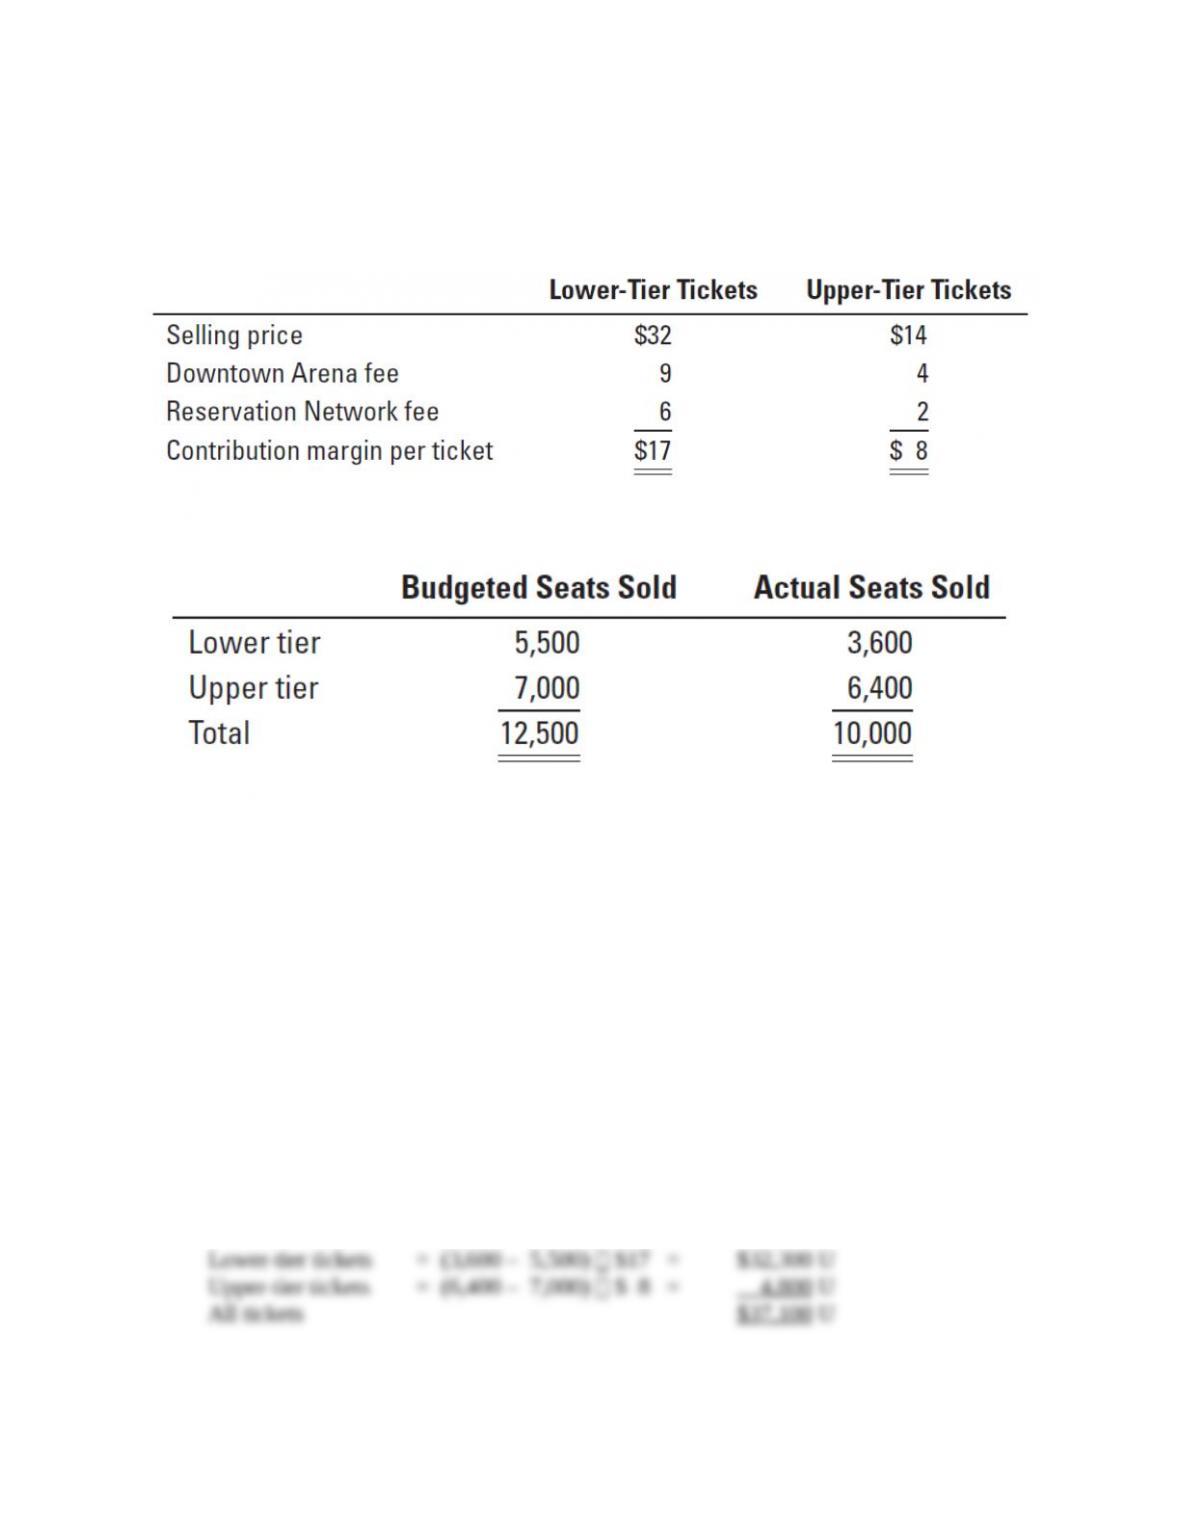
Upper-tier
(10,000 × 0.64c) × $8
6,400 × $8
(10,000 × 0.56d) × $8
5,600 × $8
(12,500 × 0.56d) × $8
7,000 × $8
$51,200 $44,800 $56,000
$6,400 F $11,200 U
Sales-mix variance Sales-quantity variance
$4,800 U
Sales-volume variance
Panel C:
All Tickets
(Sum of Lower-
tier and Upper–
tier Tickets)
$112,400e $119,600f $149,500g
$7,200 U $29,900 U
Total sales-mix variance Total sales-quantity variance
$37,100 U
Total sales-volume variance
F = favorable effect on operating income; U = unfavorable effect on operating income.
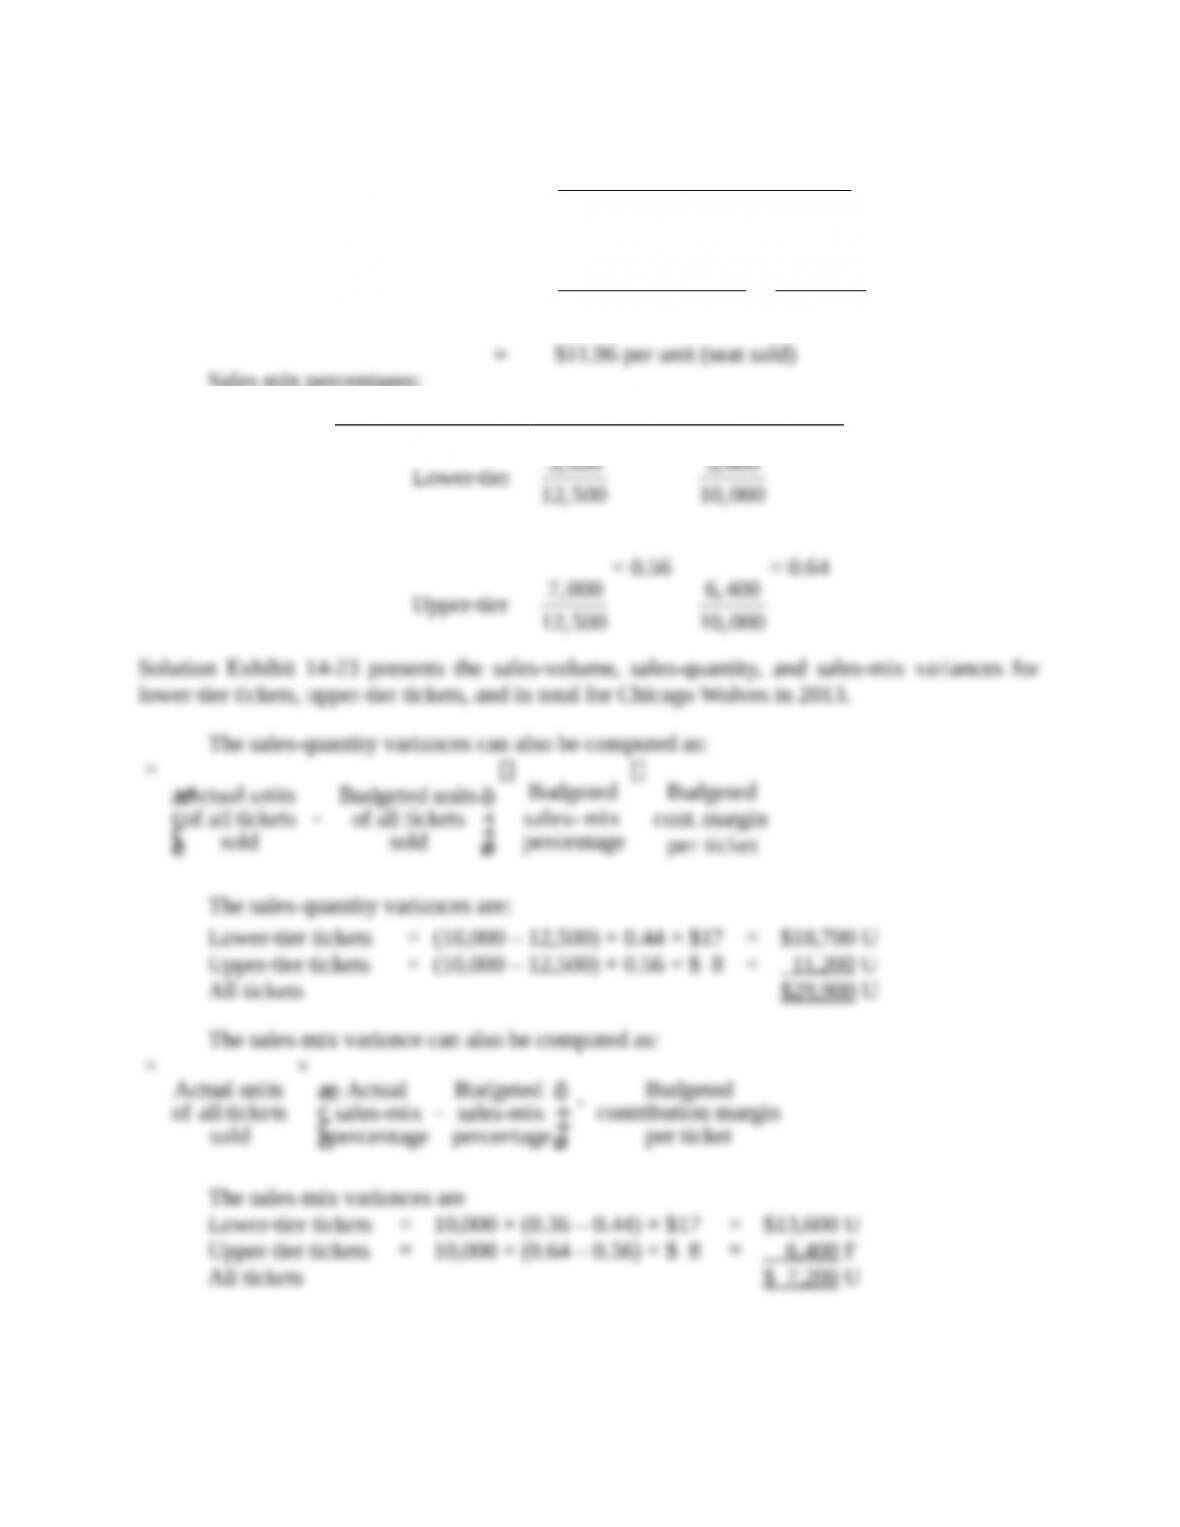
Actual Sales Mix:
aLower-tier = 3,600 ÷ 10,000 = 36%
cUpper-tier = 6,400 ÷ 10,000 = 64%
e$61,200 + $51,200 = $112,400
Budgeted Sales Mix:
bLower-tier = 5,500 ÷ 12,500 = 44%
dUpper-tier = 7,000 ÷ 12,500 = 56%
f $74,800 + $44,800 = $119,600
g $93,500 + $56,000 = $149,500