Unlock document.
This document is partially blurred.
Unlock all pages and 1 million more documents.
Get Access
13-1
CHAPTER 13
PRICING DECISIONS AND COST MANAGEMENT
13-1 The three major influences on pricing decisions are
1. Customers
2. Competitors
3. Costs
13-2 Not necessarily. For a one-time-only special order, the relevant costs are only those costs
that will change as a result of accepting the order. In this case, full product costs will rarely be
relevant. It is more likely that full product costs will be relevant costs for long-run pricing
decisions.
13-3 Four purposes of cost allocation are as follows:
1. To provide information for economic decisions
2. To motivate managers and other employees
3. To justify costs or compute reimbursement amounts
4. To measure income and assets
13-4 Activity-based costing helps managers in pricing decisions in two ways.
1. It gives managers more accurate product-cost information for making pricing decisions.
2. It helps managers to manage costs during value engineering by identifying the cost impact
of eliminating, reducing, or changing various activities.
13-5 Two alternative approaches to long-run pricing decisions are the following:
1. Market-based pricing, an important form of which is target pricing. The market-based
approach asks, “Given what our customers want and how our competitors will react to
what we do, what price should we charge?”
2. Cost-based pricing which asks, “What does it cost us to make this product and, hence, what
price should we charge that will recoup our costs and achieve a target return on investment?”
13-6 A target cost per unit is the estimated long-run cost per unit of a product (or service) that,
when sold at the target price, enables the company to achieve the targeted operating income per
unit.
13-7 Value engineering is a systematic evaluation of all aspects of the value-chain business
functions, with the objective of reducing costs while satisfying customer needs. Value engineering
via improvement in product and process designs is a principal technique that companies use to
achieve target cost per unit.
13-8 A value-added cost is a cost that customers perceive as adding value, or utility, to a product
or service. Examples are costs of materials, direct labor, tools, and machinery. A nonvalue-added
cost is a cost that customers do not perceive as adding value, or utility, to a product or service.
Examples of nonvalue-added costs are costs of rework, scrap, expediting, and breakdown
maintenance.
13-2
13-9 No. It is important to distinguish between when costs are locked in and when costs are
incurred because it is difficult to alter or reduce costs that have already been locked in.
13-10 Cost-plus pricing is a pricing approach in which managers add a markup to cost in order to
determine price.
13-11 Cost-plus pricing methods vary depending on the bases used to calculate prices. Examples
are (a) variable manufacturing costs; (b) manufacturing function costs; (c) variable product costs;
and (d) full product costs.
13-12 Two examples where the difference in the costs of two products or services is much smaller
than the differences in their prices are:
1. The difference in prices charged for a telephone call, hotel room, or car rental during busy
versus slack periods is often much greater than the difference in costs to provide these services.
The difference in prices charged for a telephone call, hotel room, or car rental during busy versus
slack periods is often much greater than the difference in costs to provide these services.
2. The difference in costs for an airplane seat sold to a passenger traveling on business or a
passenger traveling for pleasure is roughly the same. However, airline companies price
discriminate. They routinely charge business travelers––those who are likely to start and complete
their travel during the same week excluding the weekend––a much higher price for the same class
of service than pleasure travelers who generally stay at their destinations over at least one weekend.
13-13 Life-cycle budgeting is an estimate of the revenues and costs attributable to each product
from its initial R&D to its final customer servicing and support.
13-14 Three benefits of using a product life-cycle reporting format are the following:
1. The full set of revenues and costs associated with each product becomes more visible.
2. Differences among products in the percentage of total costs committed at early stages in
the life cycle are highlighted.
3. Interrelationships among business function cost categories are highlighted.
13-15 Predatory pricing occurs when a business deliberately prices below its costs in an effort to
drive competitors out of the market and restrict supply and then raises prices rather than enlarge
demand. Under U.S. laws, dumping occurs when a non-U.S. company sells a product in the United
States at a price below the market value in the country where it is produced, and this lower price
materially injures or threatens to materially injure an industry in the United States. Collusive
pricing occurs when companies in an industry conspire in their pricing and production decisions
to achieve a price above the competitive price and so restrain trade.
13-16 (25–30 min.) Value-added, nonvalue-added costs.
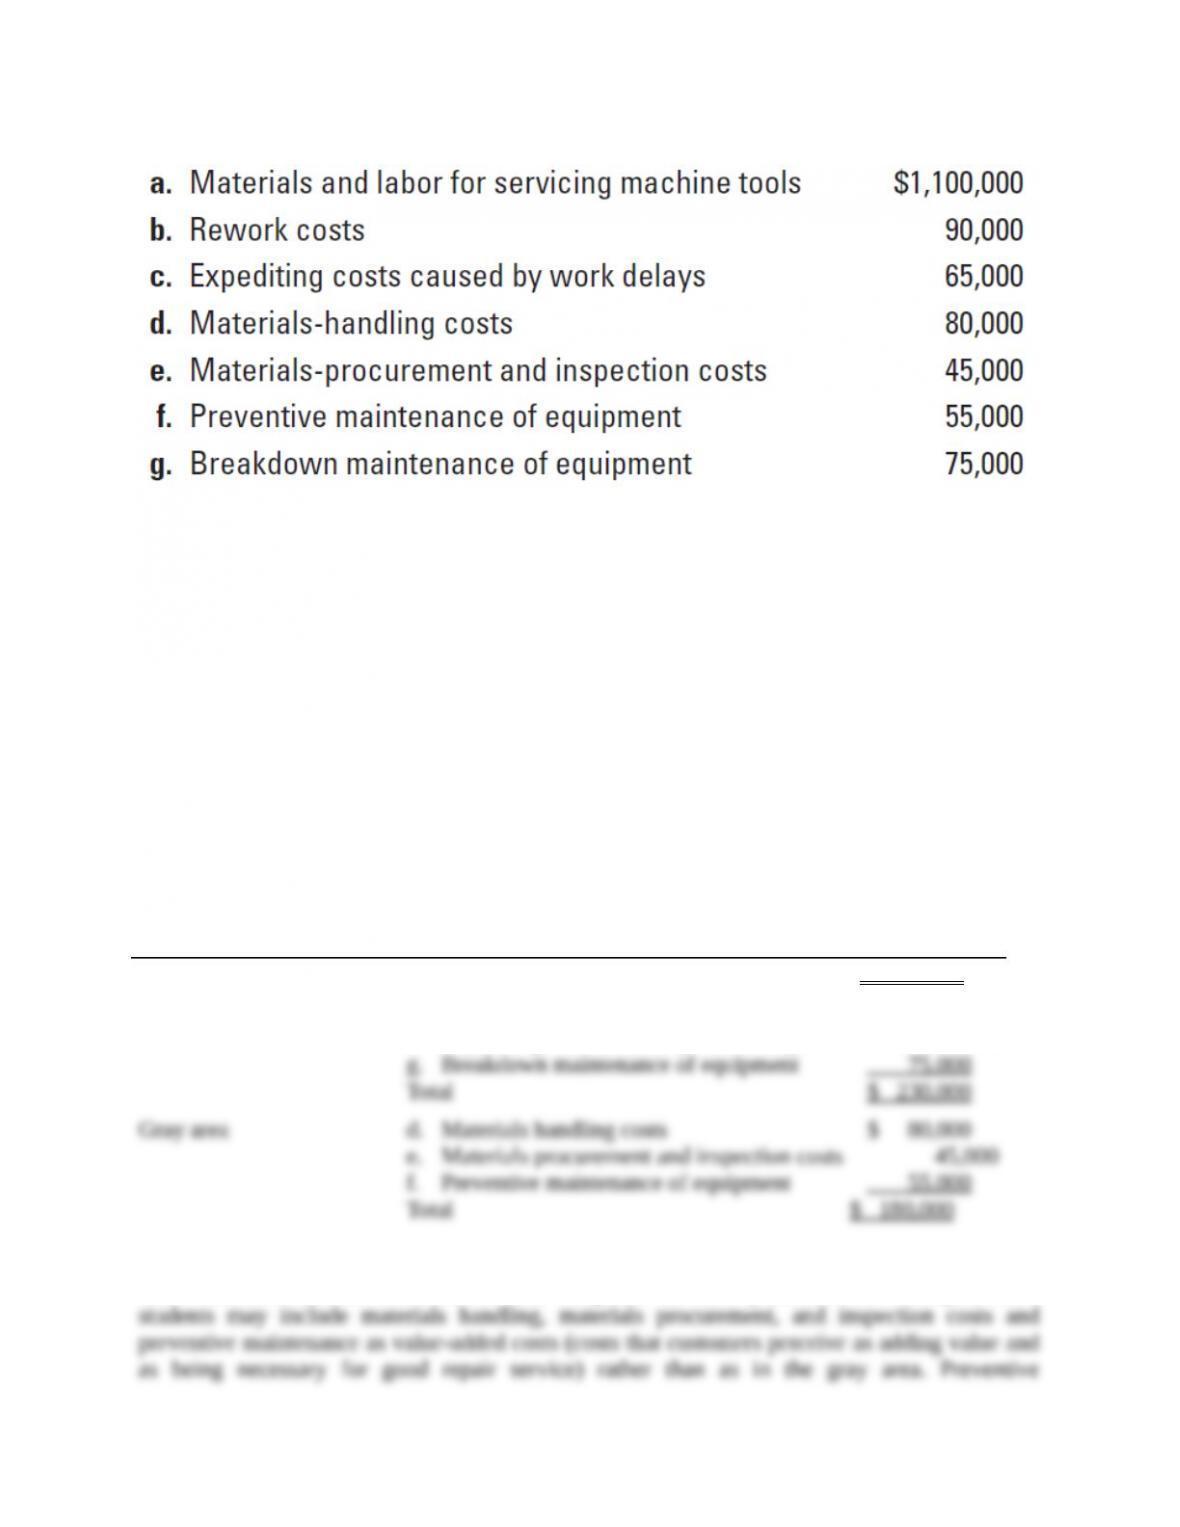
The Magill Repair Shop repairs and services machine tools. A summary of its costs (by activity)
for 2013 is as follows:
13-3
Required:
1. Classify each cost as value-added, non-value-added, or in the gray area between.
2. For any cost classified in the gray area, assume 60% is value-added and 40% is non-value-
added. How much of the total of all seven costs is value-added and how much is non-value-
added?
3. Magill is considering the following changes: (a) introducing quality-improvement programs
whose net effect will be to reduce rework and expediting costs by 40% and materials and labor
costs for servicing machine tools by 5%; (b) working with suppliers to reduce materials-
procurement and inspection costs by 20% and materials-handling costs by 30%; and (c)
increasing preventive-maintenance costs by 70% to reduce breakdown-maintenance costs by
50%. Calculate the effect of programs (a), (b), and (c) on value-added costs, non-value-added
costs, and total costs. Comment briefly.
SOLUTION
1.
Category
Examples
Value-added costs
a. Materials and labor for regular repairs
$1,100,000
Nonvalue-added costs
b. Rework costs
c. Expediting costs caused by work delays
g. Breakdown maintenance of equipment
Total
$ 90,000
65,000
75,000
$ 230,000
Gray area
d. Materials handling costs
e. Materials procurement and inspection costs
f. Preventive maintenance of equipment
Total
$ 80,000
45,000
55,000
$ 180,000
Classifications of value-added, nonvalue-added, and gray area costs are often not clear-cut. Other
classifications of some of the cost categories are also plausible. For example, some students may
include materials handling, materials procurement, and inspection costs and preventive
maintenance as value-added costs (costs that customers perceive as adding value and as being
necessary for good repair service) rather than as in the gray area. Preventive maintenance, for
13-4
instance, might be regarded as value-added because it helps prevent nonvalue-adding breakdown
maintenance.
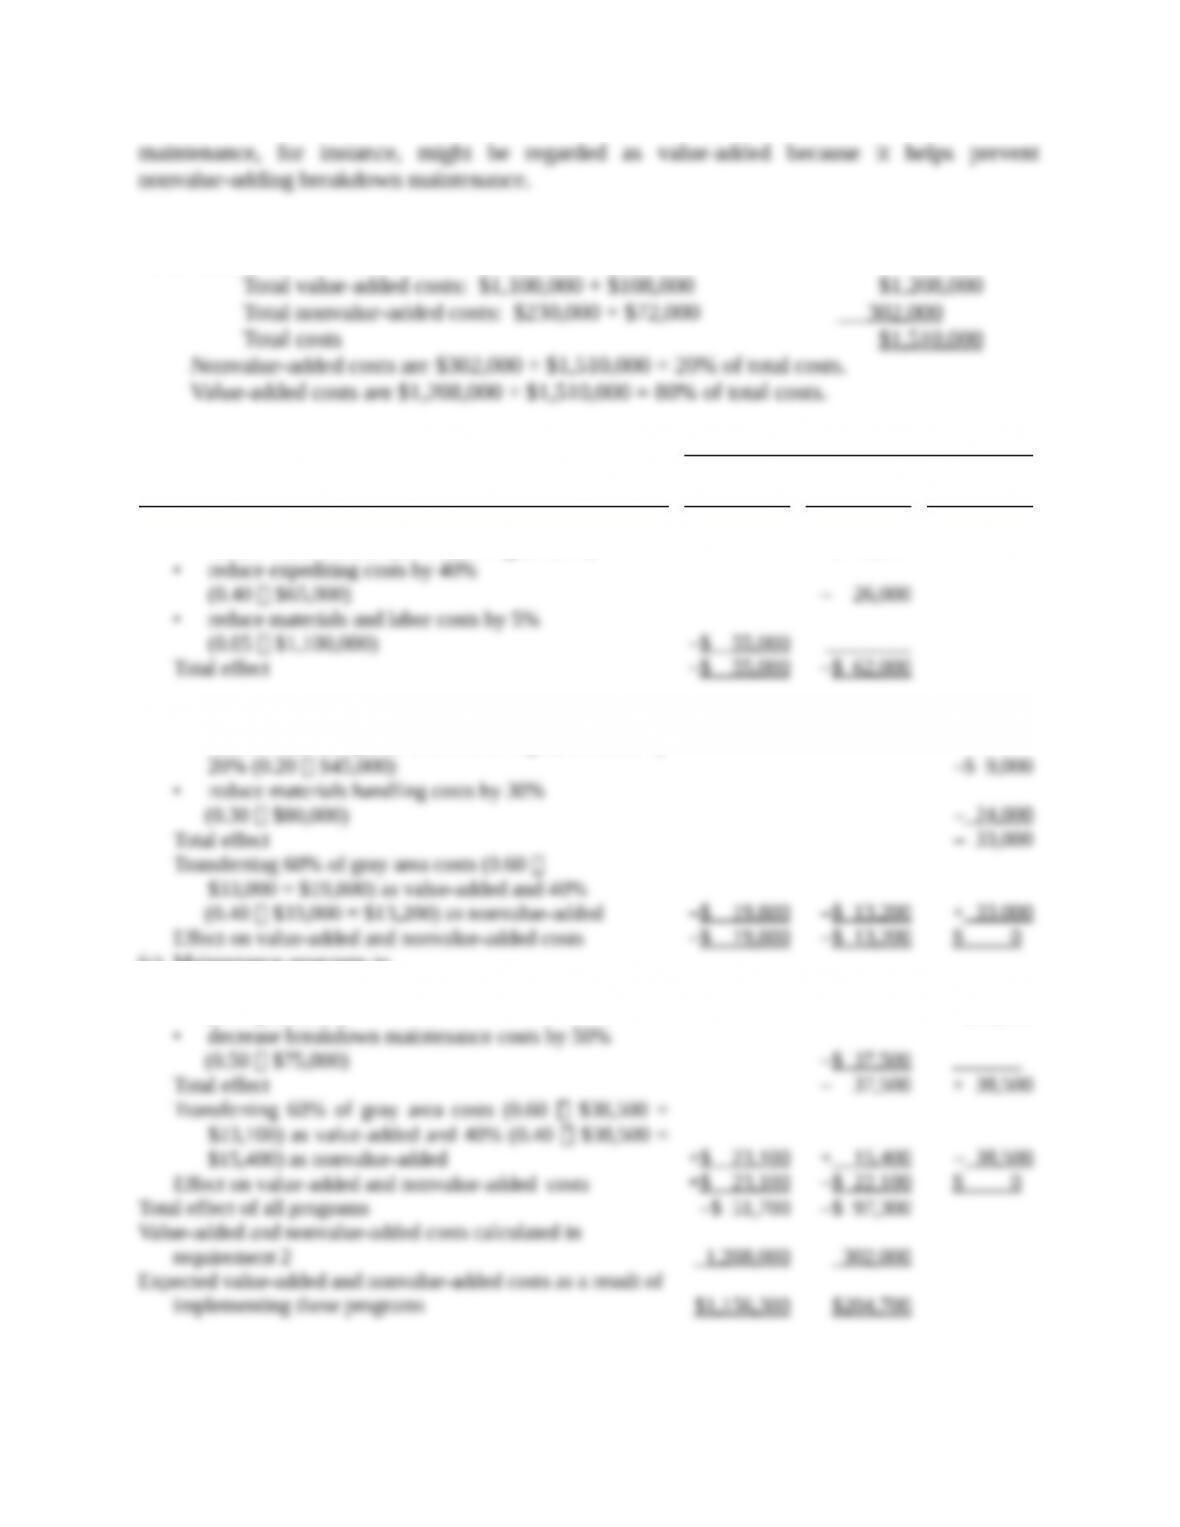
2. Total costs in the gray area are $180,000. Of this, we assume 60%, or $108,000, are value-
added and 40%, or $72,000, are nonvalue-added.
Total value-added costs: $1,100,000 + $108,000 $1,208,000
Total nonvalue-added costs: $230,000 + $72,000 302,000
Total costs $1,510,000
Nonvalue-added costs are $302,000 ÷ $1,510,000 = 20% of total costs.
Value-added costs are $1,208,000 ÷ $1,510,000 = 80% of total costs.
3.
Effect on Costs Classified as
Program
Value-
Added
Nonvalue-
Added
Gray
Area
(a) Quality improvement programs to
• reduce rework costs by 40% (0.40 $90,000)
• reduce expediting costs by 40%
(0.40 $65,000)
• reduce materials and labor costs by 5%
(0.05 $1,100,000)
Total effect
–$ 55,000
–$ 55,000
–$ 36,000
– 26,000
–$ 62,000
(b) Working with suppliers to
• reduce materials procurement and inspection costs by
20% (0.20 $45,000)
• reduce materials handling costs by 30%
(0.30 $80,000)
Total effect
Transferring 60% of gray area costs (0.60
$33,000 = $19,800) as value-added and 40%
(0.40 $33,000 = $13,200) as nonvalue-added
Effect on value-added and nonvalue-added costs
–$ 19,800
–$ 19,800
–$ 13,200
–$ 13,200
–$ 9,000
– 24,000
– 33,000
+ 33,000
$ 0
(c) Maintenance programs to
• increase preventive maintenance costs by 70%
(0.70 $55,000)
• decrease breakdown maintenance costs by 50%
(0.50 $75,000)
Total effect
Transferring 60% of gray area costs (0.60 $38,500 =
$23,100) as value-added and 40% (0.40 $38,500 =
$15,400) as nonvalue-added
Effect on value-added and nonvalue-added costs
+$ 23,100
+$ 23,100
–$ 37,500
– 37,500
+ 15,400
–$ 22,100
+$38,500
+ 38,500
– 38,500
$ 0
Total effect of all programs
Value-added and nonvalue-added costs calculated in
requirement 2
Expected value-added and nonvalue-added costs as a result of
implementing these programs
–$ 51,700
1,208,000
$1,156,300
–$ 97,300
302,000
$204,700
13-5
If these programs had been implemented, total costs would have decreased from $1,510,000
(requirement 2) to $1,156,300 + $204,700 = $1,361,000, and the percentage of nonvalue-added
costs would decrease from 20% (requirement 2) to $204,700 ÷ $1,316,000 = 15%. These are
significant improvements in Magill’s performance.
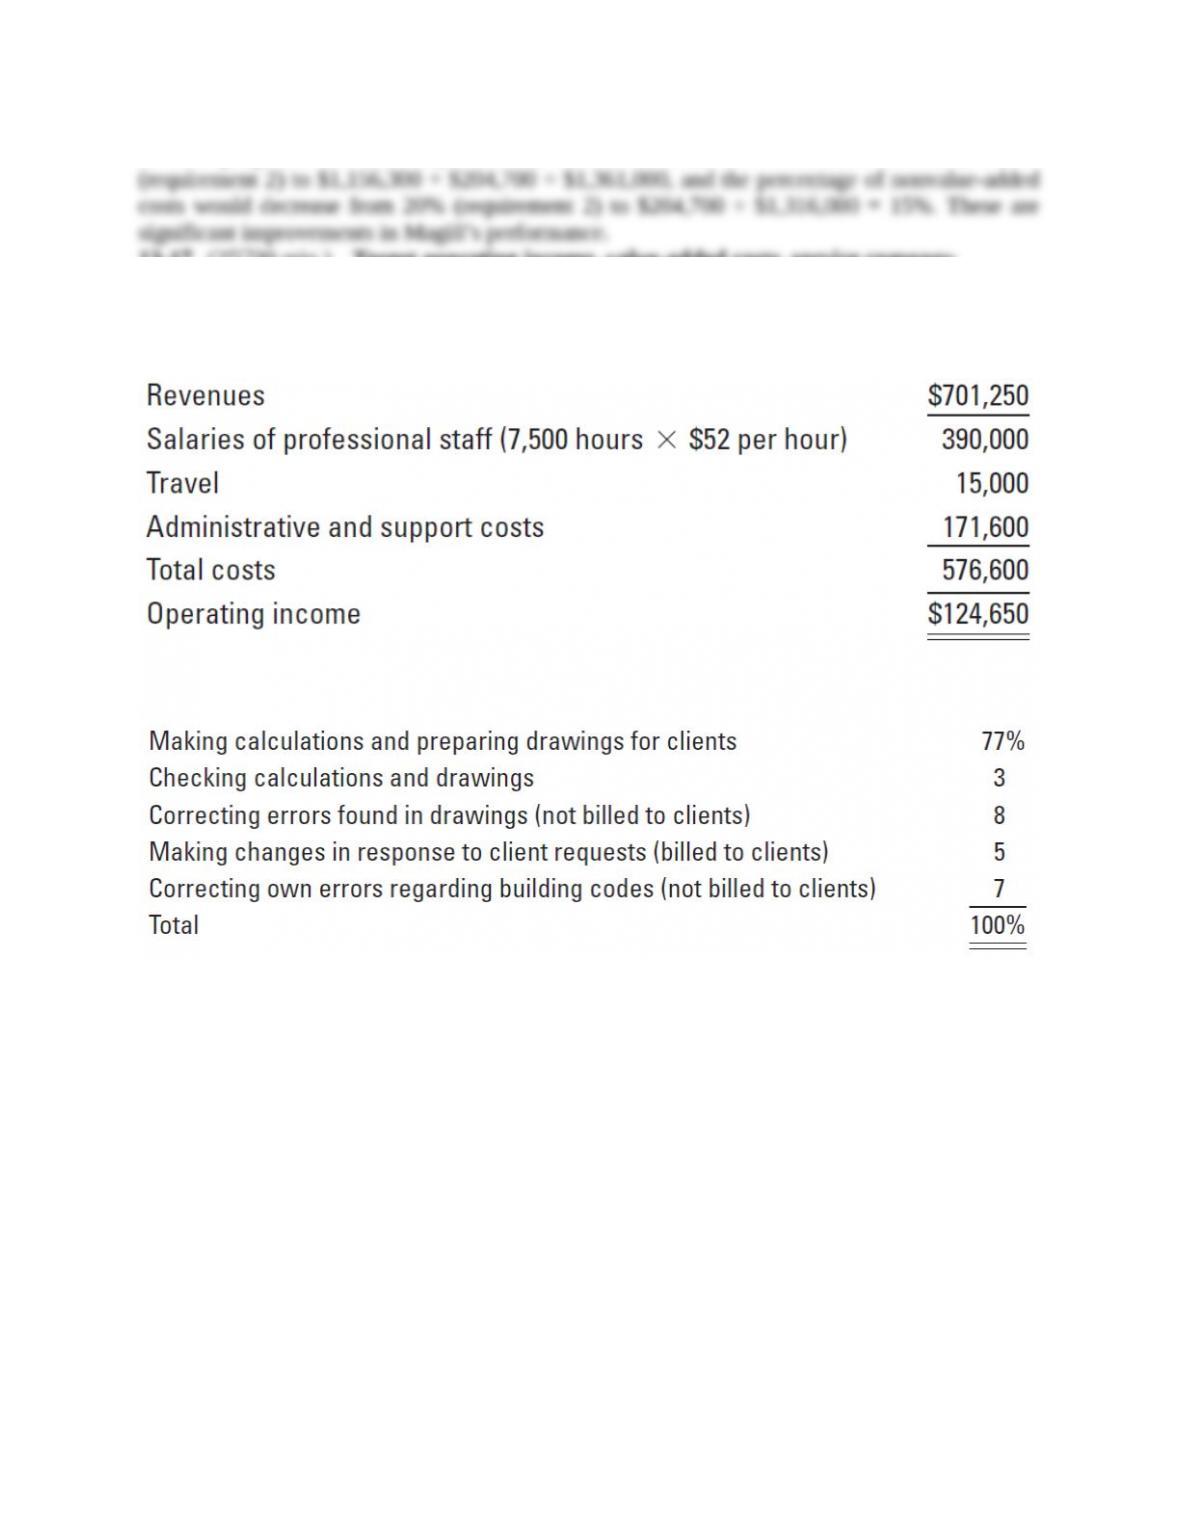
13-17 (25−30 min.) Target operating income, value-added costs, service company.
Calvert Associates prepares architectural drawings to conform to local structural-safety codes. Its
income statement for 2013 is as follows:
Following is the percentage of time spent by professional staff on various activities:
Assume administrative and support costs vary with professional-labor costs. Consider each
requirement independently.
Required:
1. How much of the total costs in 2013 are value-added, non-value-added, or in the gray area
between? Explain your answers briefly. What actions can Calvert take to reduce its costs?
2. What are the consequences of misclassifying a non-value-added cost as a value-added cost?
When in doubt, would you classify a cost as a value-added or non-value-added cost? Explain
briefly.
3. Suppose Calvert could eliminate all errors so that it did not need to spend any time making
corrections and, as a result, could proportionately reduce professional-labor costs. Calculate
Calvert’s operating income for 2013.
4. Now suppose Calvert could take on as much business as it could complete, but it could not add
more professional staff. Assume Calvert could eliminate all errors so that it does not need to
spend any time correcting errors. Assume Calvert could use the time saved to increase revenues
13-6
proportionately. Assume travel costs will remain at $15,000. Calculate Calvert’s operating
income for 2013.
SOLUTION
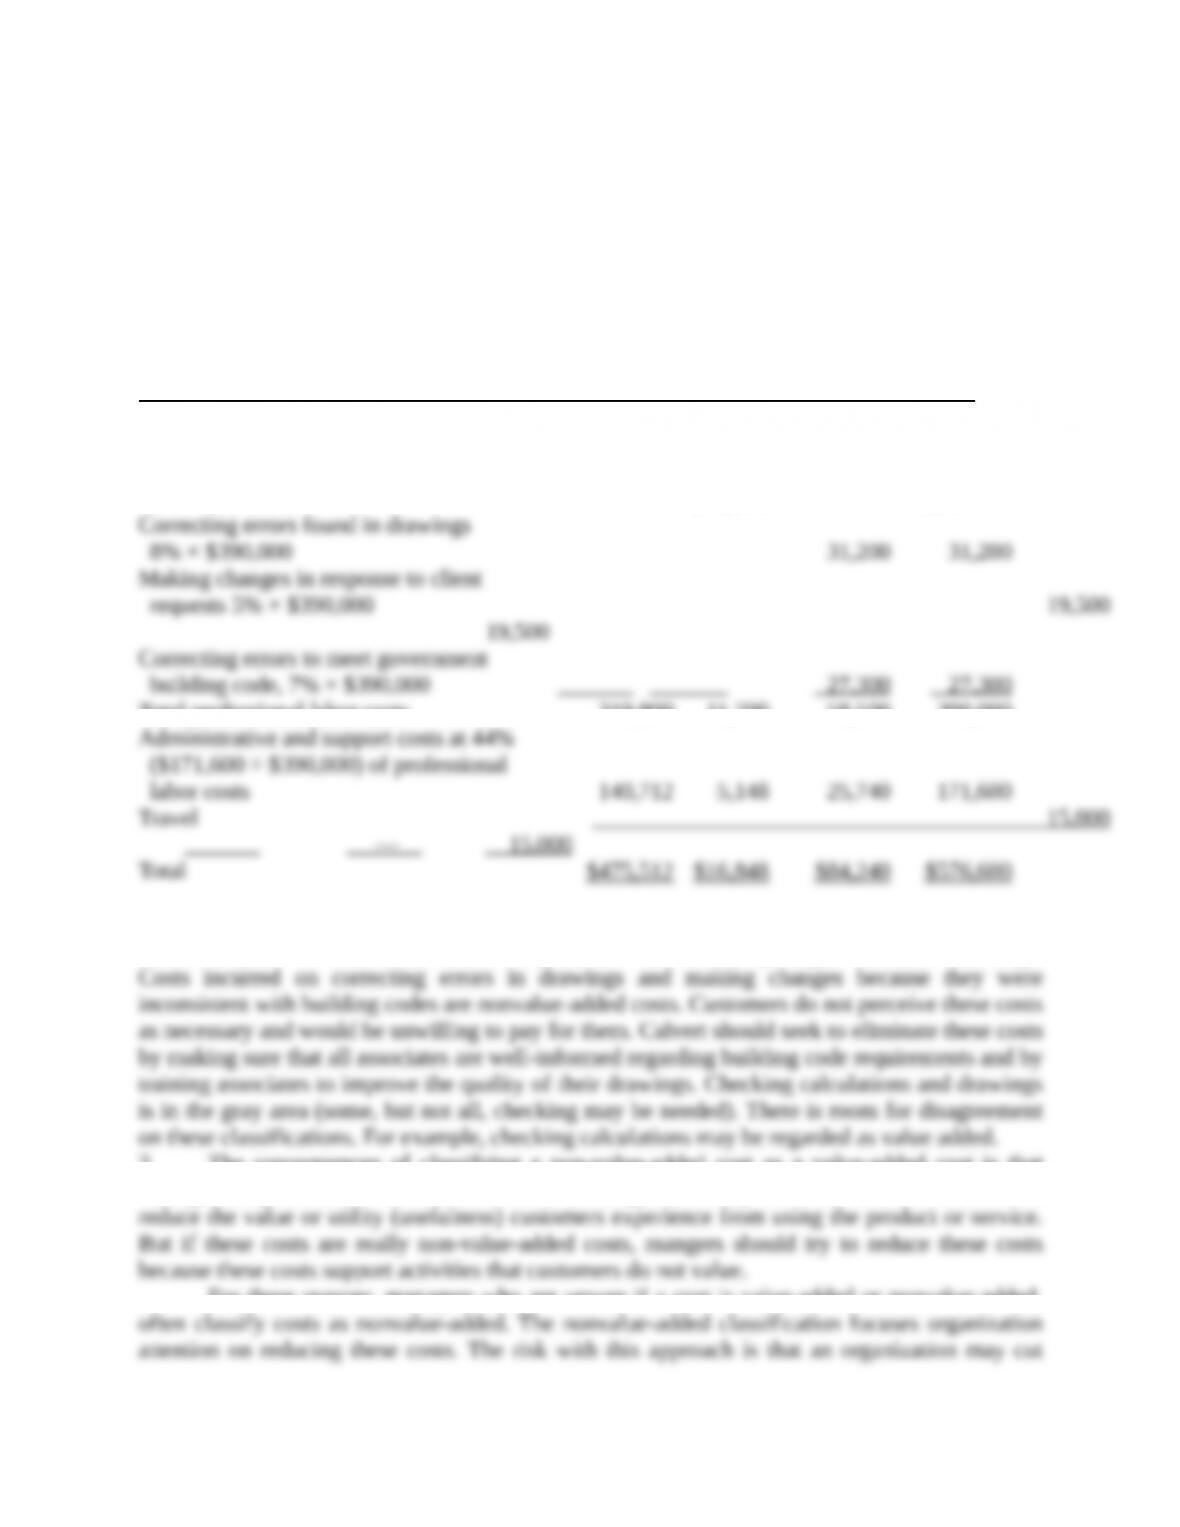
1. The classification of total costs in 2013 into value-added, nonvalue-added, or in the gray
area in between follows:
Value Gray Nonvalue- Total
Added Area added (4) =
(1) (2) (3) (1)+(2)+(3)
Doing calculations and preparing drawings
77% × $390,000 $300,300 $300,300
Checking calculations and drawings
3% × $390,000 $11,700 11,700
Correcting errors found in drawings
8% × $390,000 31,200 31,200
Making changes in response to client
requests 5% × $390,000 19,500 19,500
Correcting errors to meet government
building code, 7% × $390,000 27,300 27,300
Total professional labor costs 319,800 11,700 58,500 390,000
Administrative and support costs at 44%
($171,600 ÷ $390,000) of professional
labor costs 140,712 5,148 25,740 171,600
Travel 15,000 — 15,000
Total $475,512 $16,848 $84,240 $576,600
Doing calculations and responding to client requests for changes are value-added costs because
customers perceive these costs as necessary for the service of preparing architectural drawings.
Costs incurred on correcting errors in drawings and making changes because they were inconsistent
with building codes are nonvalue-added costs. Customers do not perceive these costs as necessary
and would be unwilling to pay for them. Calvert should seek to eliminate these costs by making
sure that all associates are well-informed regarding building code requirements and by training
associates to improve the quality of their drawings. Checking calculations and drawings is in the
gray area (some, but not all, checking may be needed). There is room for disagreement on these
classifications. For example, checking calculations may be regarded as value added.
2. The consequences of classifying a non-value-added cost as a value-added cost is that
managers may hesitate to reduce these costs thinking that if they eliminate these costs it would
reduce the value or utility (usefulness) customers experience from using the product or service. But
if these costs are really non-value-added costs, mangers should try to reduce these costs because
these costs support activities that customers do not value.
For these reasons, managers who are unsure if a cost is value-added or nonvalue-added,
often classify costs as nonvalue-added. The nonvalue-added classification focuses organization
attention on reducing these costs. The risk with this approach is that an organization may cut some
costs that are value-adding, leading to poor customer experiences. Distinguishing value-added
from nonvalue-added costs is valuable but also requires the exercise of careful judgment.
13-7
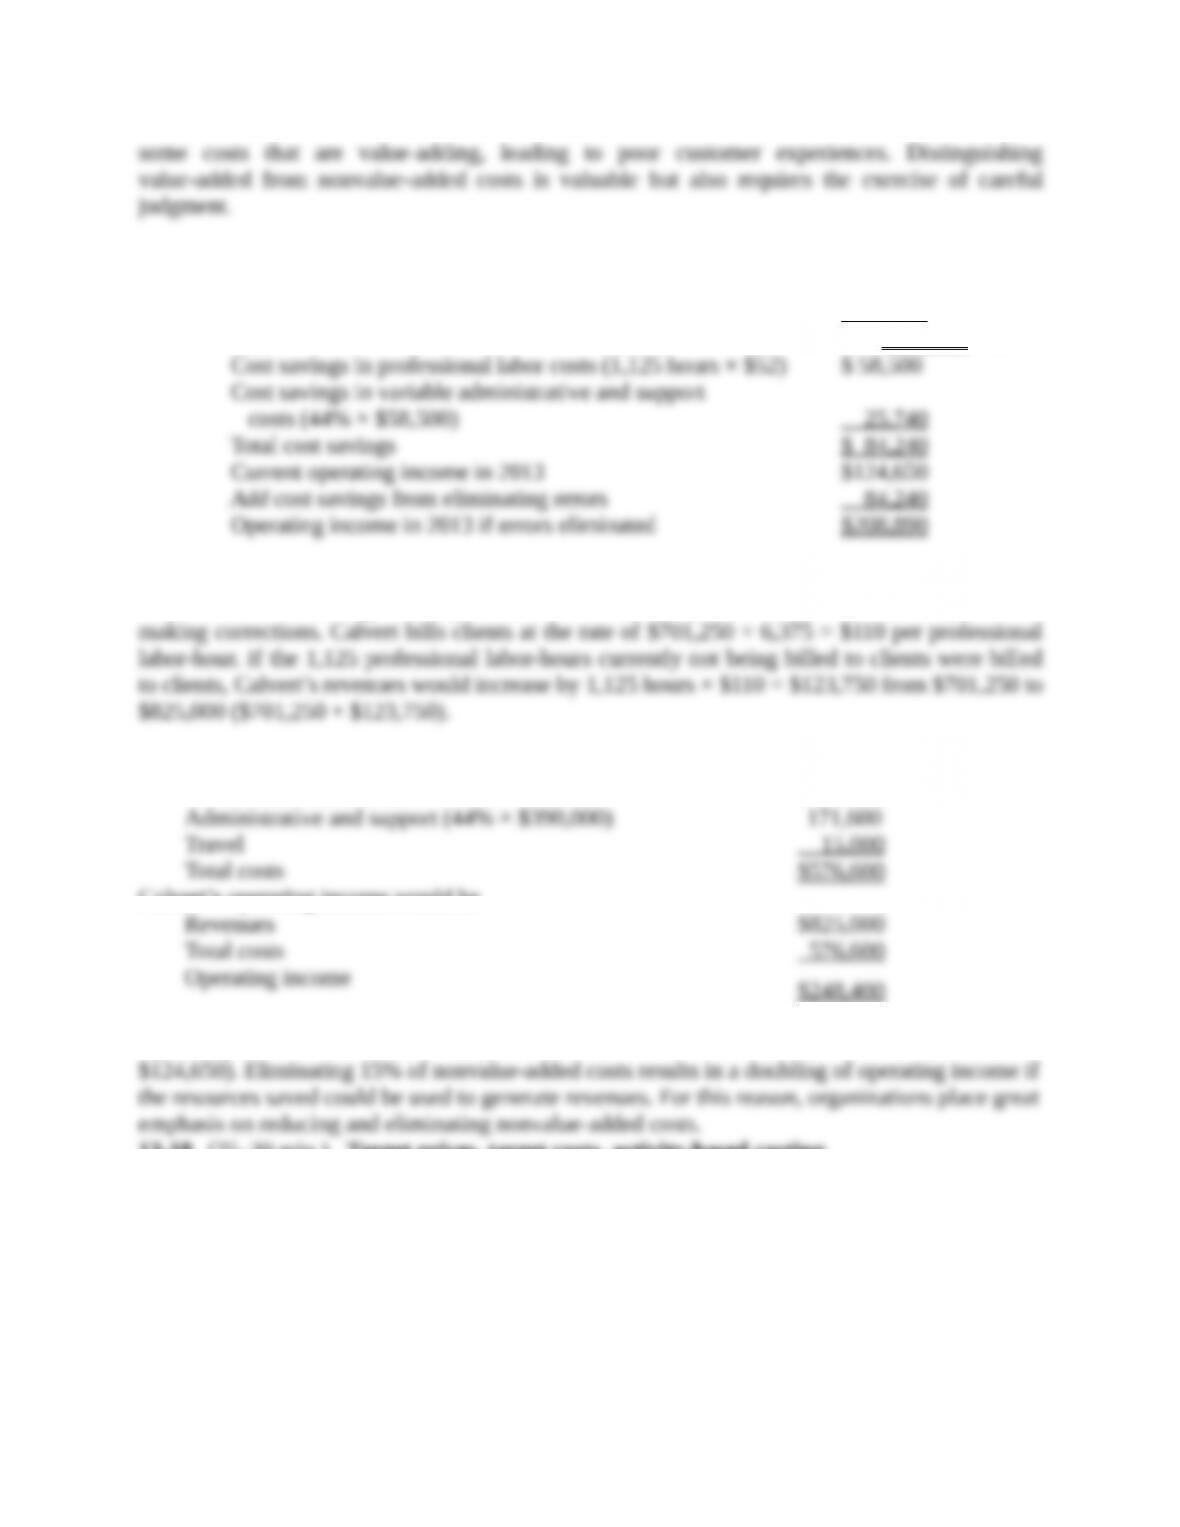
3 Reduction in professional labor-hours by
a. Correcting errors in drawings (8% × 7,500) 600 hours
b. Correcting errors to conform to building code (7% × 7,500) 525 hours
Total 1,125 hours
Cost savings in professional labor costs (1,125 hours × $52) $ 58,500
Cost savings in variable administrative and support
costs (44% × $58,500) 25,740
Total cost savings $ 84,240
Current operating income in 2013 $124,650
Add cost savings from eliminating errors 84,240
Operating income in 2013 if errors eliminated $208,890
4. Currently 85% × 7,500 hours = 6,375 hours are billed to clients generating revenues of
$701,250. The remaining 15% of professional labor-hours (15% × 7,500 = 1,125 hours) is lost in
making corrections. Calvert bills clients at the rate of $701,250 ÷ 6,375 = $110 per professional
labor-hour. If the 1,125 professional labor-hours currently not being billed to clients were billed to
clients, Calvert’s revenues would increase by 1,125 hours × $110 = $123,750 from $701,250 to
$825,000 ($701,250 + $123,750).
Costs remain unchanged
Professional labor costs $390,000
Administrative and support (44% × $390,000) 171,600
Travel 15,000
Total costs $576,600
Calvert’s operating income would be
Revenues $825,000
Total costs 576,600
Operating income $248,400
Operating income would increase by $123,750 ($248,400 – $124,650) or 99.3% ($123,750 ÷
$124,650). Eliminating 15% of nonvalue-added costs results in a doubling of operating income if
the resources saved could be used to generate revenues. For this reason, organizations place great
emphasis on reducing and eliminating nonvalue-added costs.
13-18 (25–30 min.) Target prices, target costs, activity-based costing.
Snappy Tiles is a small distributor of marble tiles. Snappy identifies its three major activities and
cost pools as ordering, receiving and storage, and shipping, and it reports the following details for
2013:
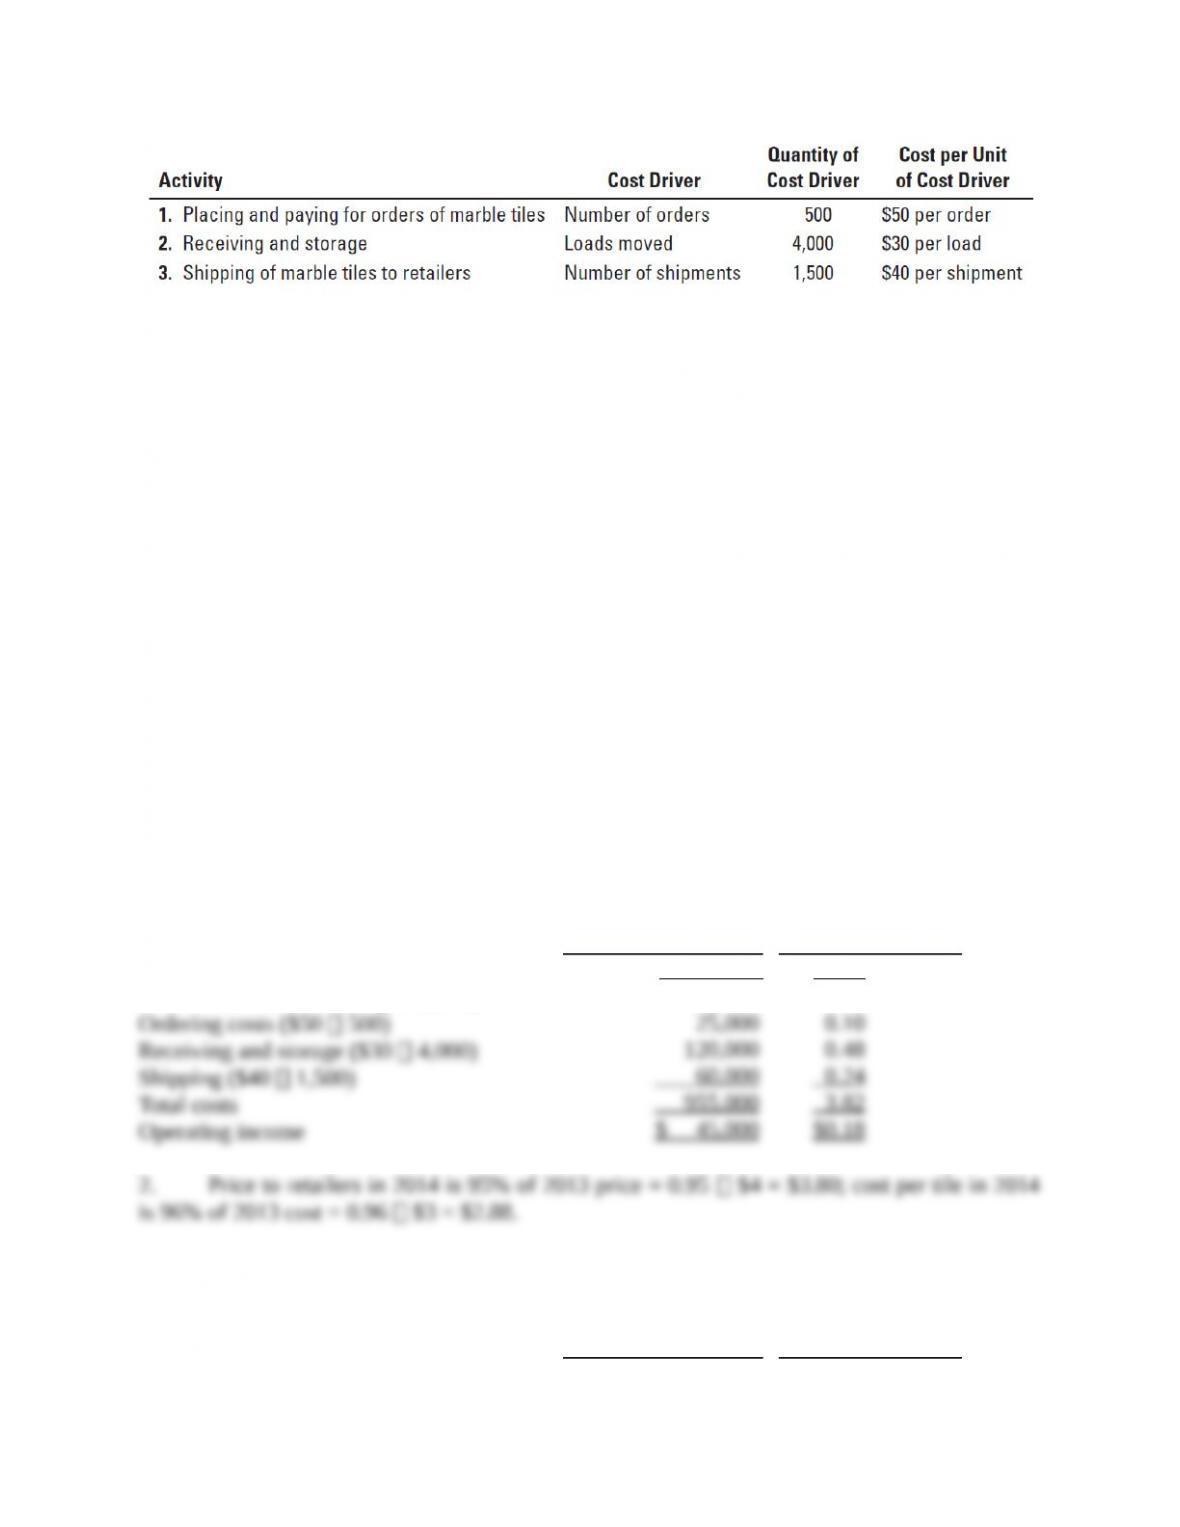
For 2013, Snappy buys 250,000 marble tiles at an average cost of $3 per tile and sells them to
retailers at an average price of $4 per tile. Assume Snappy has no fixed costs and no inventories.
Required:
1. Calculate Snappy’s operating income for 2013.
2. For 2014, retailers are demanding a 5% discount off the 2013 price. Snappy’s suppliers are
only willing to give a 4% discount. Snappy expects to sell the same quantity of marble tiles in
2014 as in 2013. If all other costs and cost-driver information remain the same, calculate
Snappy’s operating income for 2014.
3. Suppose further that Snappy decides to make changes in its ordering and receiving-and-storing
practices. By placing long-run orders with its key suppliers, Snappy expects to reduce the
number of orders to 200 and the cost per order to $25 per order. By redesigning the layout of
the warehouse and reconfiguring the crates in which the marble tiles are moved, Snappy
expects to reduce the number of loads moved to 3,125 and the cost per load moved to $28.
Will Snappy achieve its target operating income of $0.30 per tile in 2014? Show your
calculations.
SOLUTION
1. Snappy’s operating income in 2013 is as follows:
Total for
250,000 Tiles
(1)
Per Unit
(2) = (1) ÷ 250,000
Revenues ($4 250,000)
Purchase cost of tiles ($3 250,000)
Ordering costs ($50 500)
Receiving and storage ($30 4,000)
Shipping ($40 1,500)
Total costs
Operating income
$1,000,000
750,000
25,000
120,000
60,000
955,000
$ 45,000
$4.00
3.00
0.10
0.48
0.24
3.82
$0.18
2. Price to retailers in 2014 is 95% of 2013 price = 0.95 $4 = $3.80; cost per tile in 2014 is
96% of 2013 cost = 0.96 $3 = $2.88.
Snappy’s operating income in 2014 is as follows:
Total for
250,000 Tiles
(1)
Per Unit
(2) = (1) ÷ 250,000
Revenues ($3.80 250,000)
Purchase cost of tiles ($2.88 250,000)
Ordering costs ($50 500)
Receiving and storage ($30 4,000)
Shipping ($40 1,500)
Total costs
Operating income
$950,000
720,000
25,000
120,000
60,000
925,000
$ 25,000
$3.80
2.88
0.10
0.48
0.24
3.70
$0.10
13-9
3. Snappy’s operating income in 2014, if it makes changes in ordering and material handling,
will be as follows:
Total for
250,000 Tiles
(1)
Per Unit
(2) = (1) ÷ 250,000
Revenues ($3.80 250,000)
Purchase cost of tiles ($2.88 250,000)
Ordering costs ($25 200)
Receiving and storage ($28 3,125)
Shipping ($40 1,500)
Total costs
Operating income
$950,000
720,000
5,000
87,500
60,000
872,500
$ 77,500
$3.80
2.88
0.02
0.35
0.24
3.49
$0.31
Through better cost management, Snappy will be able to achieve its target operating income of
$0.30 per tile despite the fact that its revenue per tile has decreased by $0.20 ($4.00 – $3.80), while
its purchase cost per tile has decreased by only $0.12 ($3.00 – $2.88).
13-19 (20 min.) Target costs, effect of product-design changes on product costs.
Neuro Instruments uses a manufacturing costing system with one direct-cost category (direct
materials) and three indirect-cost categories:
a. Setup, production order, and materials-handling costs that vary with the number of batches
b. Manufacturing-operations costs that vary with machine-hours
c. Costs of engineering changes that vary with the number of engineering changes made
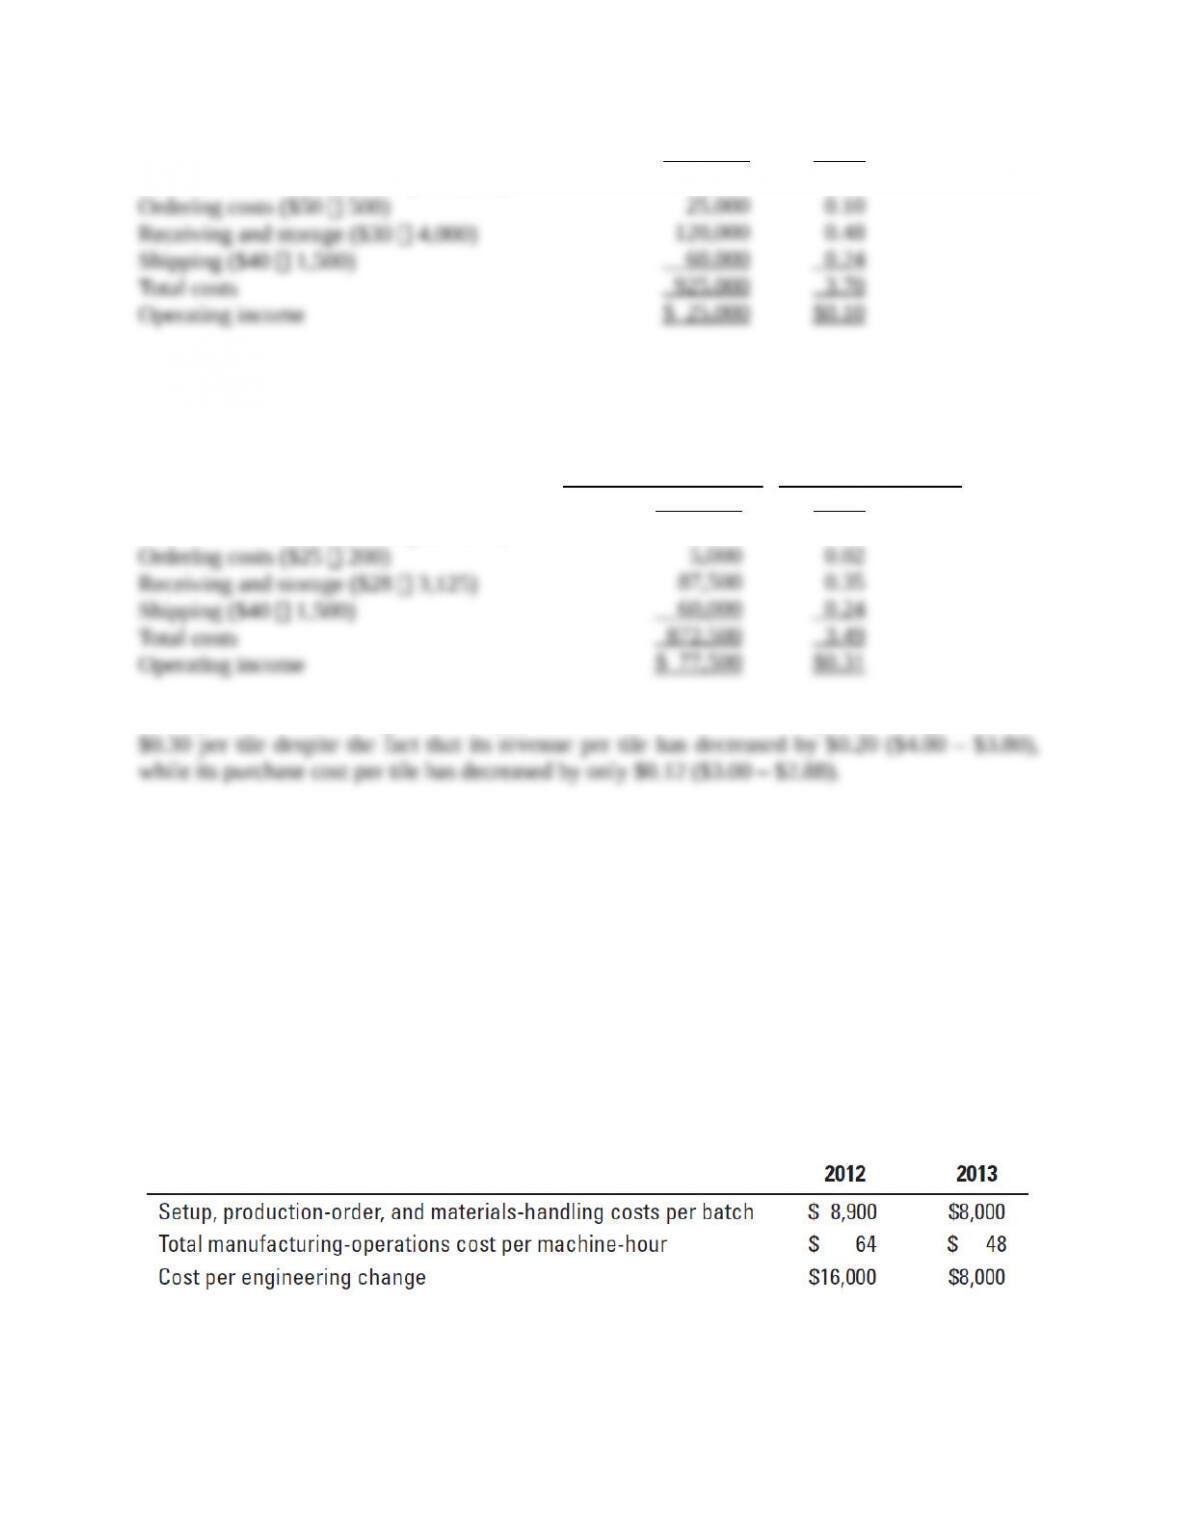
In response to competitive pressures at the end of 2012, Neuro Instruments used value-engineering
techniques to reduce manufacturing costs. Actual information for 2012 and 2013 is as follows:
The management of Neuro Instruments wants to evaluate whether value engineering has succeeded
in reducing the target manufacturing cost per unit of one of its products, HJ6, by 5%.
Actual results for 2012 and 2013 for HJ6 are:
13-10
Required:
1. Calculate the manufacturing cost per unit of HJ6 in 2012.
2. Calculate the manufacturing cost per unit of HJ6 in 2013.
3. Did Neuro Instruments achieve the target manufacturing cost per unit for HJ6 in 2013?
Explain.
4. Explain how Neuro Instruments reduced the manufacturing cost per unit of HJ6 in 2013.
5. What challenges might managers at Neuro Instruments encounter in achieving the target cost?
How might they overcome these challenges?


