10-40 (30 min.) Cost estimation, learning curves (continuation of 10-39).
Inbee is concerned that she still does not understand the relationship between output and labor
consumption. She consults with Jim Park, the head of engineering, and shares the results of her
regression estimation. Jim indicates that the production of new smartphone models exhibits
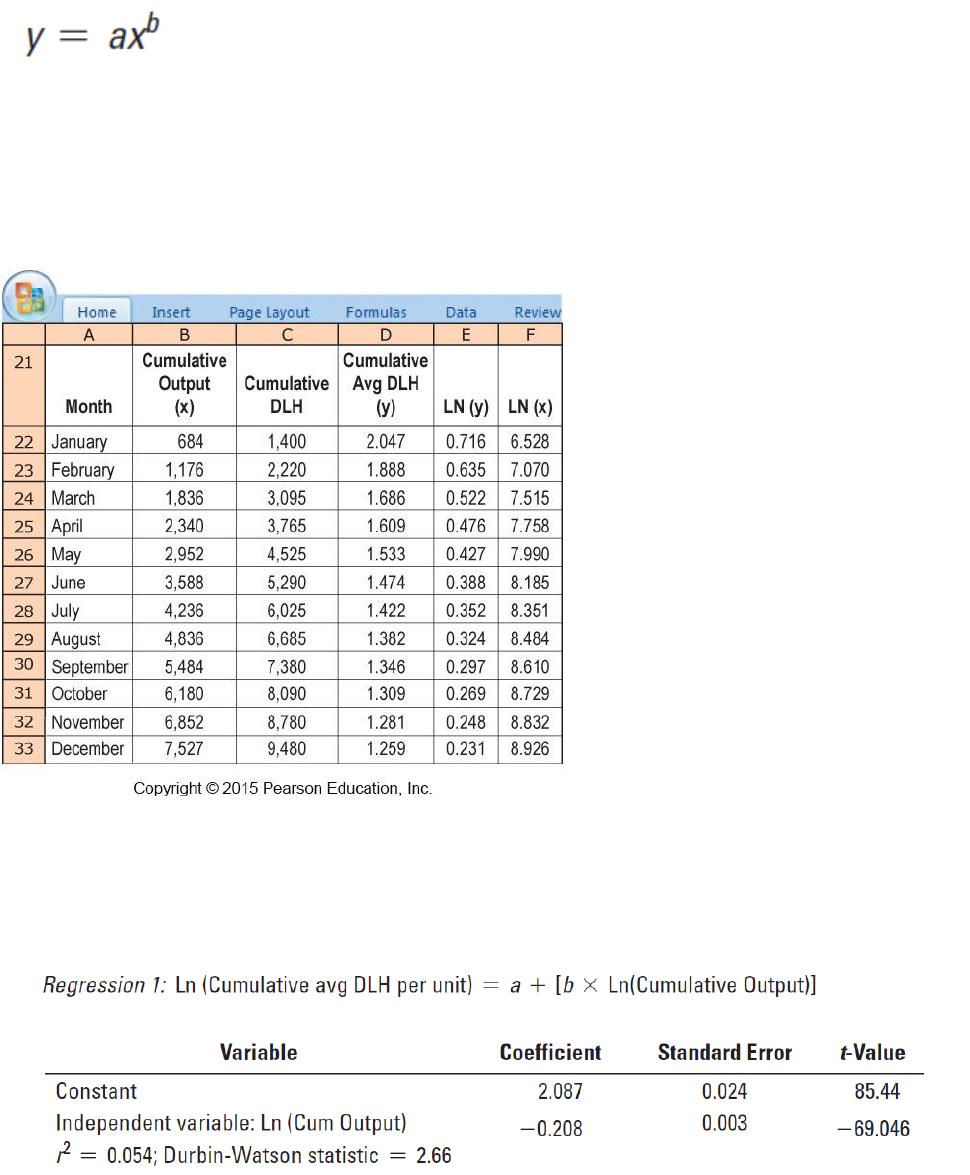
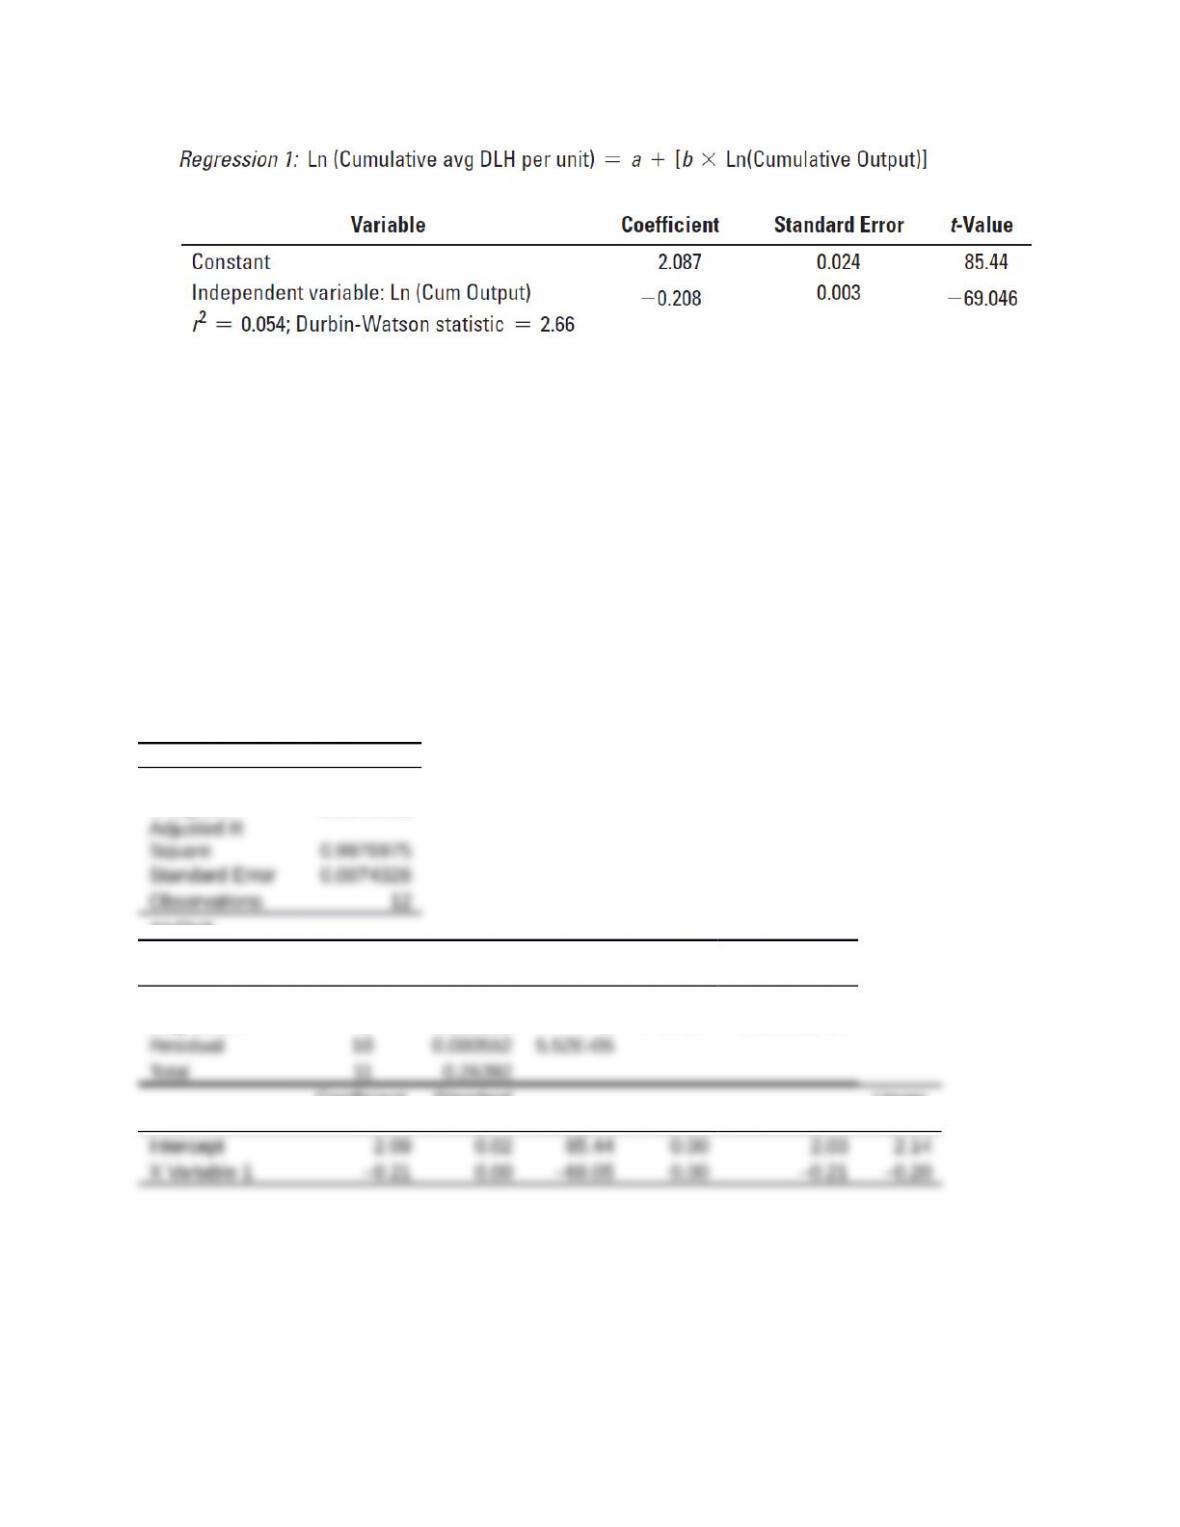
is precisely the above specification, and in particular, the slope coefficient directly yields the “b”
from the learning curve equation. We know, therefore, that for Hankuk electronics, b = –0.208. As
explained in Exhibit 10-10, this value is related to the learning curve percentage as follows:
b = Ln(learning-curve % in decimal form)/Ln 2, or
–0.208 = Ln(learning-curve % in decimal form)/0.693, or
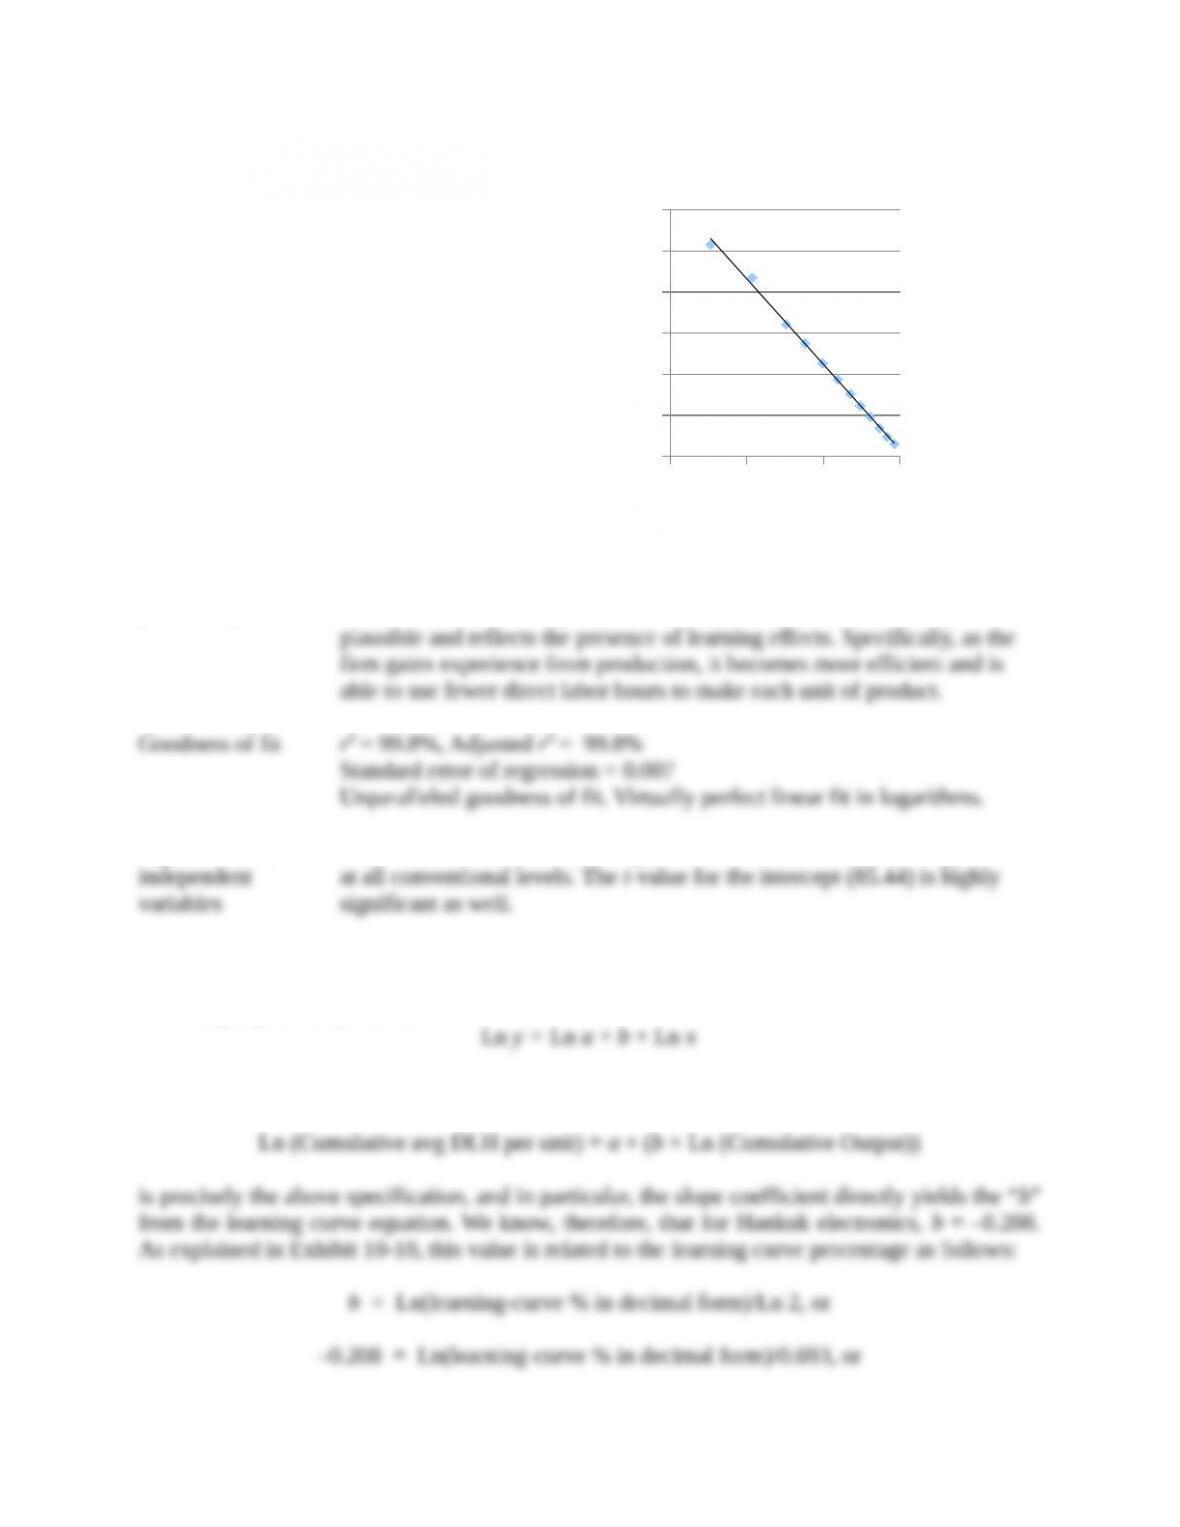
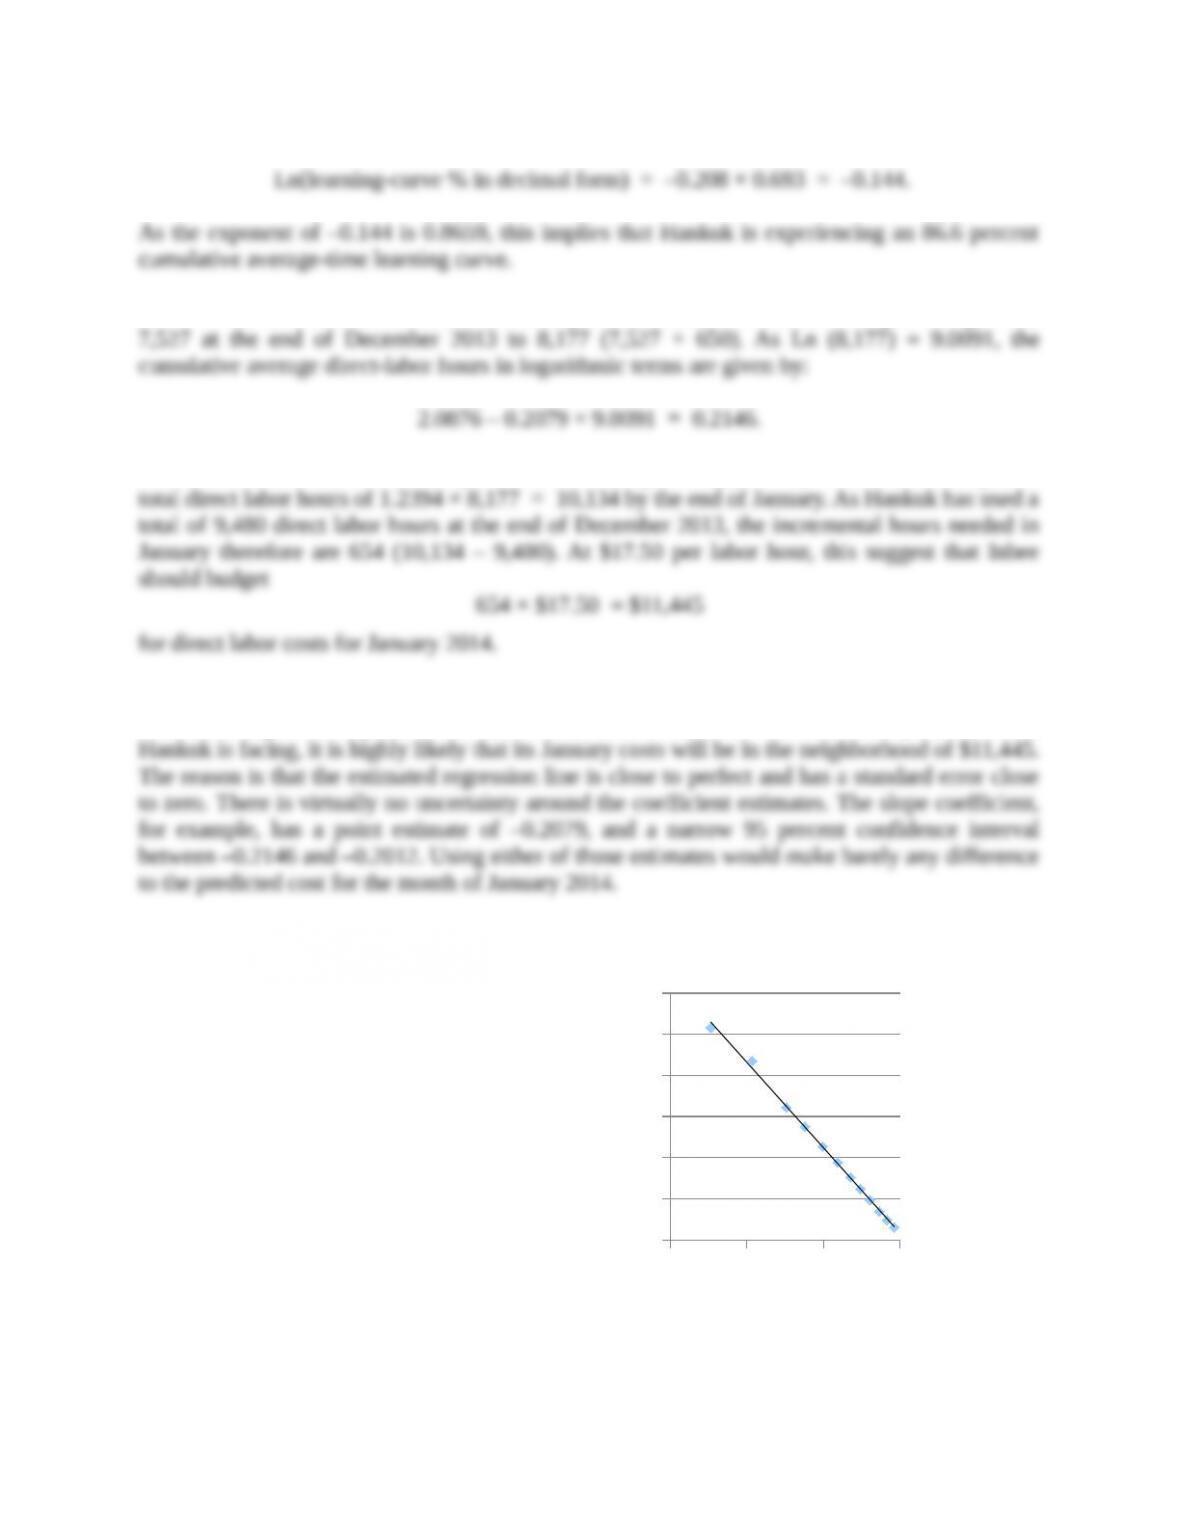
y = -0.2079x + 2.0876
R² = 0.9979
0.200
0.300
0.400
0.500
0.600
0.700
0.800
6.000 6.500 7.000 7.500 8.000 8.500 9.000
Log of Cumulative Average DLH per unit
Log of Cumulative Output
Hankuk Electronics
0.200
0.300
6.000 6.500 7.000 7.500 8.000 8.500 9.000
Log of Cumulative Average DLH per unit
Log of Cumulative Output
Coefficients
Standard
Error
t Stat
P-value
Lower 95%
Upper
95%
Intercept
51999.64
7988.68
6.51
0.00
34199.74
69799.54
X Variable 1
–0.98
1.99
–0.49
0.63
–5.41
3.45
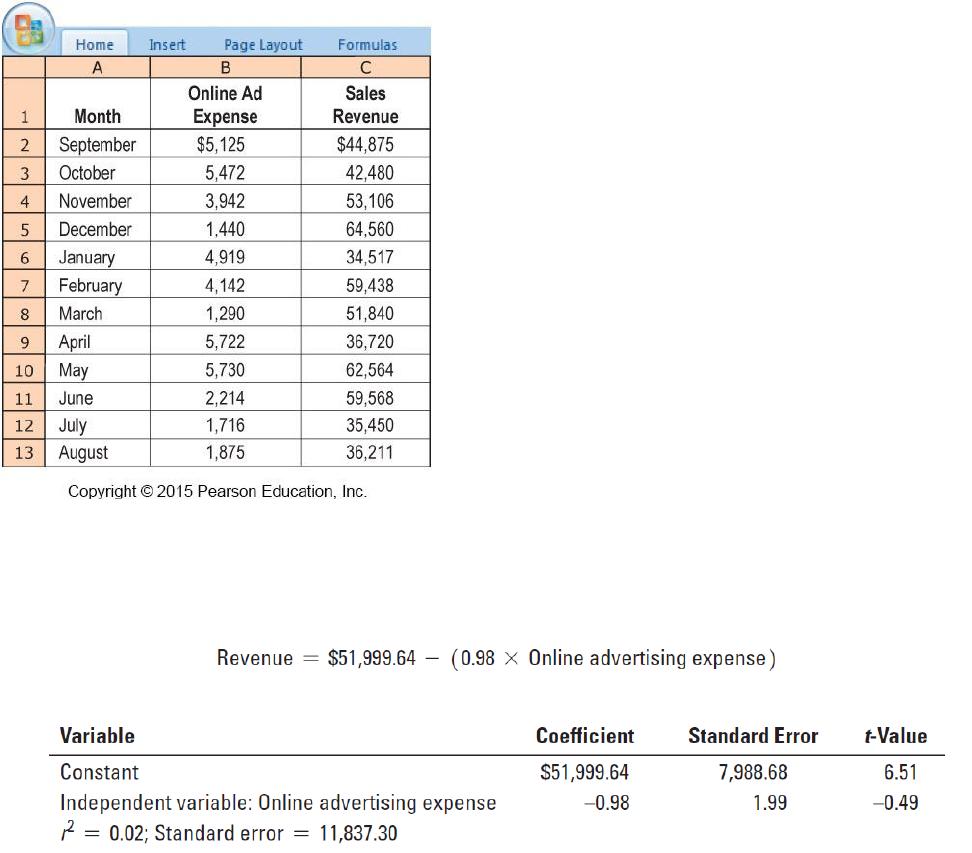
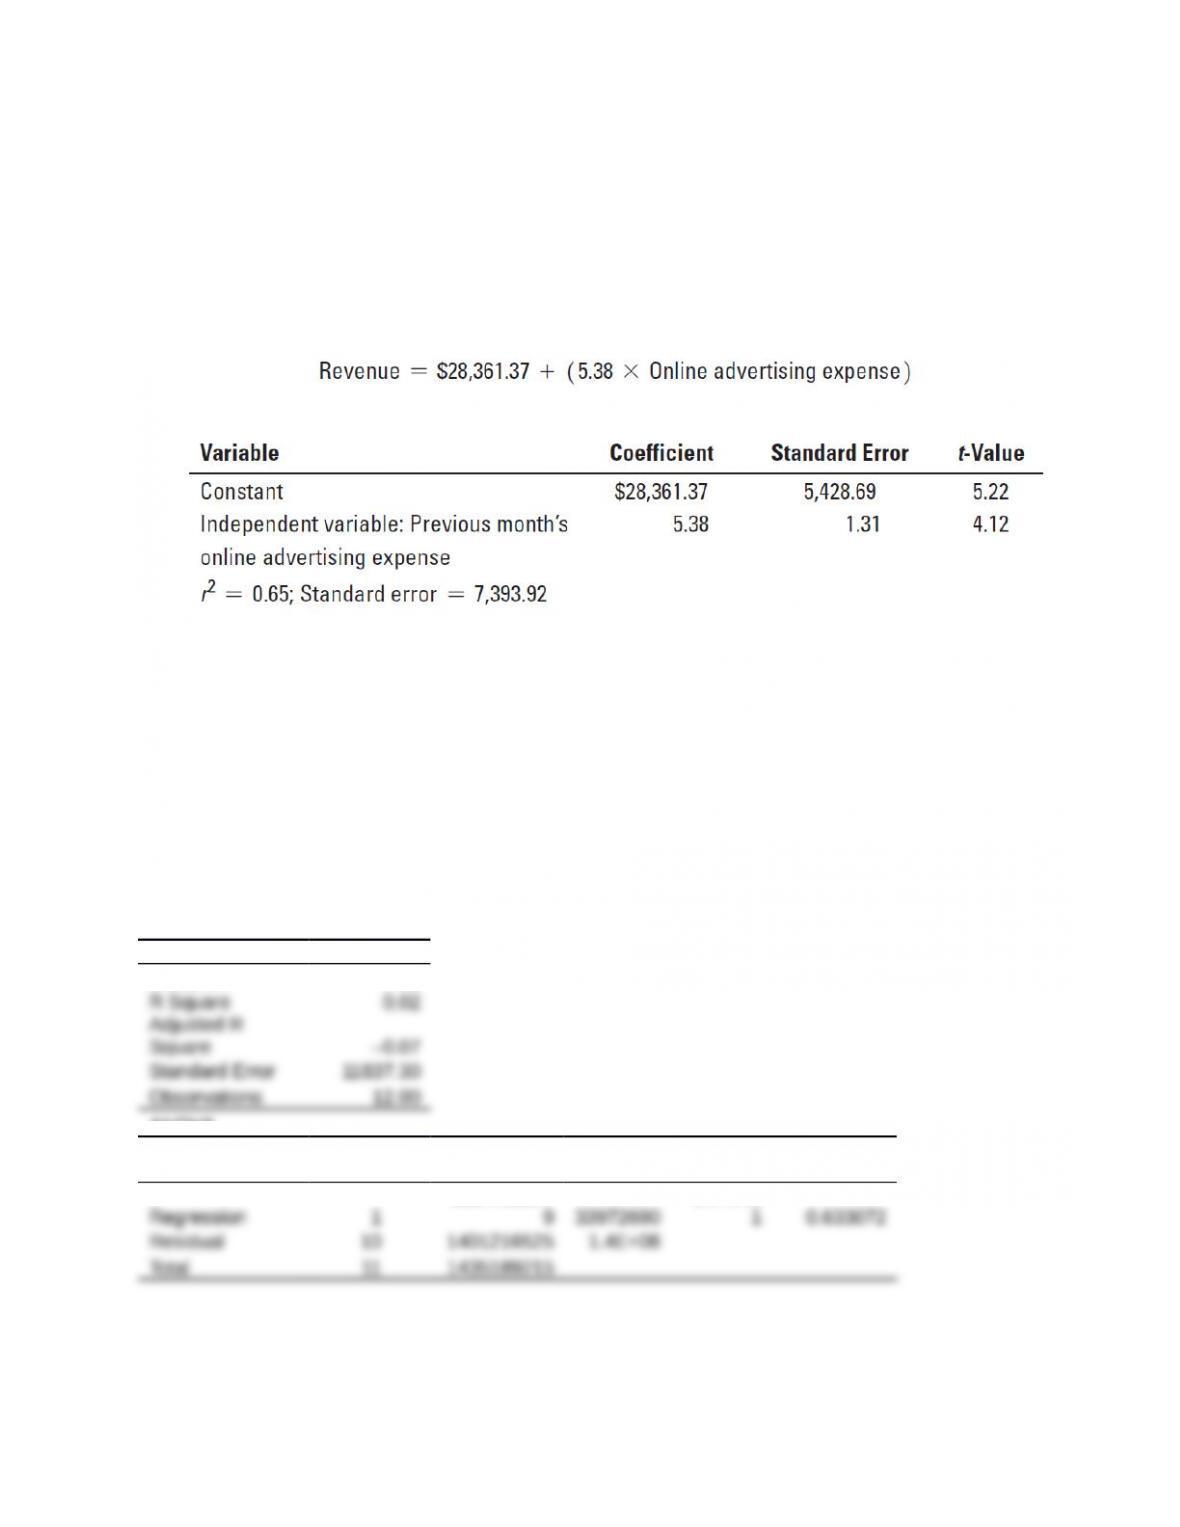
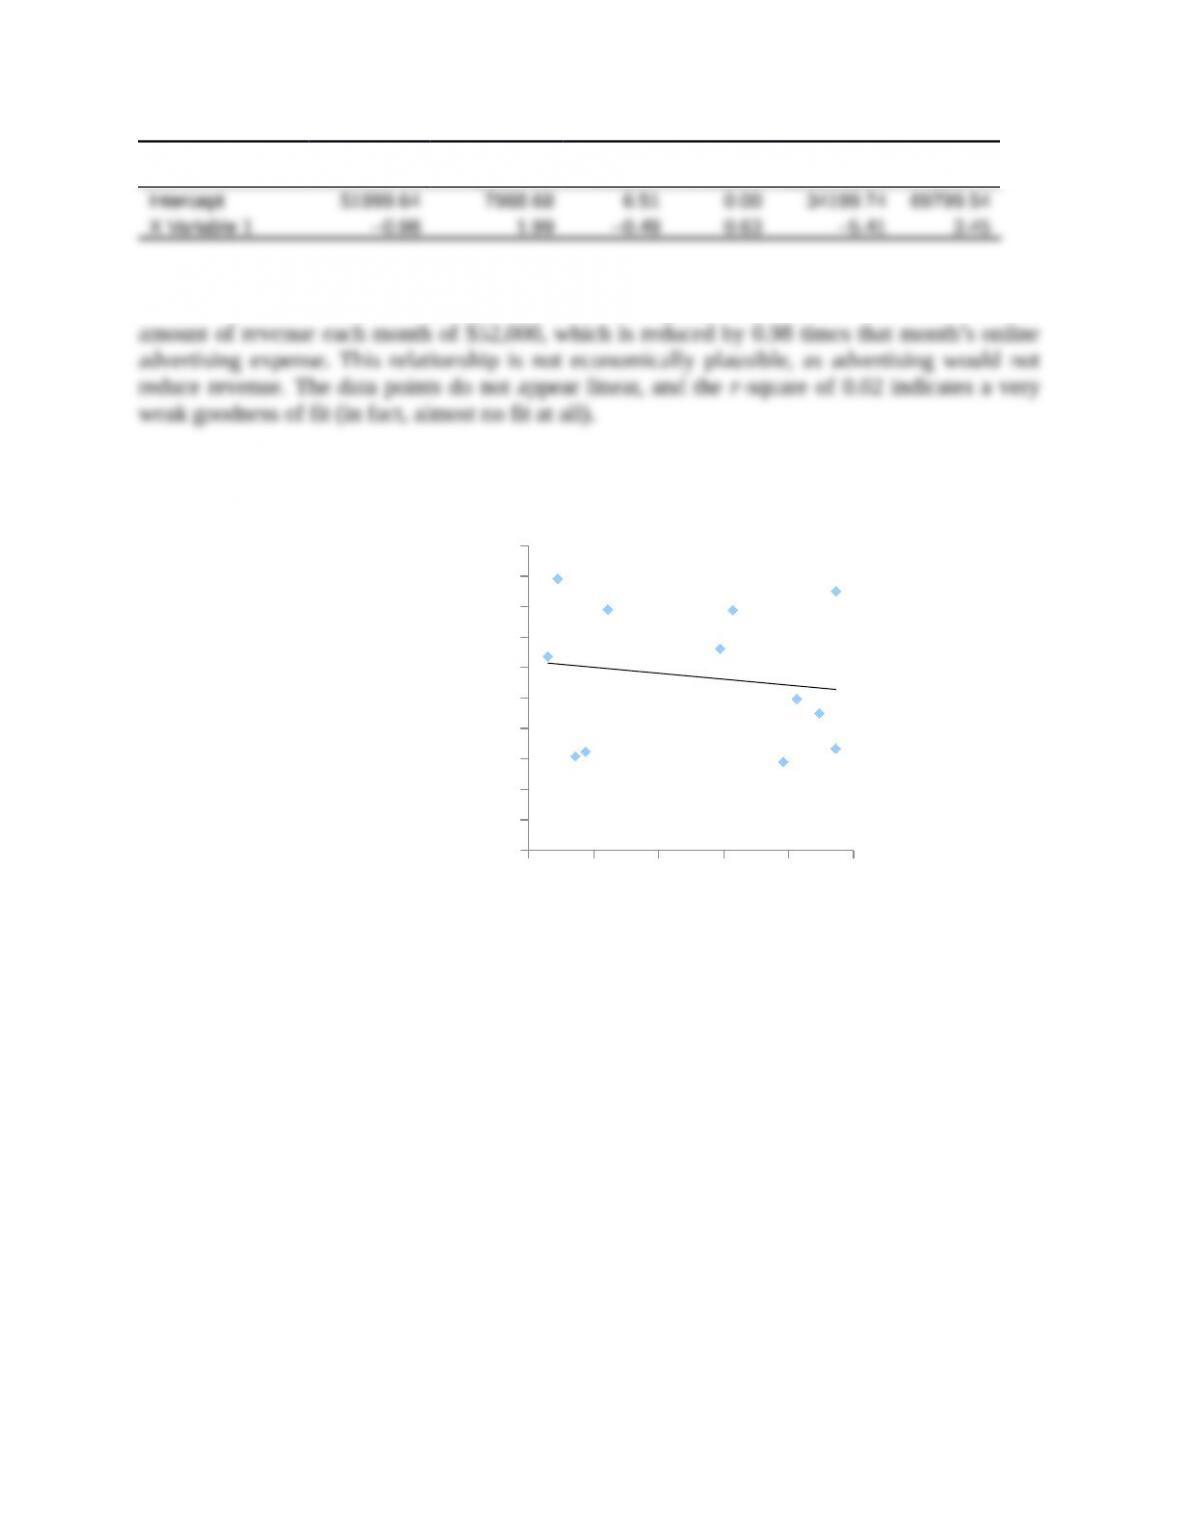
2. SOLUTION EXHIBIT 10-41A presents the data plot for the initial analysis. The formula
of Sales Revenue = $52,000 – (0.98 × Online advertising expense) indicates that there is a fixed
amount of revenue each month of $52,000, which is reduced by 0.98 times that month’s online
advertising expense. This relationship is not economically plausible, as advertising would not
reduce revenue. The data points do not appear linear, and the r-square of 0.02 indicates a very
weak goodness of fit (in fact, almost no fit at all).
SOLUTION EXHIBIT 10-41 A
Plot and Regression Line for Sales Revenue and Online Advertising Expense
y = -0.9789x + 52000
R² = 0.0237
$20,000
$25,000
$30,000
$35,000
$40,000
$45,000
$50,000
$55,000
$60,000
$65,000
$70,000
$0 $1,000 $2,000 $3,000 $4,000 $5,000 $6,000 $7,000
Sales Revenue
Online Advertising Expense