20.3 Wright Company’s information system was developed in stages over the past
five years. During the design process, department heads specified the
information and reports they needed. By the time development began, new
department heads were in place, and they requested additional reports.
Reports were discontinued only when requested by a department head. Few
reports were discontinued, and a large number are generated each period.
Management, concerned about the number of reports produced, asked
internal auditing to evaluate system effectiveness. They determined that
more information was generated than could be used effectively and noted
the following reactions:
Many departments did not act on reports during peak activity periods.
They let them accumulate in the hope of catching up later.
Some had so many reports they did not act at all or misused the
information.
Frequently, no action was taken until another manager needed a decision
made. Department heads did not develop a priority system for acting on
the information.
Department heads often developed information from alternative,
independent sources. This was easier than searching the reports for the
needed data.
a. Explain whether each reaction is a functional or dysfunctional behavioral response.
1. . Avoiding or delaying activity on reports during peak activity periods is
dysfunctional if they contain information that could improve company performance. If
2. . Having so many reports that no action or the wrong action is taken means that the
3. . It is dysfunctional when a department head does not refer to report data until a fellow
4. . The department head’s actions are both functional and dysfunctional. Developing
information from alternative sources is dysfunctional because the formal system is not
b. Recommend procedures to eliminate dysfunctional behavior and prevent its recurrence.
20.4 The controller of Tim’s Travel (TT) is deciding between upgrading the
company’s existing computer system or replacing it with a new one. Upgrading the
four-year-old system will cost $97,500 and extend its useful life for another seven years.
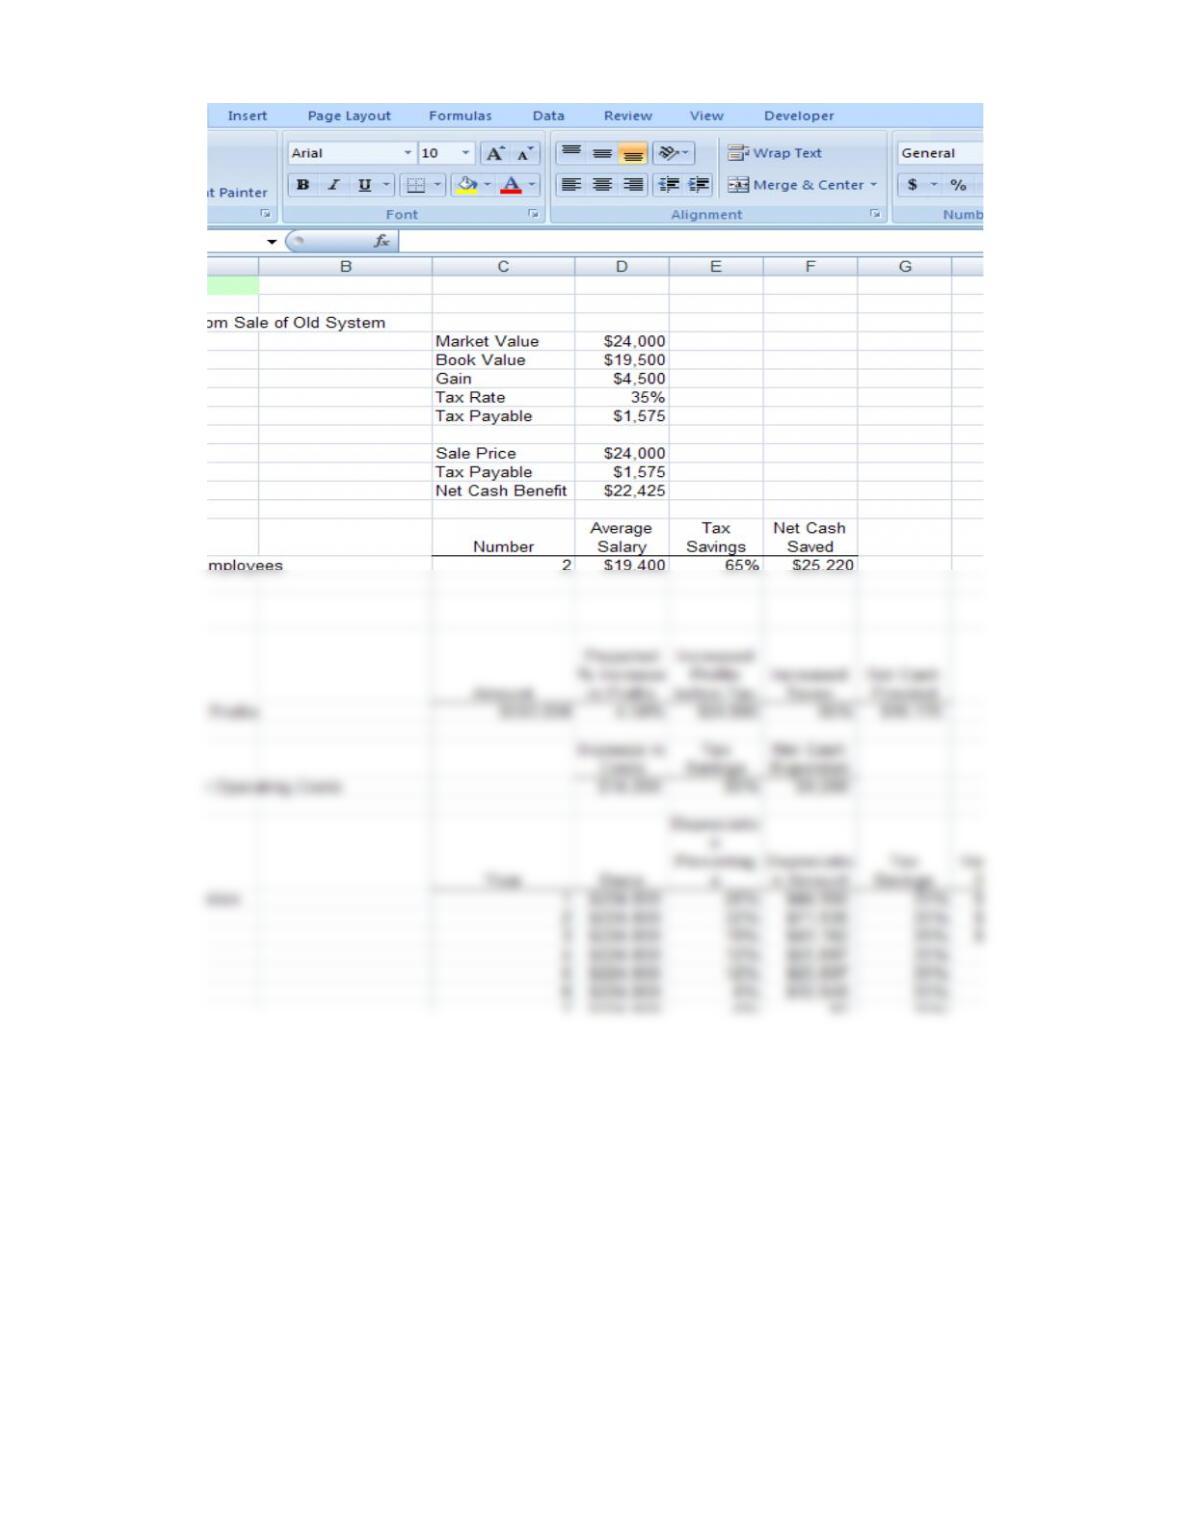
The book value is $19,500, although it would sell for $24,000. Upgrading will eliminate
one employee at a salary of $19,400; the new computer will eliminate two employees.
Additional annual operating costs are estimated at $15,950 per year. Upgrading is
expected to increase profits 3.5% above last year’s level of $553,000.
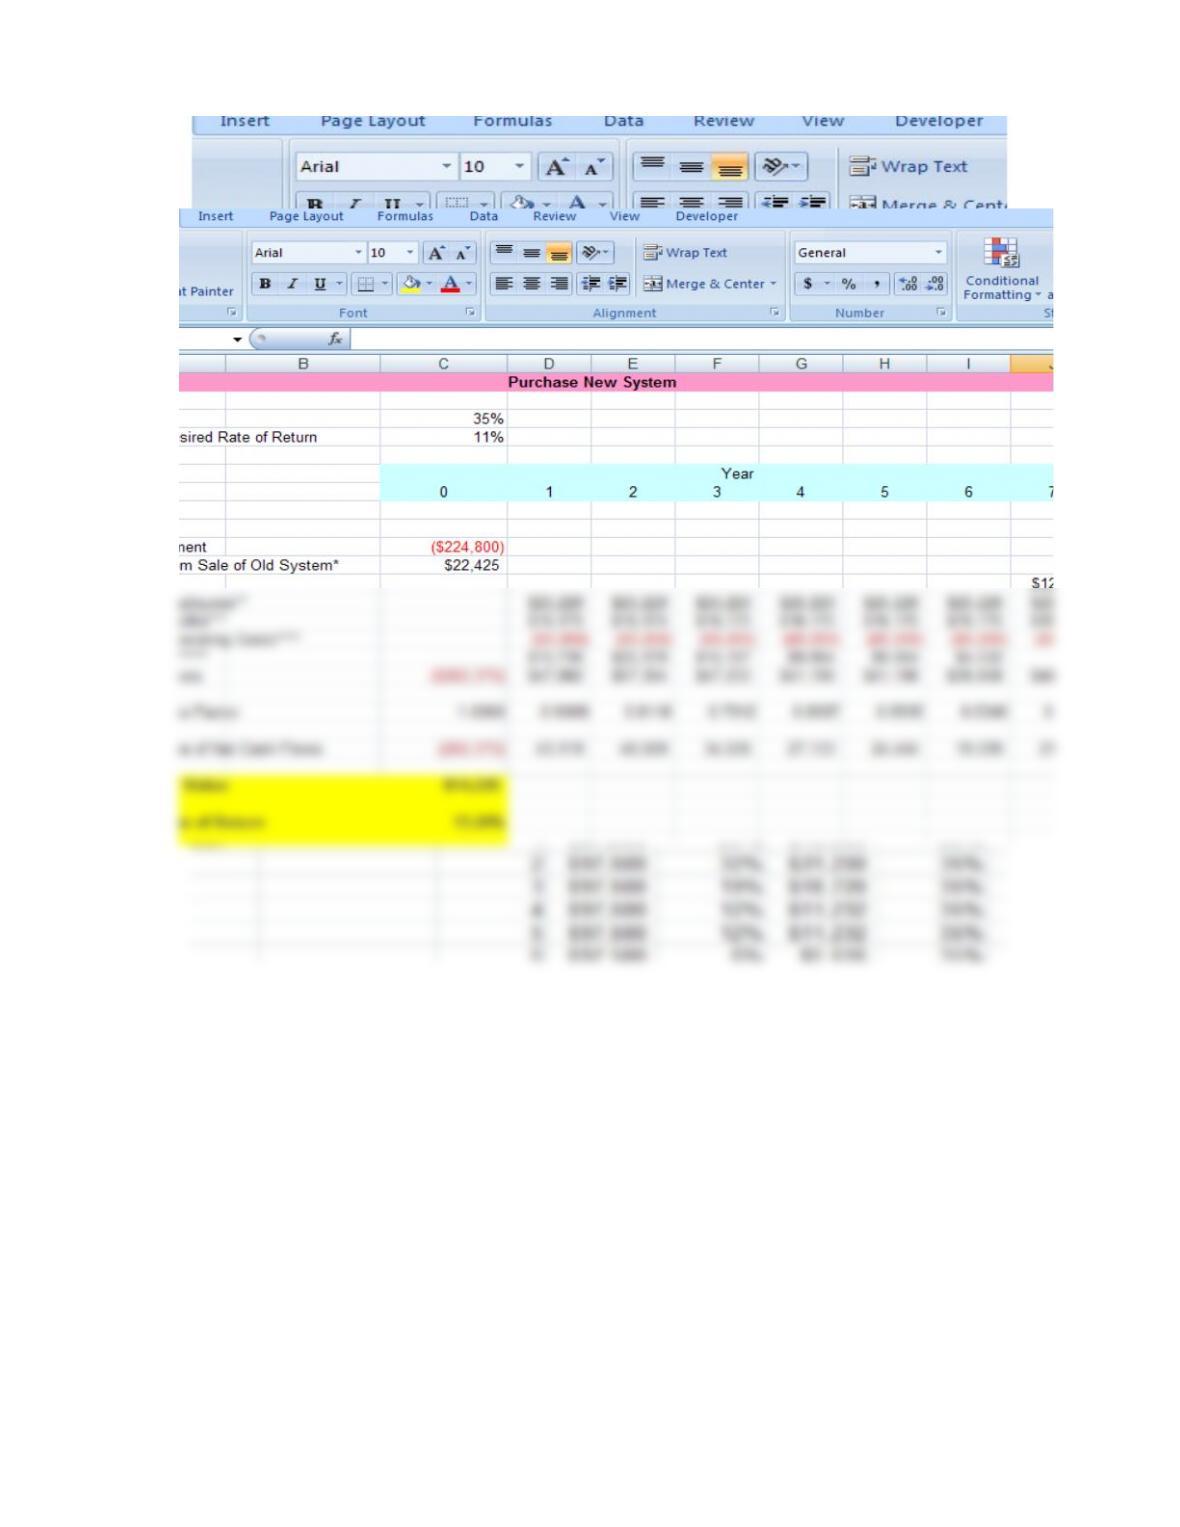
The BetaTech Company has quoted a price of $224,800 for a new computer with a useful life
of seven years. Annual operating costs are estimated to be $14,260. The average processing
speed of the new computer is 12% faster than that of other systems in its price range, which
would increase TT’s profits by 4.5%.
Tim’s present tax rate is 35%, and the cost of financing (minimum desired rate of return) is 11%.
After seven years, the salvage value, net of tax, would be $12,000 for the new computer and
$7,500 for the present system. For tax purposes, computers are depreciated over five full years
(six calendar years; a half year the first and last years), and the depreciation percentages are
as follows:
Year Percent (%)
1 20.00
2 32.00
3 19.20
4 11.52
5 11.52
6 5.76
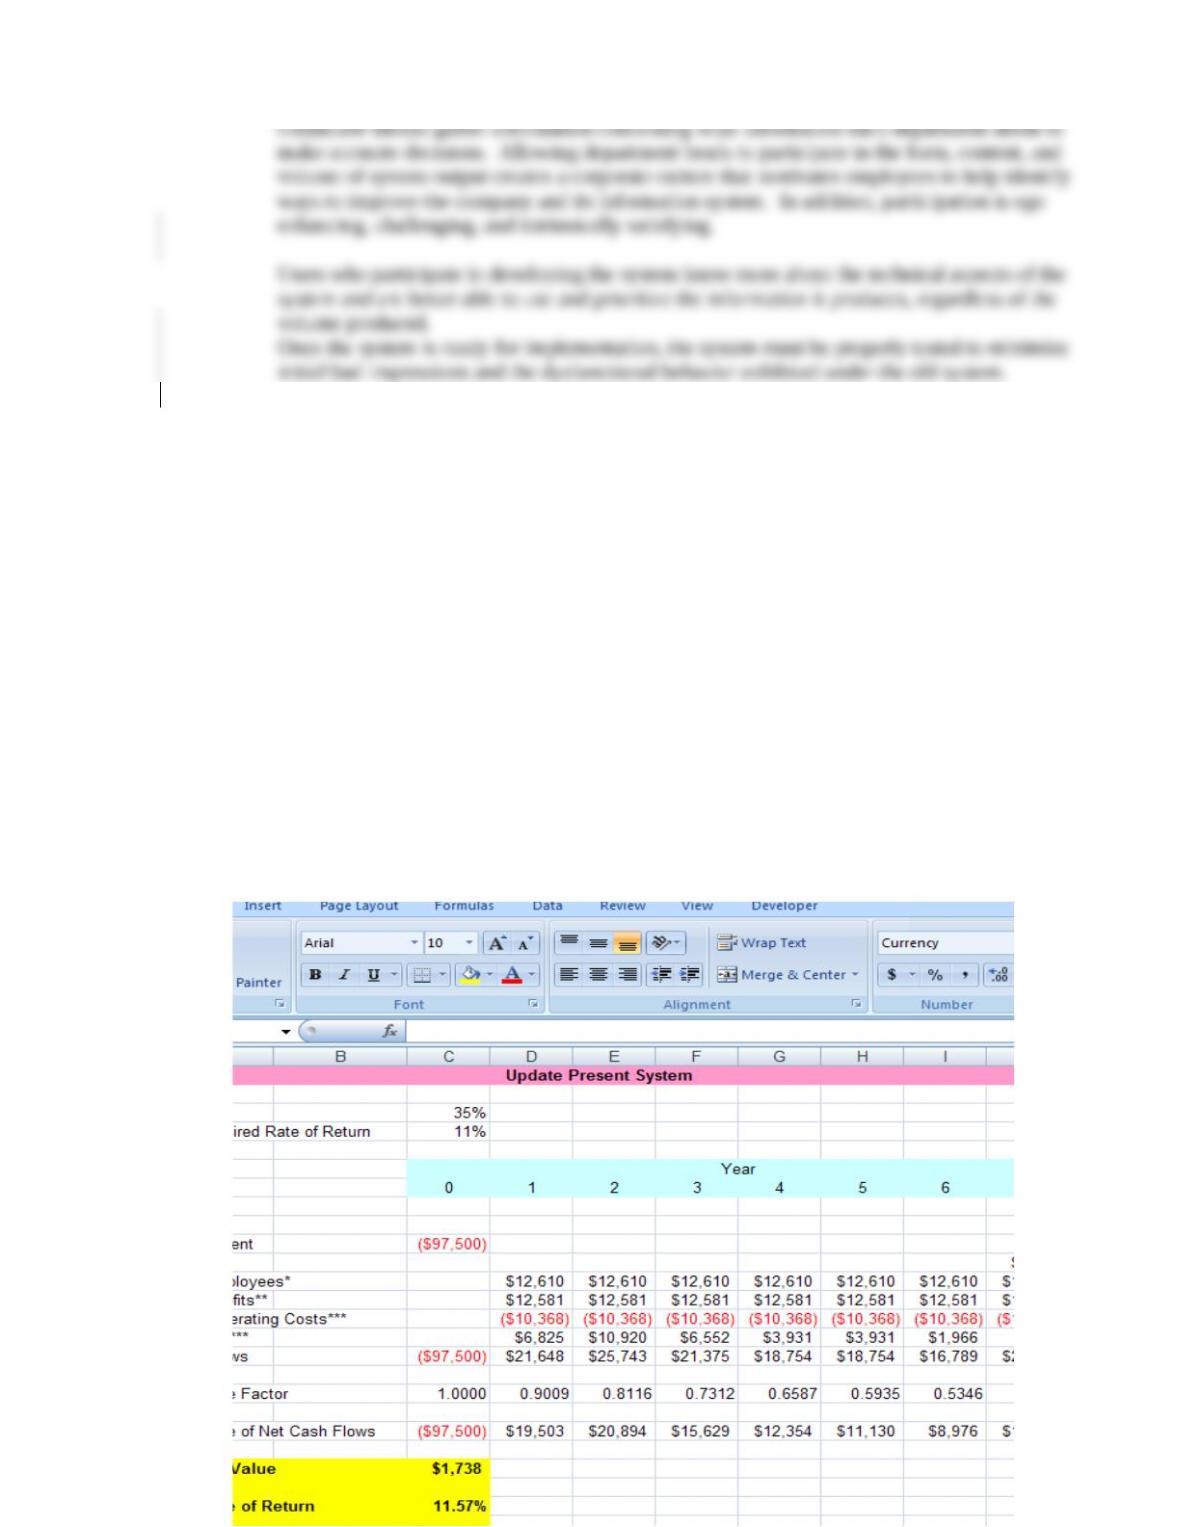
Using a spreadsheet package, prepare an economic feasibility analysis to determine if Tim’s
Travel should rehabilitate the old system or purchase the new computer. As part of the
analysis, compute the after-tax cash flows for years 1 through 7 and the payback, NPV, and
IRR of each alternative.
As shown below, Tim’s Travel would be better off economically to purchase a new system rather
than updating the existing one. Tim’s Travel can achieve a 13.26% return by purchasing a new
system and an 11.57% return by updating the old system.
Note: For illustrative purposes, all calculations other than NPV and IRR have been rounded to zero
decimal places. All costs and savings amounts are show net of tax effects.
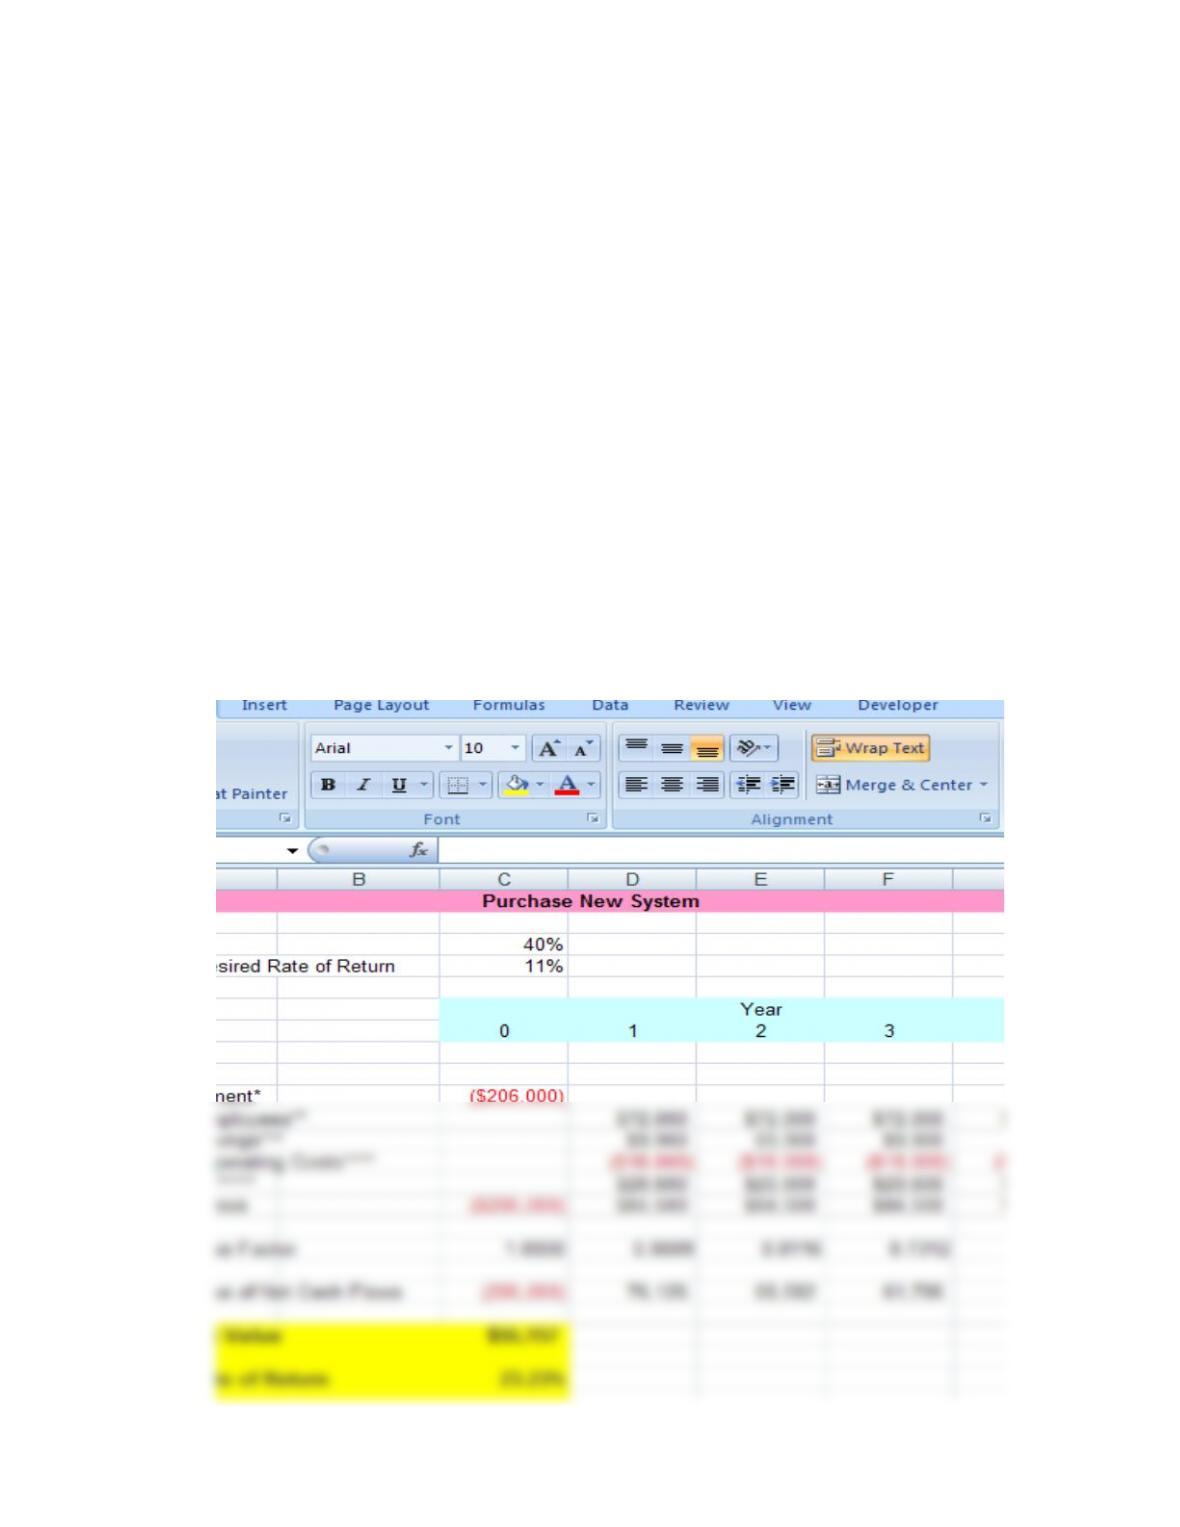
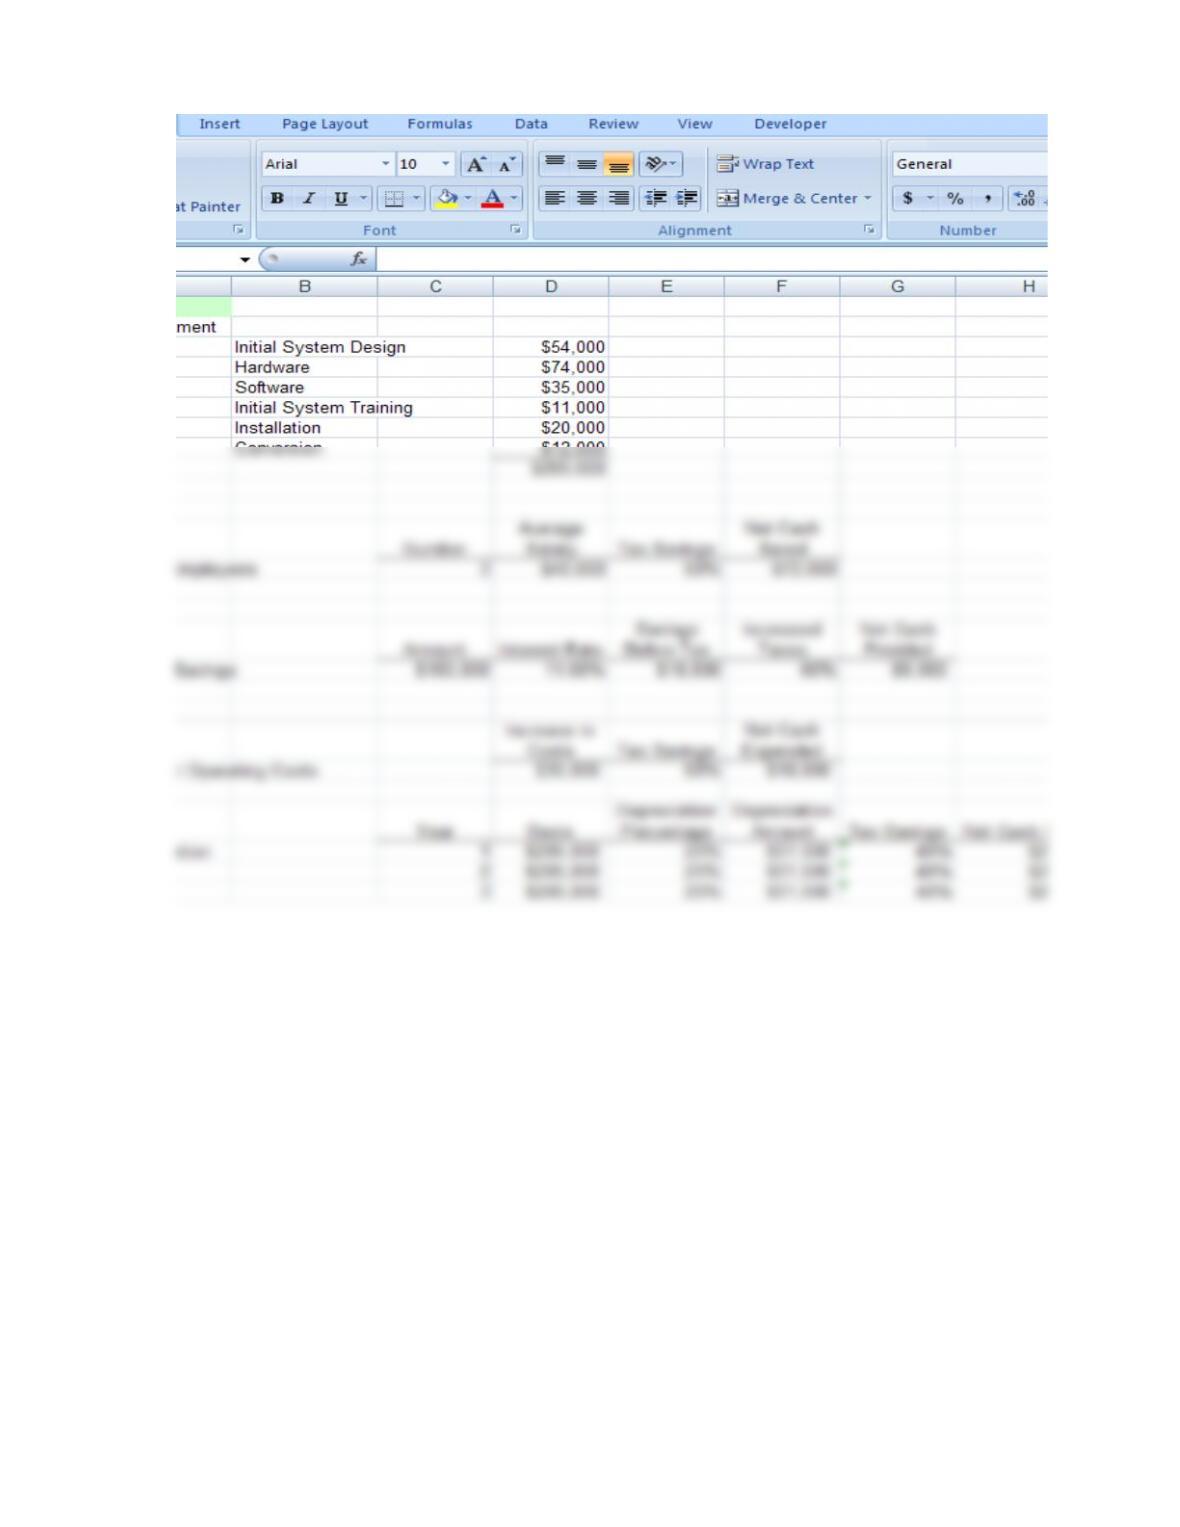
20.5. Rossco is considering the purchase of a new computer with the
following estimated costs: initial systems design, $54,000; hardware,
$74,000; software, $35,000, one-time initial training, $11,000; system
installation, $20,000; and file conversion, $12,000. A net reduction of
three employees is expected, with average yearly salaries of $40,000.
The system will decrease average yearly inventory by $150,000.
Annual operating costs will be $30,000 per year.
The expected life of the machine is four years, with an estimated
salvage value of zero. The effective tax rate is 40%. All computer
purchase costs will be depreciated using the straight-line method
over its four-year life. Rossco can invest money made available from
the reduction in inventory at its cost of capital of 11%. All cash 6ows,
except for the initial investment and start-up costs, are at the end of
the year. Assume 365 days in a year.
Use a spreadsheet to perform a feasibility analysis to determine if Rossco should purchase the
computer. Compute the following as part of the analysis: initial investment, after-tax cash
flows for years 1 through 4, payback period, net present value, and internal rate of return.
Rossco should proceed with the purchase. The internal rate of return of 23.23% is higher than the
hurdle rate of 11%. There is a positive NPV of $56,157. Payback is in 2.44 years.
20.6 A recently completed feasibility study to upgrade XYZ’s computer system shows the following
benefits. Compensation figures in parentheses include wages, benefits, and payroll taxes.
1. Production
a. Market forecasts, which take two $400 person-days a month, will be more accurate
with software making the calculations.
b. Effective inventory control will prevent part stockouts and reduce inventory by
$1,000,000. XYZ’s cost of capital is 20%.
c. Detailed evaluations of plan changes will increase production flexibility, reduce sales
losses, and eliminate two clerks ($75,000 each).
2. Engineering
a. Computerized updating of bills of material and operations lists will save 40% of an
engineer’s ($100,000) and 25% of a clerk’s ($60,000) time.
b. Computerized calculations of labor allocations, rates, and bonus details will save
40% of a clerk’s ($80,000) time.
3. Sales. Improved reporting will enable the five-person sales staff to react more quickly to
the market, producing a $10,000 per person sales increase.
4. Marketing. Revised reports and an improved forecasting system will increase net income
by $50,000.
5. Accounting
a. Quickly determining new product costs will save 30% of the accountant’s ($100,000)
time.
b. An incentive earnings system will save 40% of the payroll clerk’s ($60,000) time.
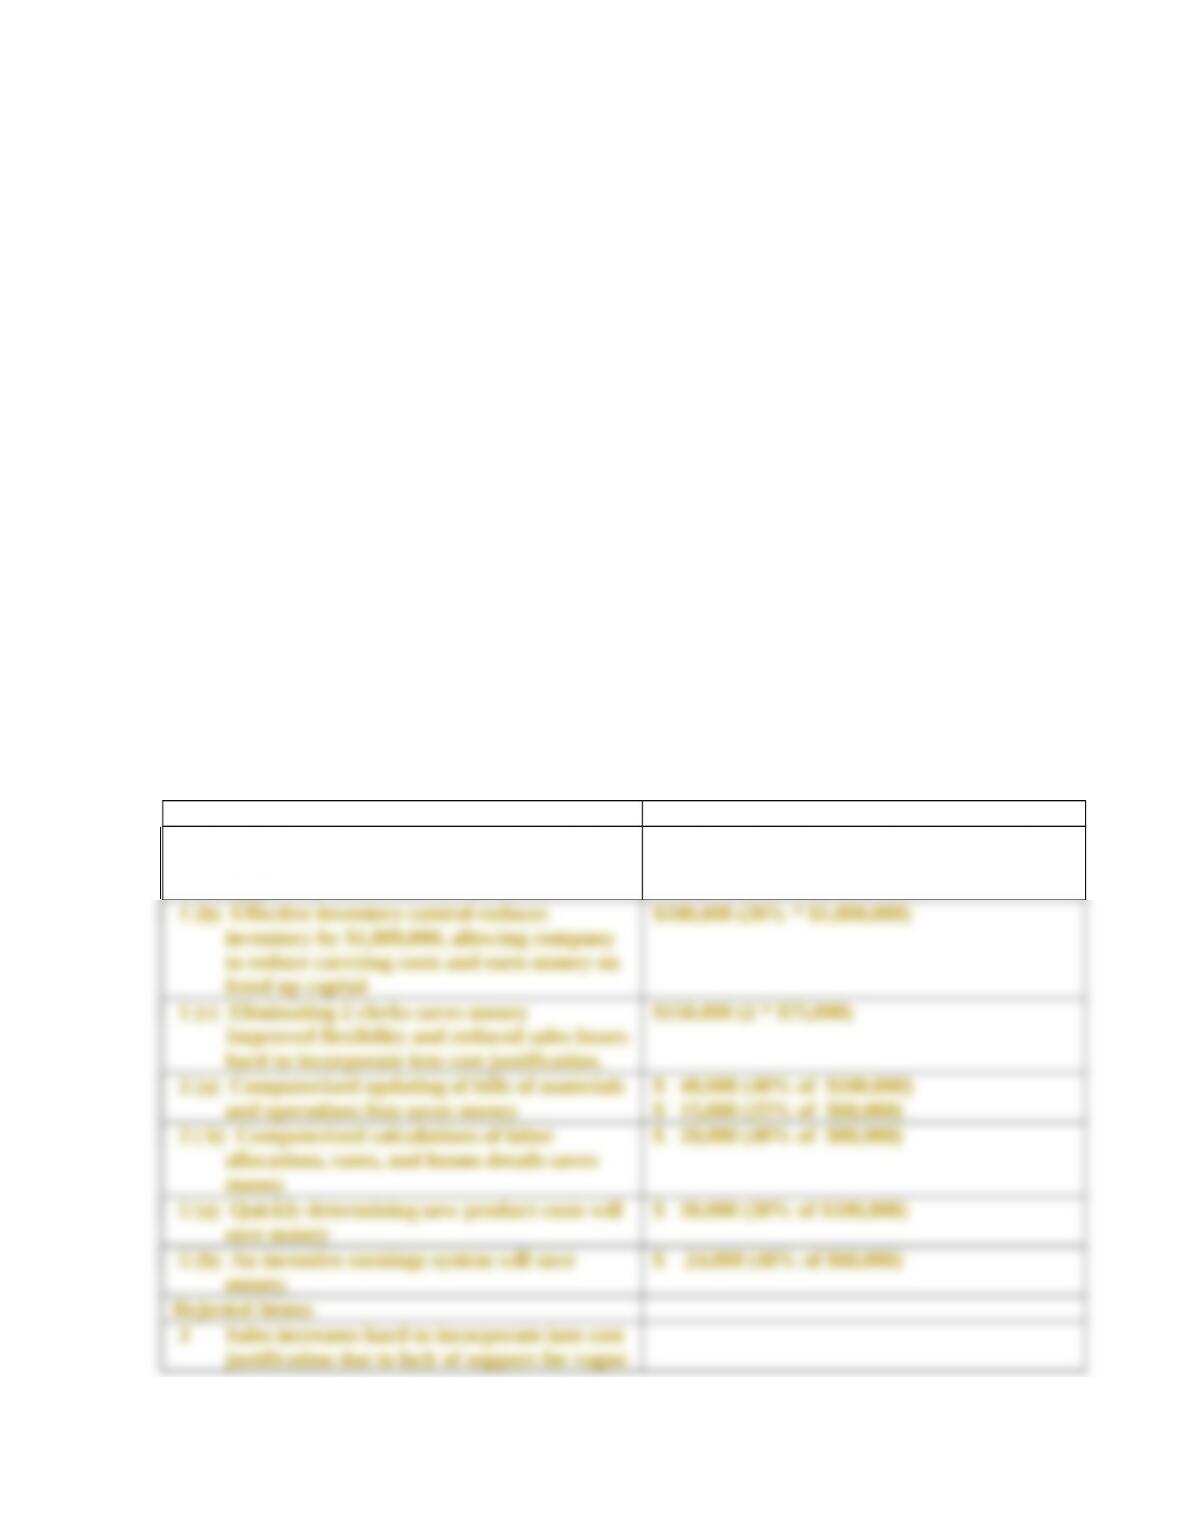
As a board member, which of the benefits can you defend as relevant to the system’s cost
justification? Calculate how much XYZ will save with the new system.
Adapted from the SMAC Exam
Acceptable Items: Cost Savings
1 (a) More accurate market forecasts with
software making the calculations reduces
costs
$ 9,600 ($400/day * 2 days/month * 12
months
estimates.
20.7 The following list presents specific project activities and their scheduled starting and completion
times:
Activity Starting Date Ending Date
A Jan. 5 Feb. 9
B Jan. 5 Jan. 19
C Jan. 26 Feb. 23
D Mar. 2 Mar. 23
E Mar. 2 Mar. 16
F Feb. 2 Mar. 16
G Mar. 30 Apr. 20
H Mar. 23 Apr. 27
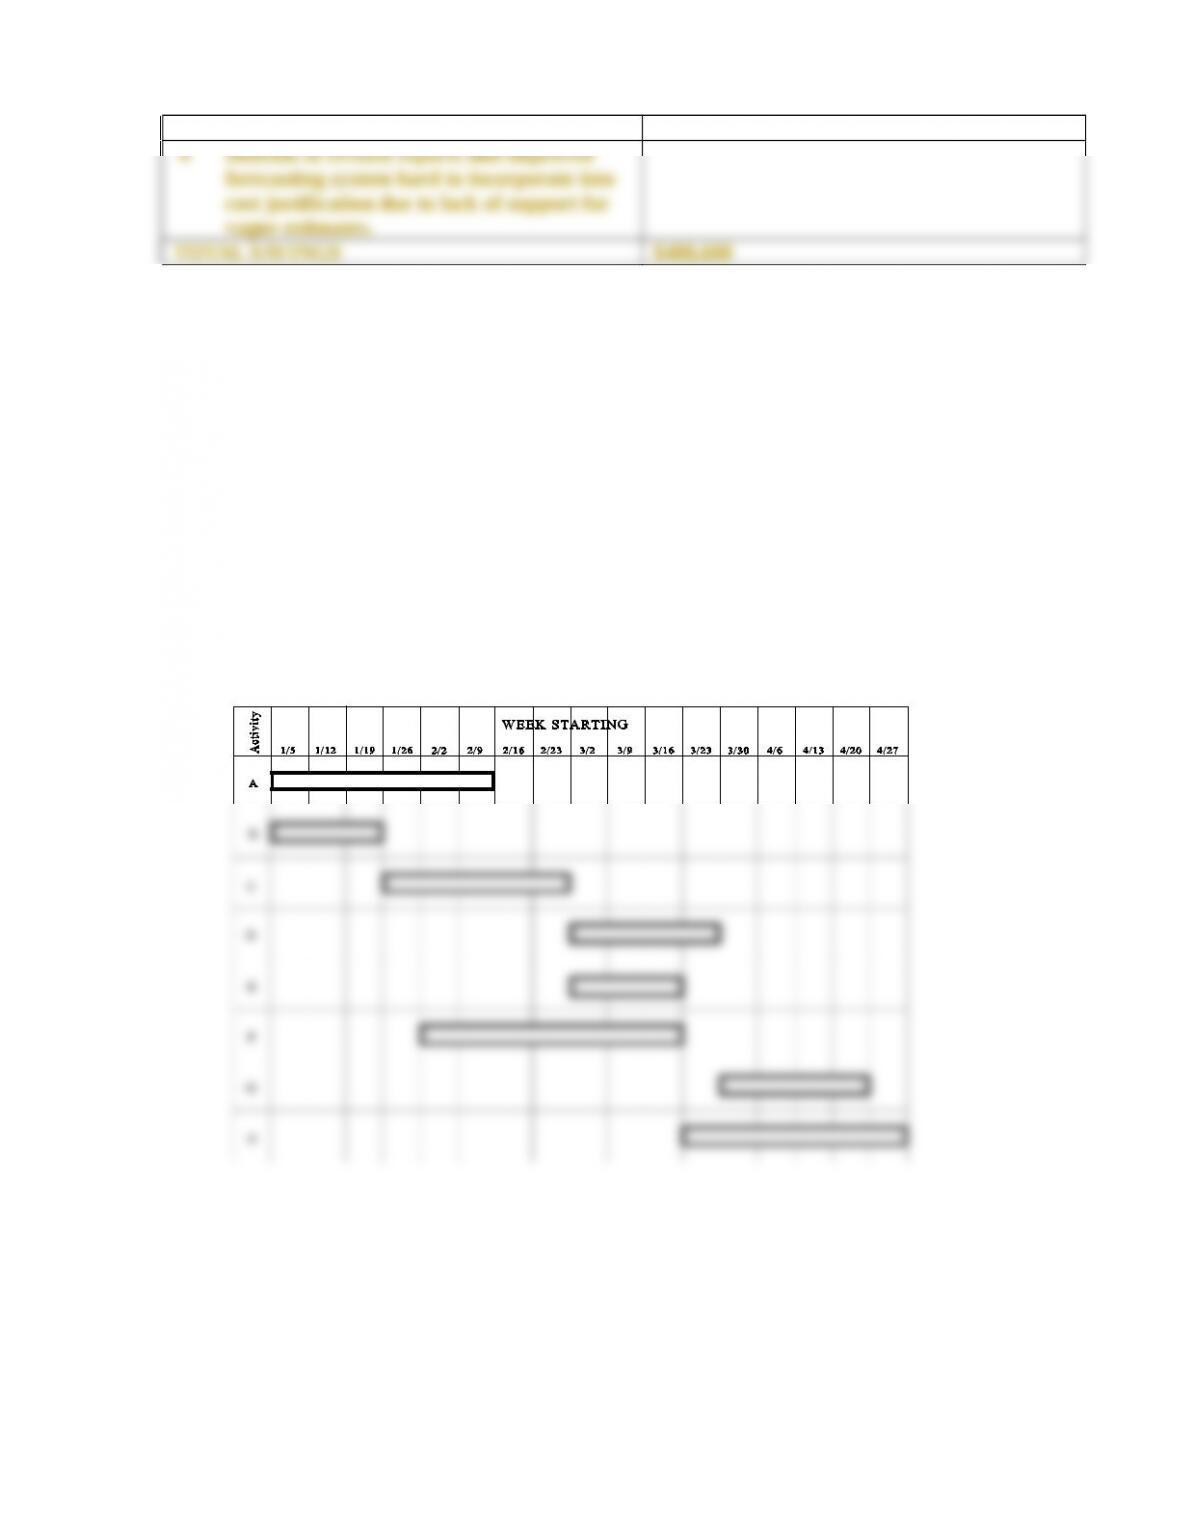
a. Using a format similar to that in Figure 18-3, prepare a Gantt chart for this project. Assume
that each activity starts on a Monday and ends on a Friday.
Project Planning Chart
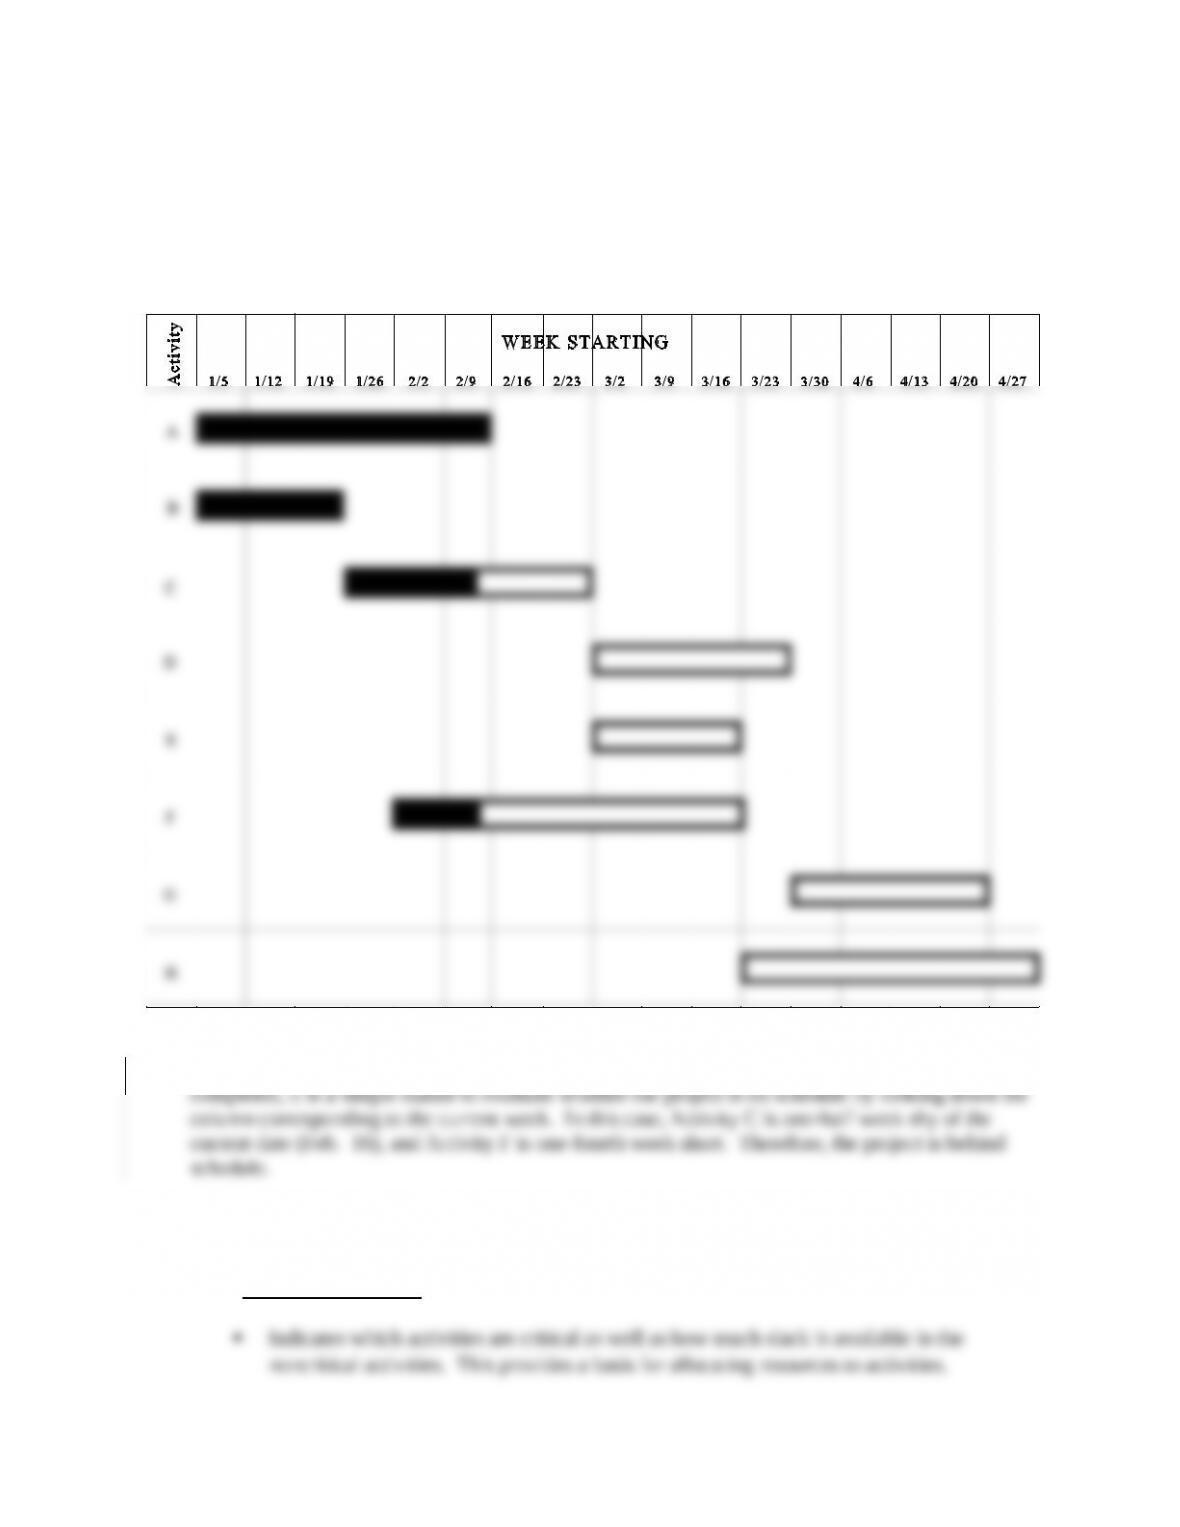
b. Assume today is February 16 and activities A and B have been completed, C is half
completed, F is a quarter completed, and the other activities have not yet commenced.
Record this information on your Gantt chart. Is the project behind schedule, on
schedule, or ahead of schedule? Explain.
Partially Completed Gantt chart
Once the activity bars have been filled in to reflect the activities that have been fully or partially
c. Discuss the relative merits of the Gantt chart and PERT as project planning and
control tools.
Advantages of PERT:
Advantages of GANTT Charts:
It is easier to prepare than a PERT chart.