16.9 Excel Problem Objective: Create pivot tables for what-if analysis
Read the article “Make Excel an Instant Know-It-All” by Roberta Ann Jones in the
March 2004 issue of the Journal of Accountancy. (Available at www.aicpa.org)
a. Follow the instructions in the article to create a spreadsheet with pivot tables.
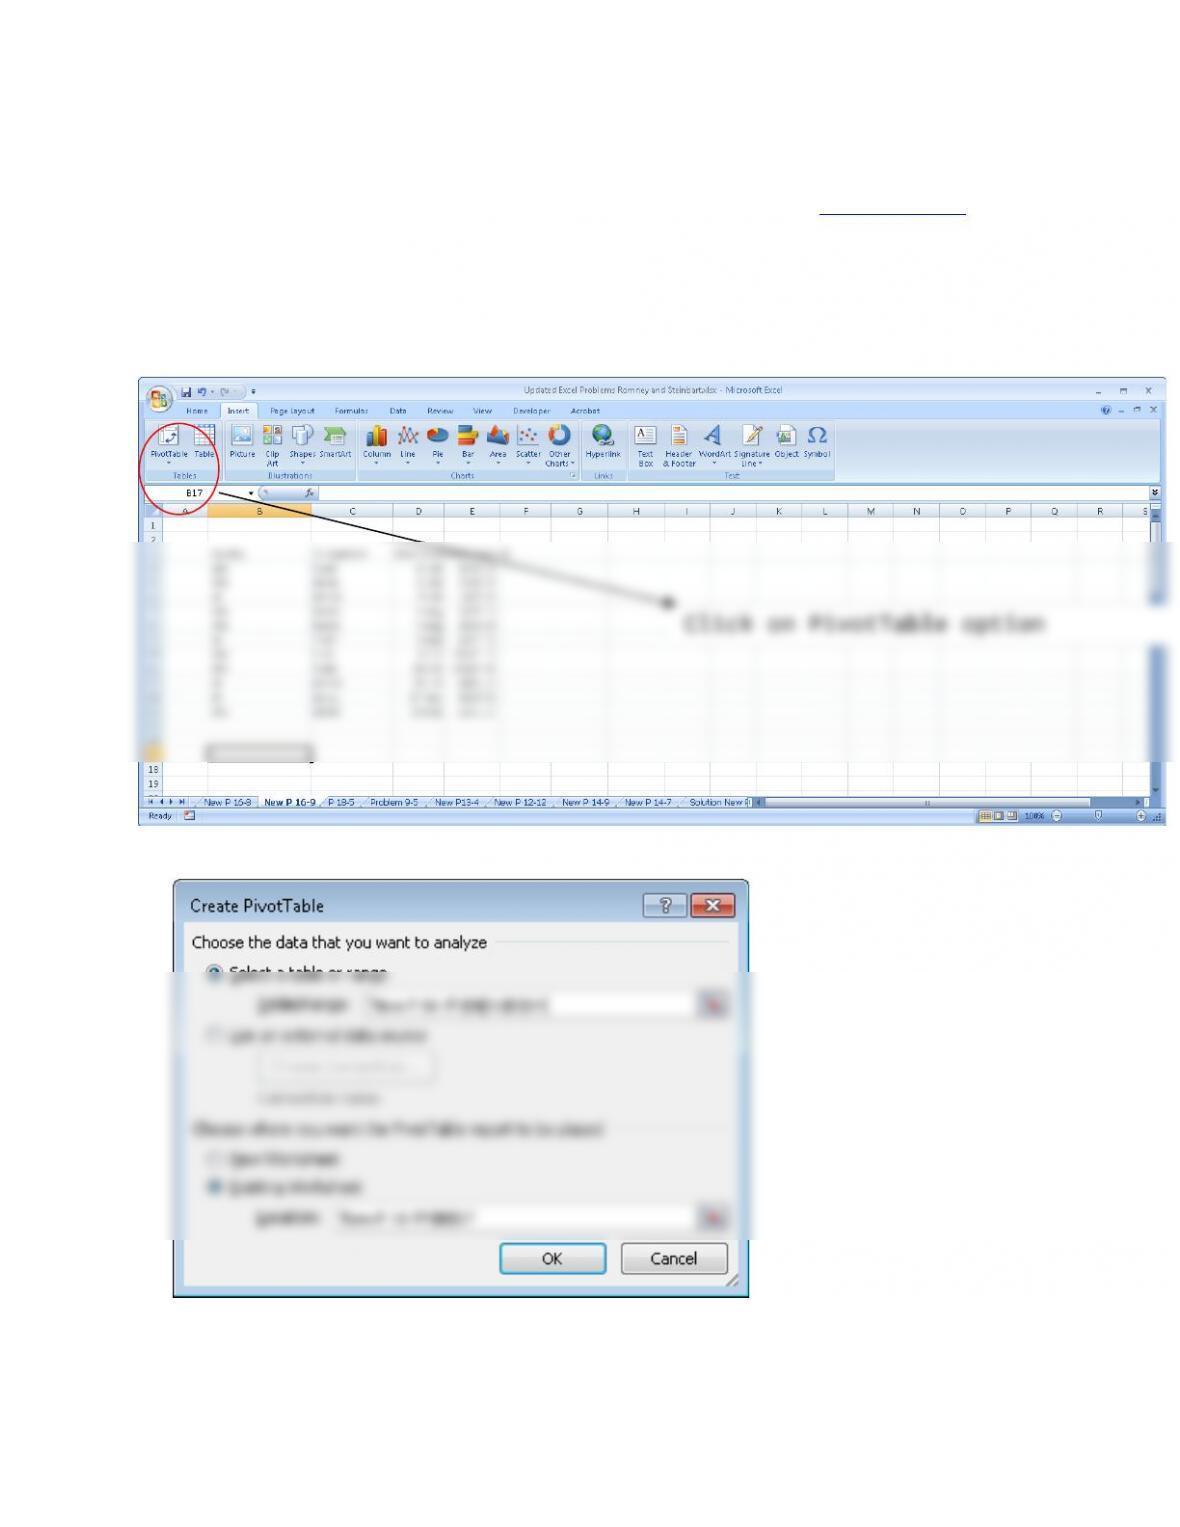
First, create the spreadsheet. Then, to create the Pivot Table, position your cursor in a cell
where you want the Pivot Table to appear. Then click on the Insert Tab, and then click on
the Pivot Table choice.
Next, highlight the cells containing the data as shown:
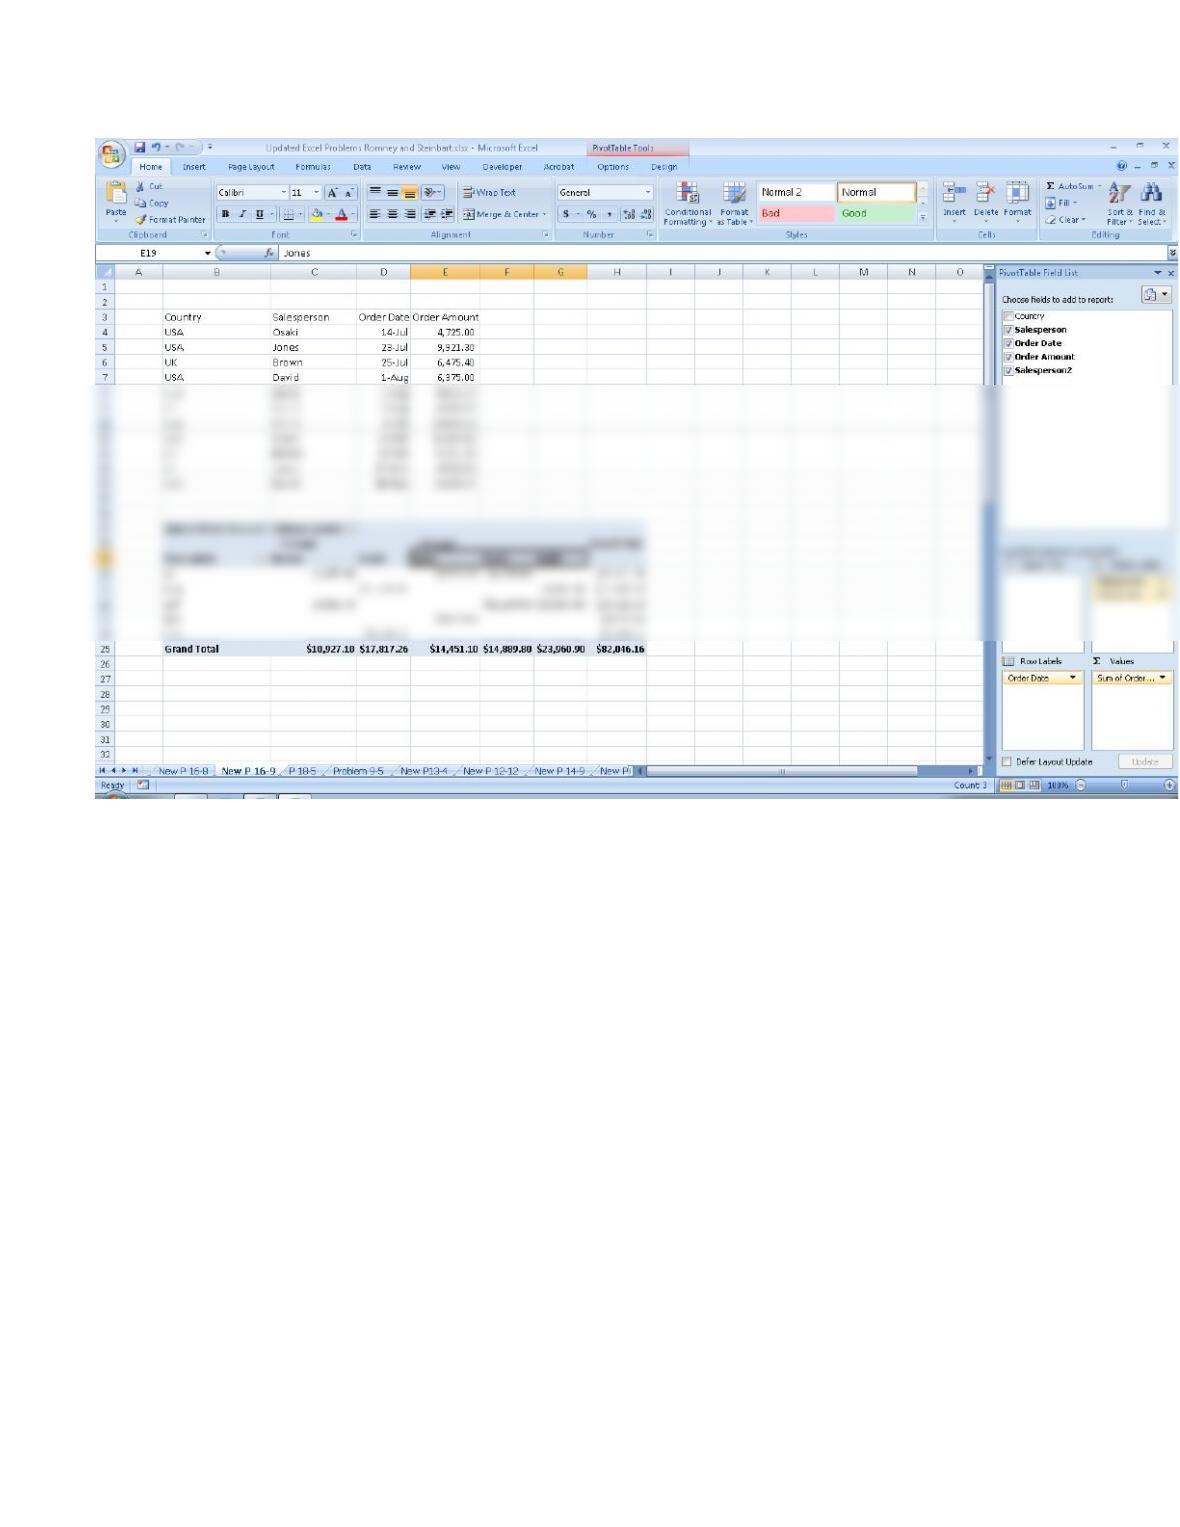
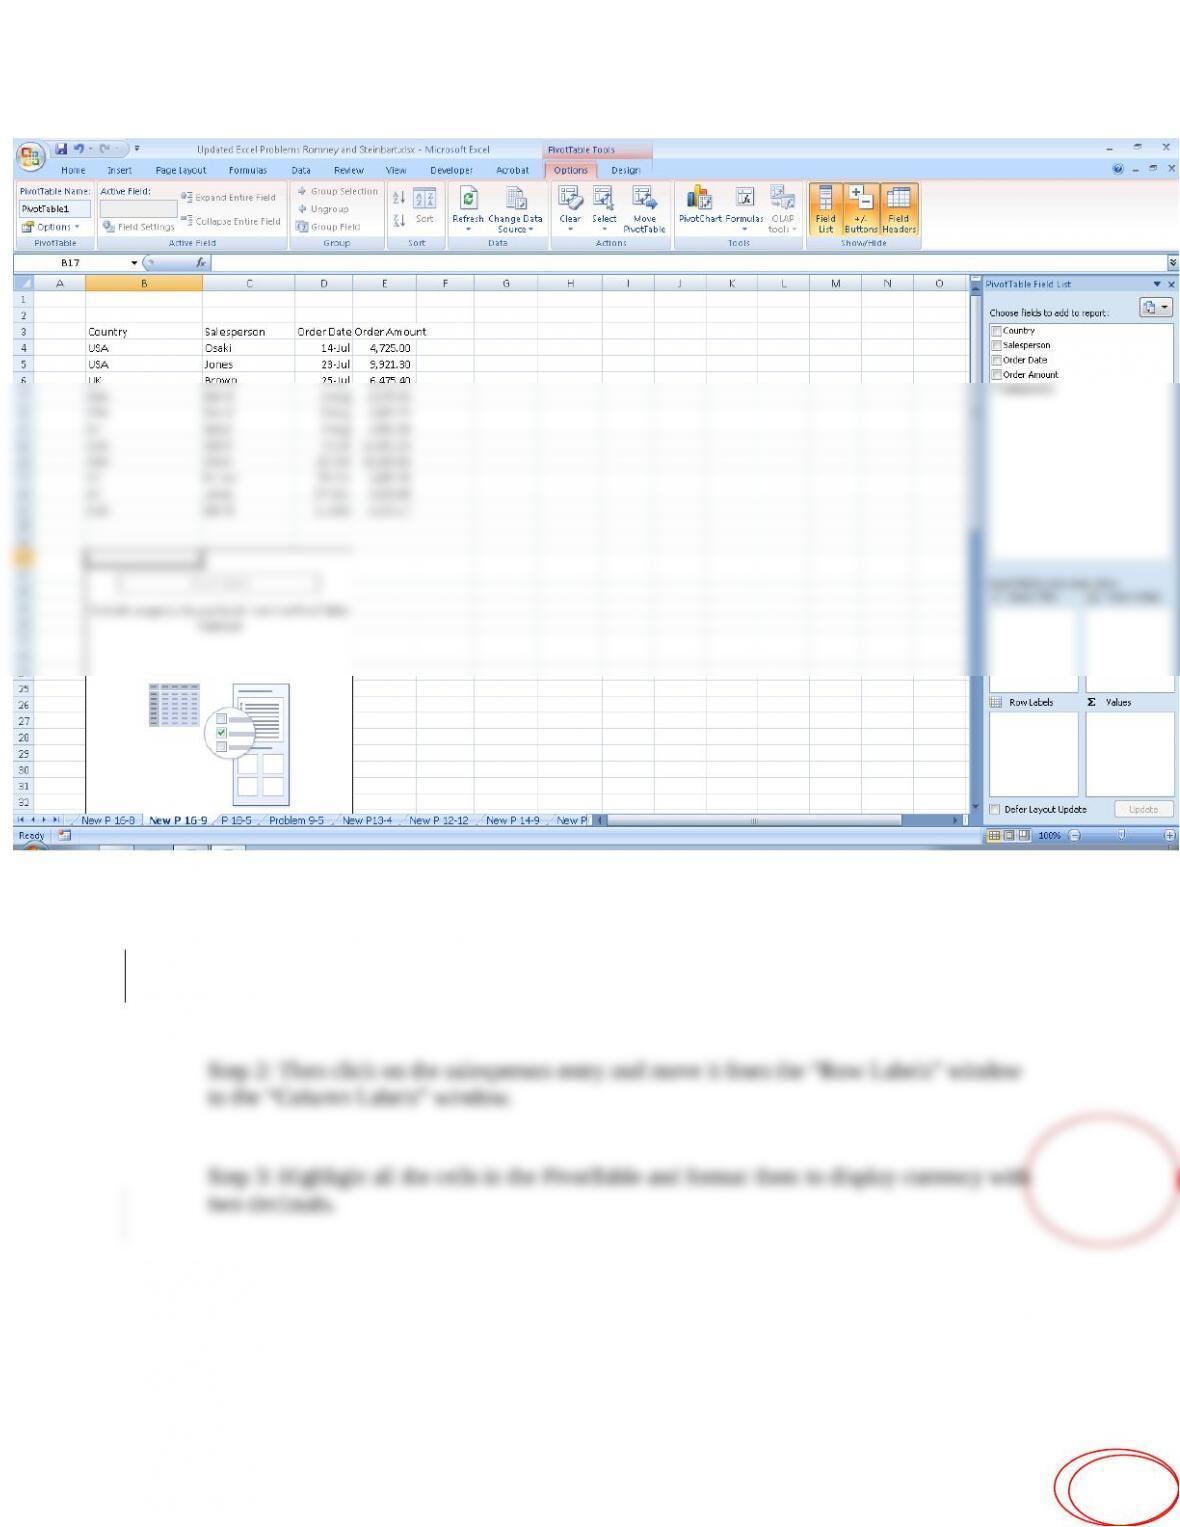
Clicking OK yields the following blank skeleton outline of a PivotTable which we will
use in parts b and c to create PivotTables:
b. Print out a report that shows sales by month for each salesperson.
Step1: select the salesperson, order date, and order amount fields in the window in the
upper right corner that says “Choose Fields to add to Report.”
c. Assume that Brown and David are in sales group 1 and the other three

salespeople are in sales group 2. Print out a report that shows monthly sales for
each group.
Step 1: To separate the sales people into groups, click on the sales person row in the Pivot Table and
highlight Brown and David.