
CHAPTER 16
GENERAL LEDGER AND REPORTING SYSTEM
SUGGESTED ANSWERS TO DISCUSSION QUESTIONS
16.1 Although XBRL facilitates the electronic exchange of financial information, some
external users do not think it goes far enough. They would like access to the entire
general ledger, not just to XBRL-tagged financial reports that summarize general
ledger accounts. Should companies provide external users with such access? Why or
why not?
16.2 How can responsibility accounting and flexible budgets improve morale?
16.3 Why is the audit trail an important control?
16.4 The balanced scorecard measures organizational performance along four
dimensions. Is it possible that measures on the customer, internal operations, and
innovation and learning dimensions could be improving without any positive change
in the financial dimension? If so, what are the implications of such a pattern?
16.5 Do you think that mandatory standards should be developed for the design of
graphs of financial data that are included in annual reports and other periodic
communications to investors? Why or why not?
SUGGESTED ANSWERS TO THE PROBLEMS
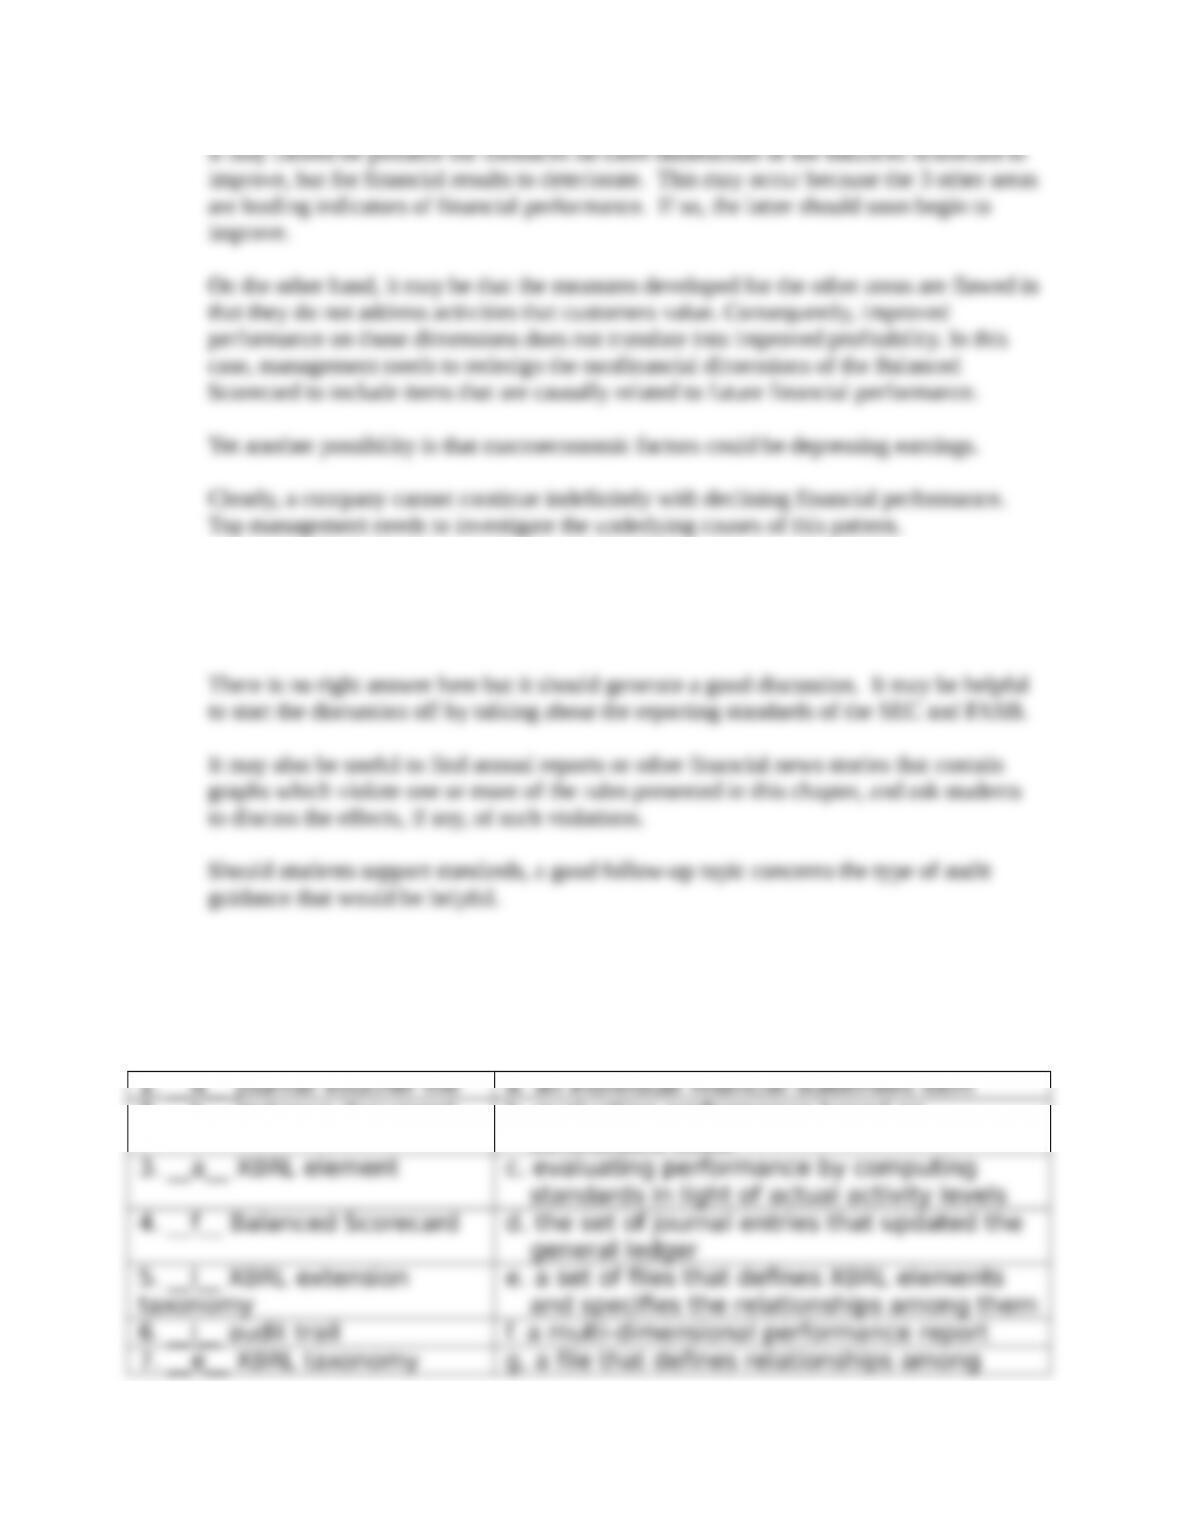
16.1 Match the term in the left column with its appropriate
definition from the right column:
2. __k__ instance document b. evaluating performance based on
controllable costs
XBRL elements
8. __g__ XBRL linkbase h. a file that defines the attributes of XBRL
elements
9. __h__ XBRL schema i. a detective control that can be used to
11. __b__ responsibility
k. a file that contains specific data values for
12. __c__ -exible budget l. a file containing a set of customized tags
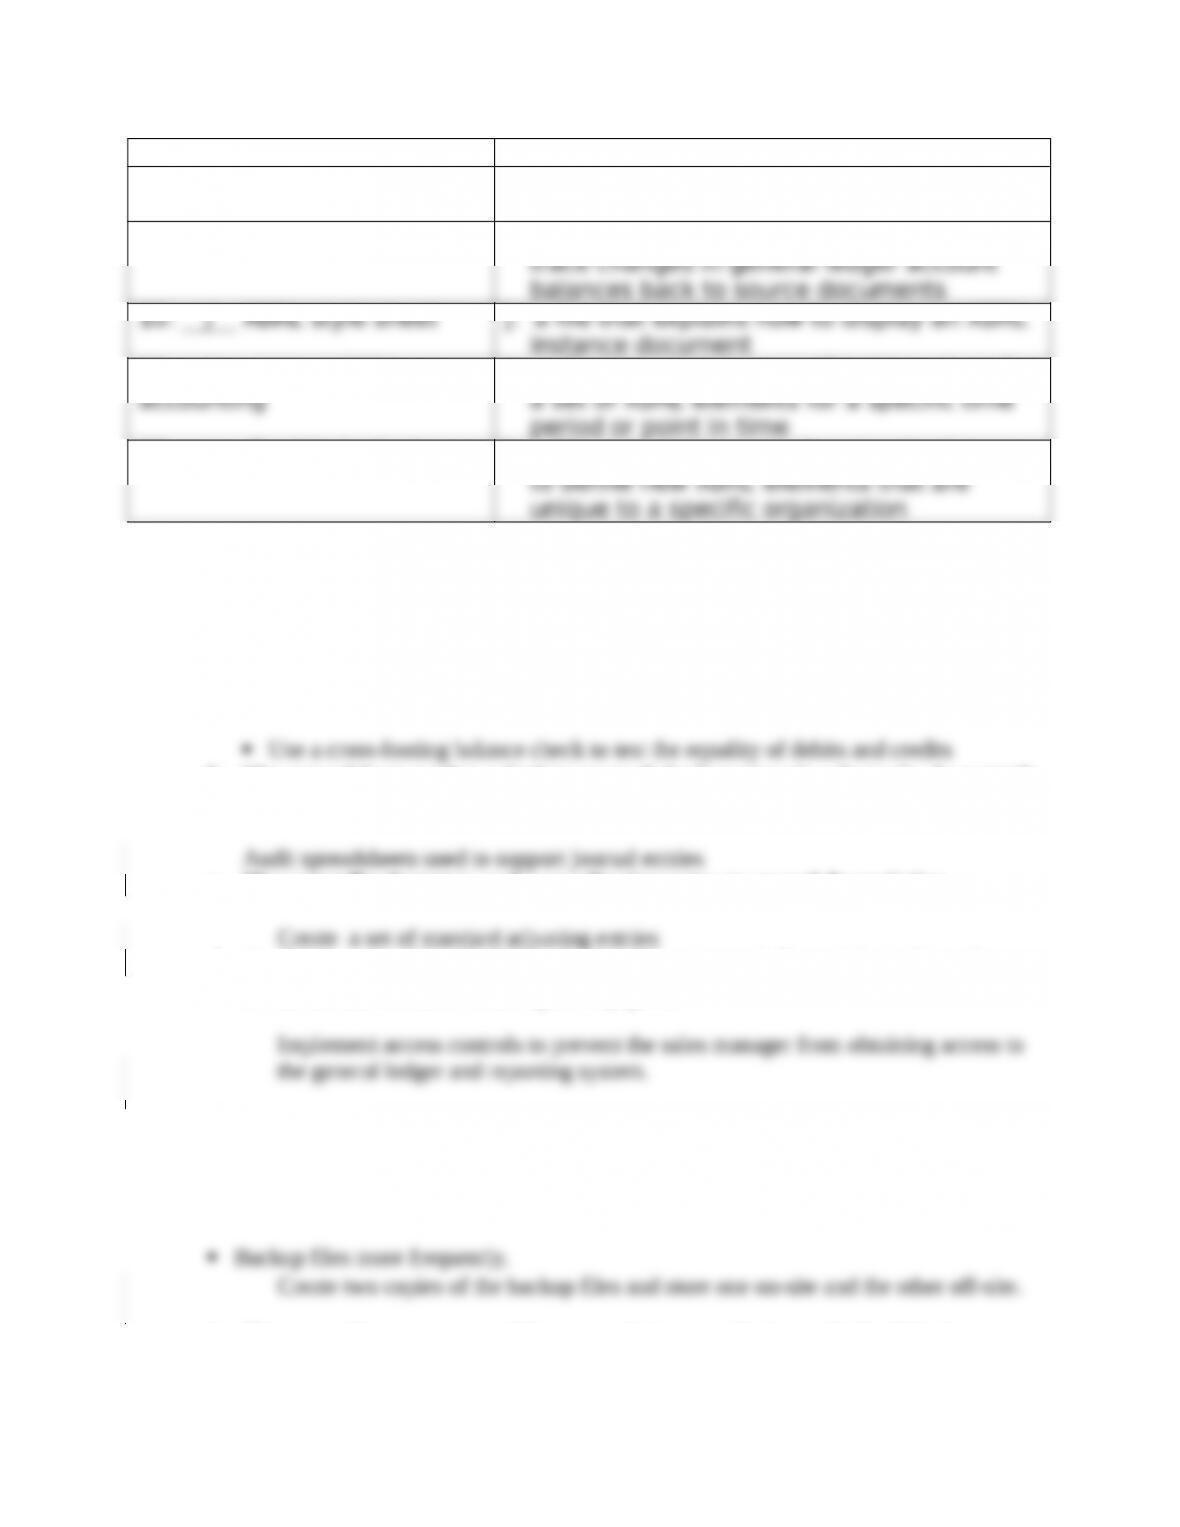
16.2 Which control procedure would be most effective in addressing the following
problems?
a. When entering a journal entry to record issuance of new debt, the treasurer
inadvertently transposes two digits in the debit amount.
b. The spreadsheet used to calculate accruals had an error in a formula. As a result,
the controller’s adjusting entry was for the wrong amount.
c. The controller forgot to make an adjusting entry to record depreciation.
d. A sales manager tipped off friends that the company’s financial results, to be
released tomorrow, were unexpectedly good.
e. The general ledger master file is stored on disk. For some reason, the disk is no
longer readable. It takes the accounting department a week to reenter the past
month’s transactions from source documents in order to create a new general
ledger master file.
f. The controller sent a spreadsheet containing a preliminary draft of the income
statement to the CFO by e-mail. An investor intercepted the e-mail and used the
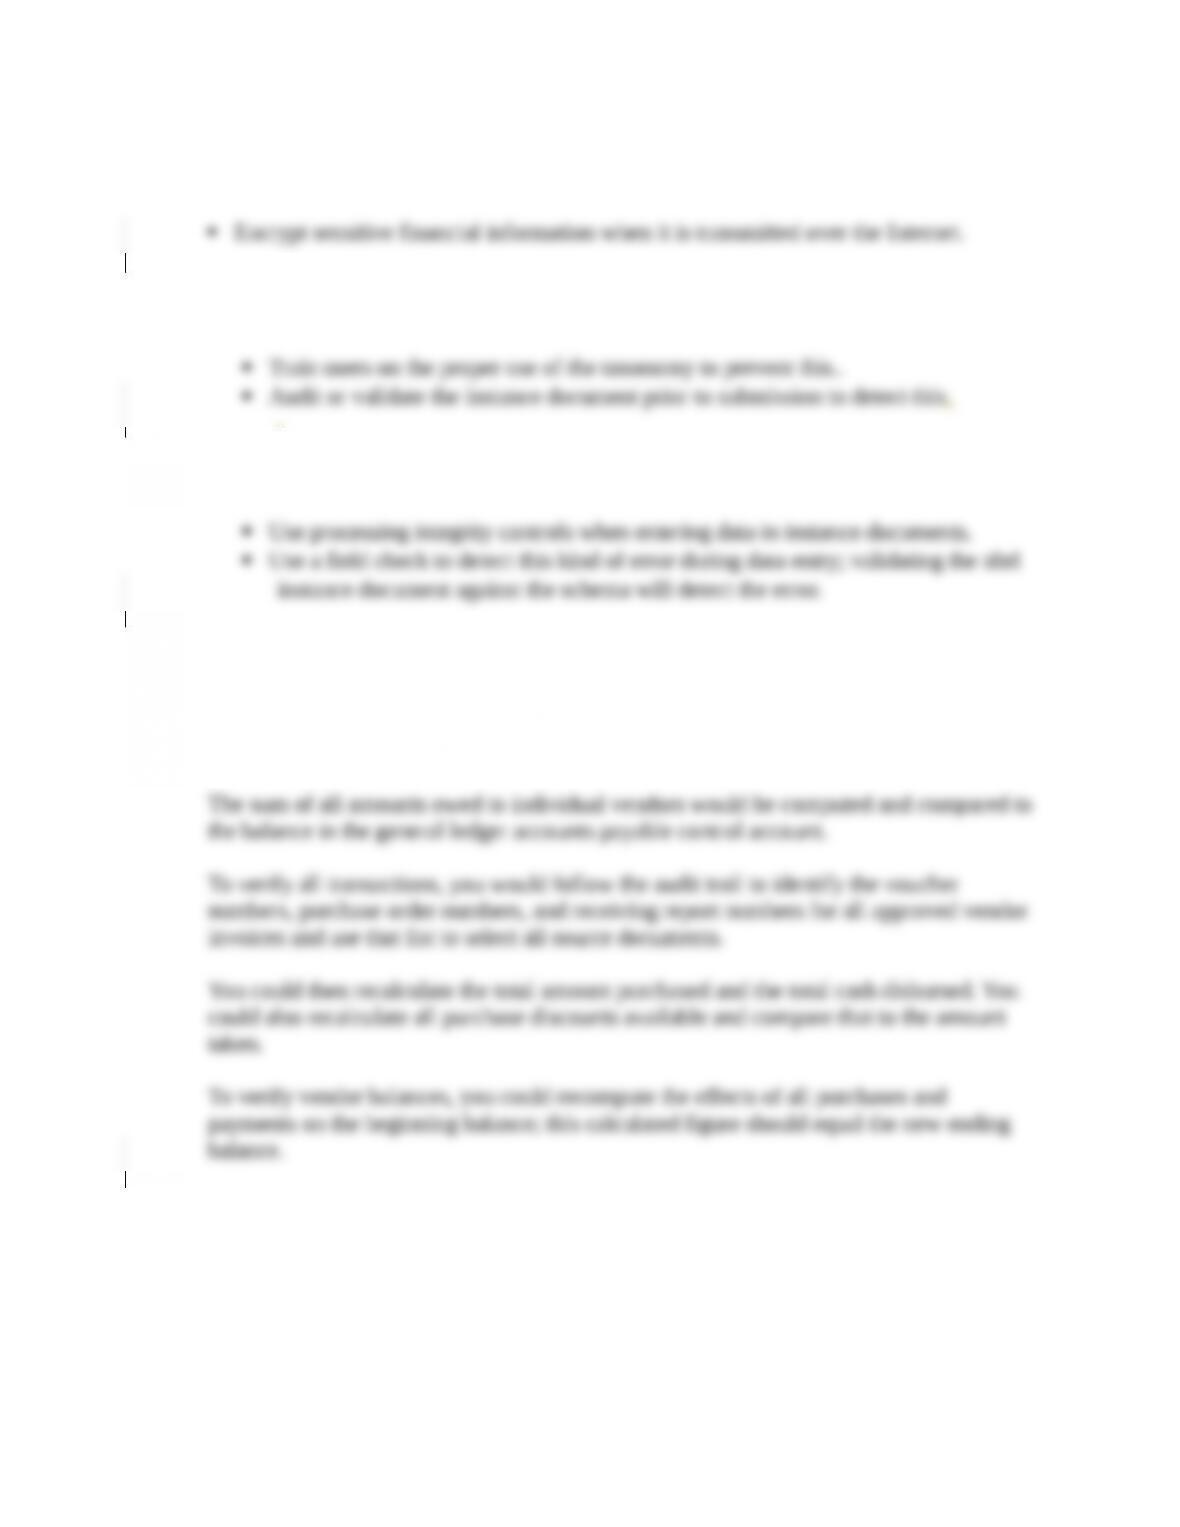
information to sell his stock in the company before news of the disappointing
results became public.
g. A company’s XBRL business report was incorrect because the controller selected
the wrong element from the taxonomy.
.
h. Instead of a zero, the letter o was entered when typing in data values in an XBRL
instance document.
16.3 Explain the components of an audit trail for verifying changes
to accounts payable. Your answer should specify how those
components can be used to verify the accuracy, completeness,
and validity of all purchases, purchase returns, purchase
discounts, debit memos, and cash disbursements.
16.4 As manager of a local pizza parlor, you want to develop a balanced scorecard so you
can more effectively monitor the restaurant’s performance.
a. Propose at least two goals for each dimension, and explain why those goals are
important to the overall success of the pizza parlor. One goal should be purely
performance-oriented and the other should be risk-related.
b. Suggest specific measures for each goal developed in part a.
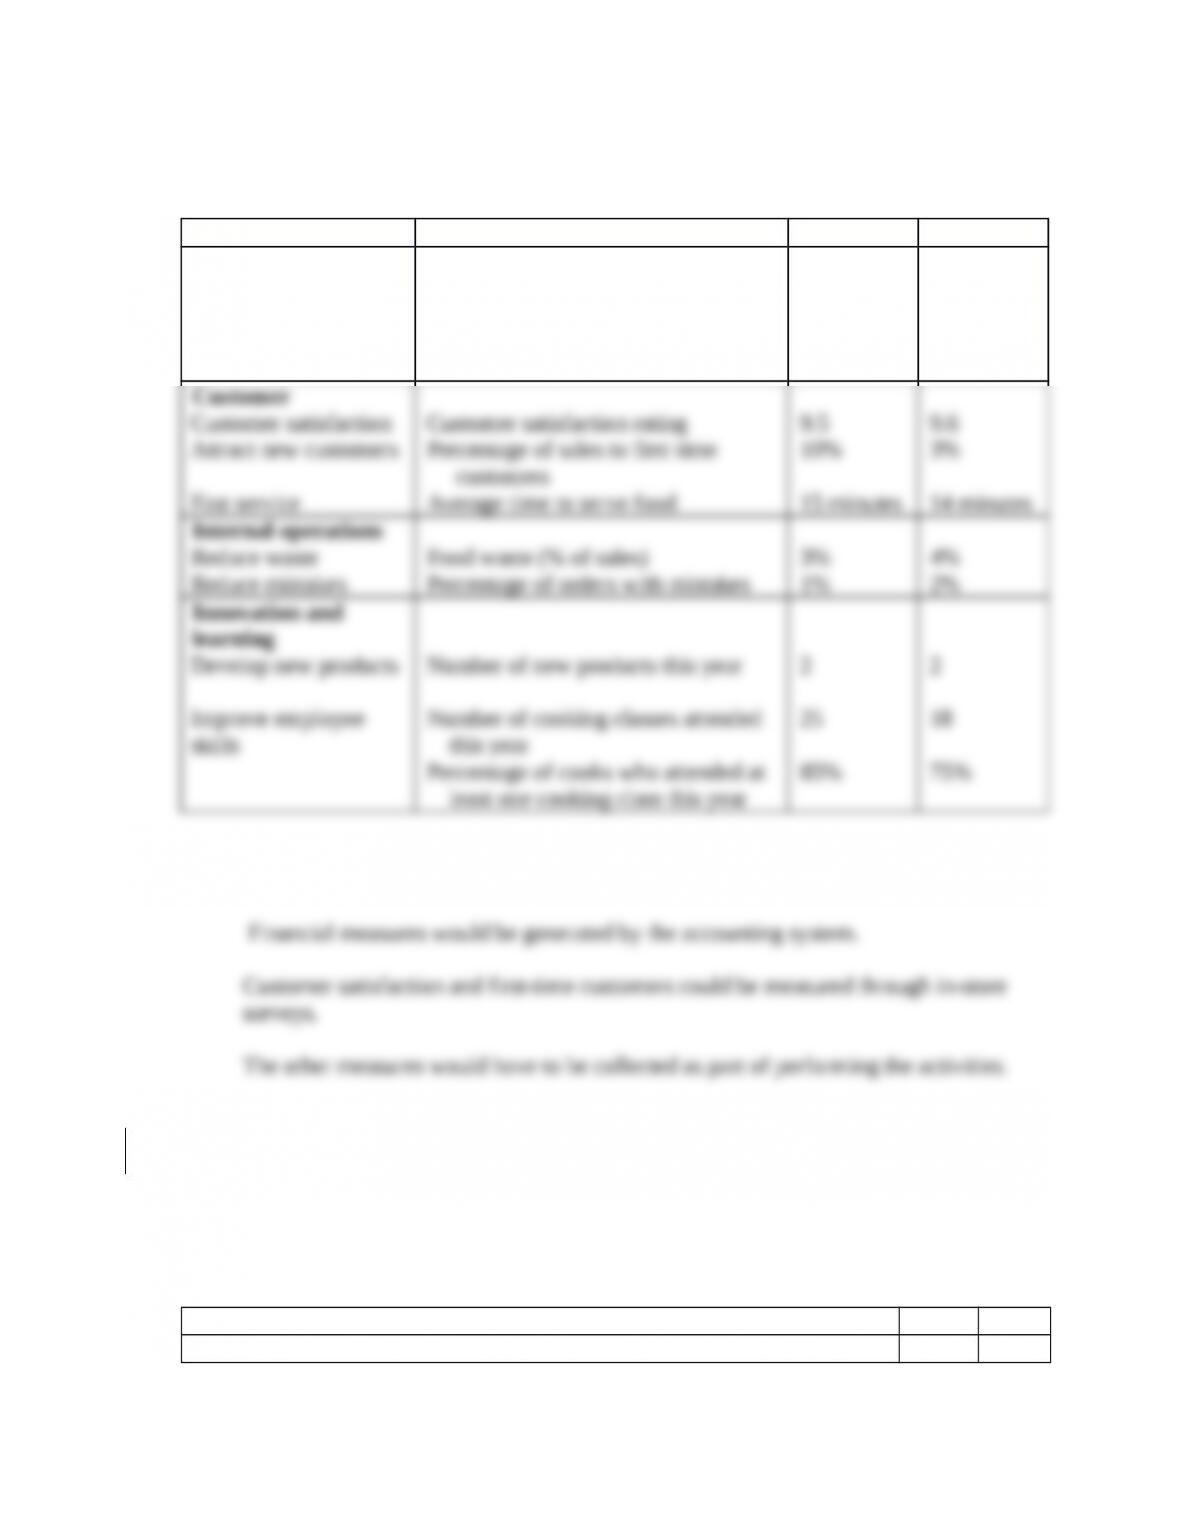
Below is a sample of a balanced scorecard containing goals and measures.
Dimension Goals Measure Target Actual
Financial
Increase sales
Profitability
Percentage change in sales
Operating margin
5%
12%
4%
13.5%
least one cooking class this year
c. Explain how to gather the data needed for each measure developed in part b.
16.5 Use Table 16-1 to create a questionnaire checklist that can be used to evaluate
controls in the general ledger and reporting cycle.
a. For each control issue, write a Yes/No question such that a “No” answer
represents a control weakness. For example, one question might be “Is access to
the general ledger restricted?”
A wide variety of questions is possible. Below is a sample list:
Question Yes No
1. Is access to the general ledger restricted?
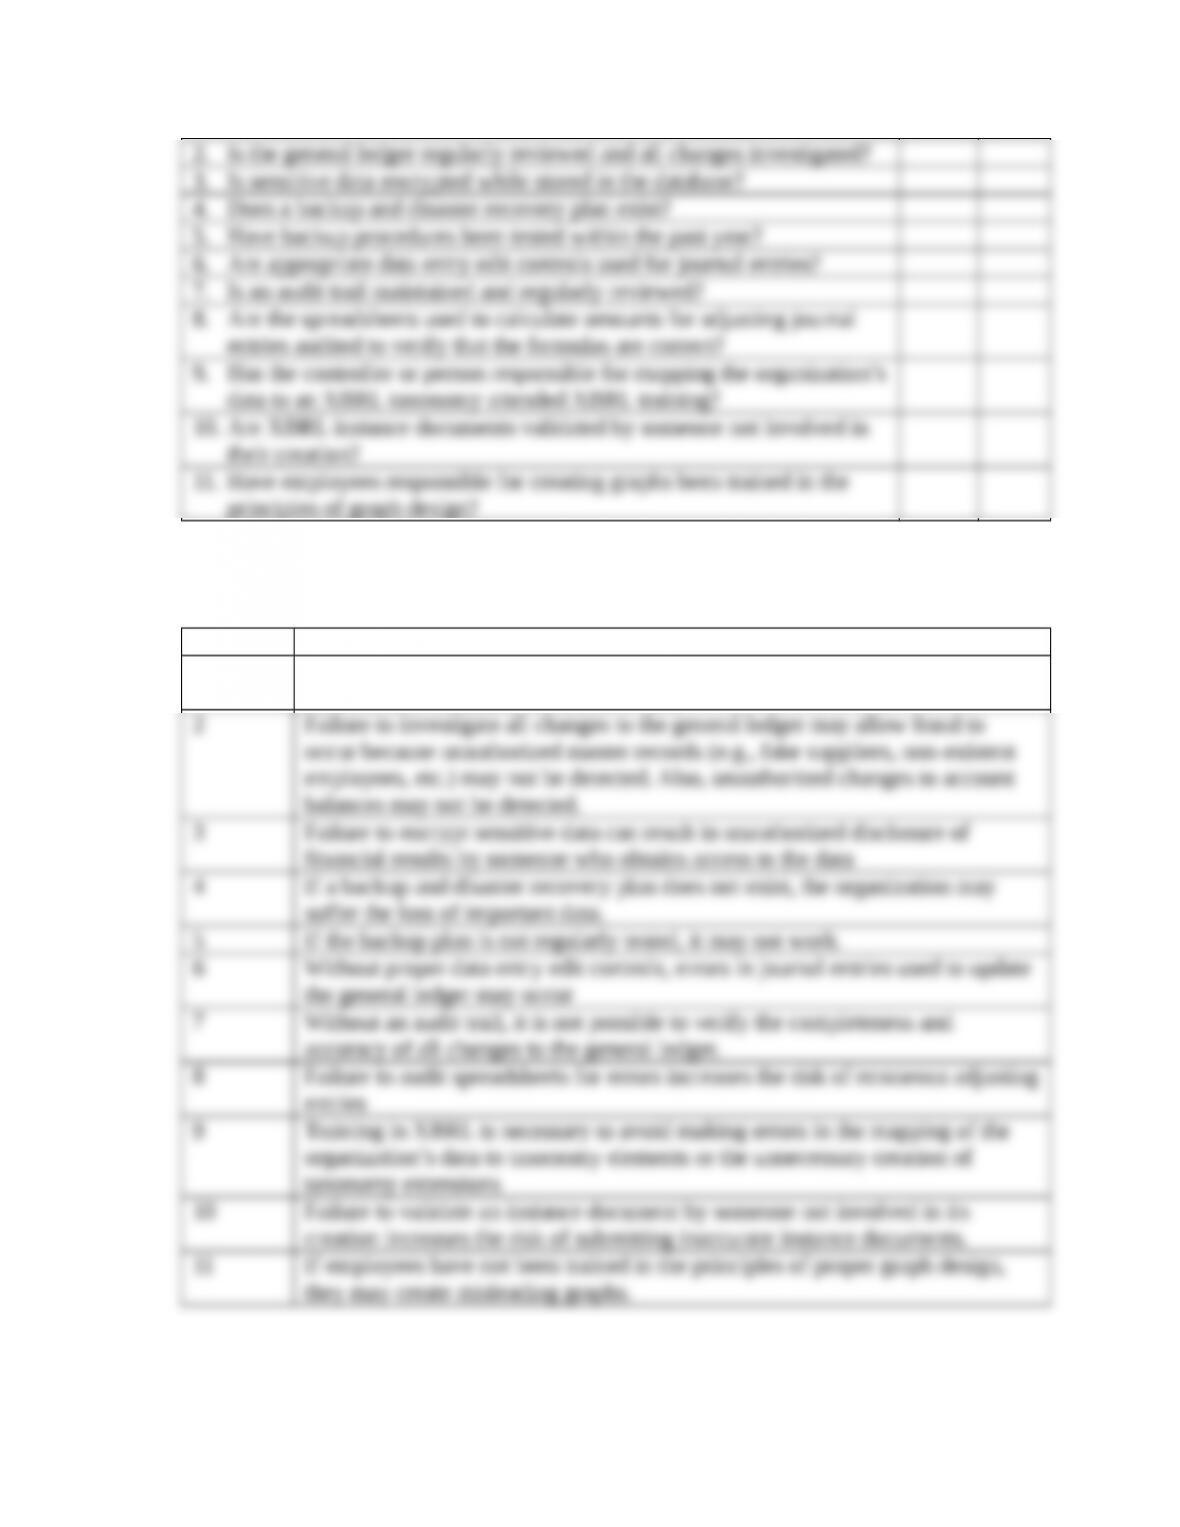
b. For each Yes/No question, write a brief explanation of why a “No” answer
represents a control weakness.
Question Reason a “No” answer represents a weakness
1 Unrestricted access to the general ledger could facilitate fraud or the
unauthorized disclosure of sensitive data
16.6 Excel Problem
Objective: Enhancing Tabular Displays in Excel
Required:
1. Select the set of rows you want to conditionally format to alternately be normal or
shaded.
3. Click the plus button to add a new rule.
5. Change the next field to “use a formula to determine which cells to format.”
7. Change the “format with” field to “custom format.”
9. Click OK to close the “format cells” window you used to select the gray fill.
11. Click OK to close the “manage rules” window.
16.7 Obtain the annual report of a company assigned by your professor. Read the
management discussion and analysis section, and develop a balanced scorecard that
reflects that company’s vision, mission, and strategy. Create both
performance-oriented and risk-based goals and measures for each section of the
balanced scorecard.
The key to this assignment is the appropriateness of the goals and measures developed for
the Balanced Scorecard in light of management’s discussion about the mission, vision,
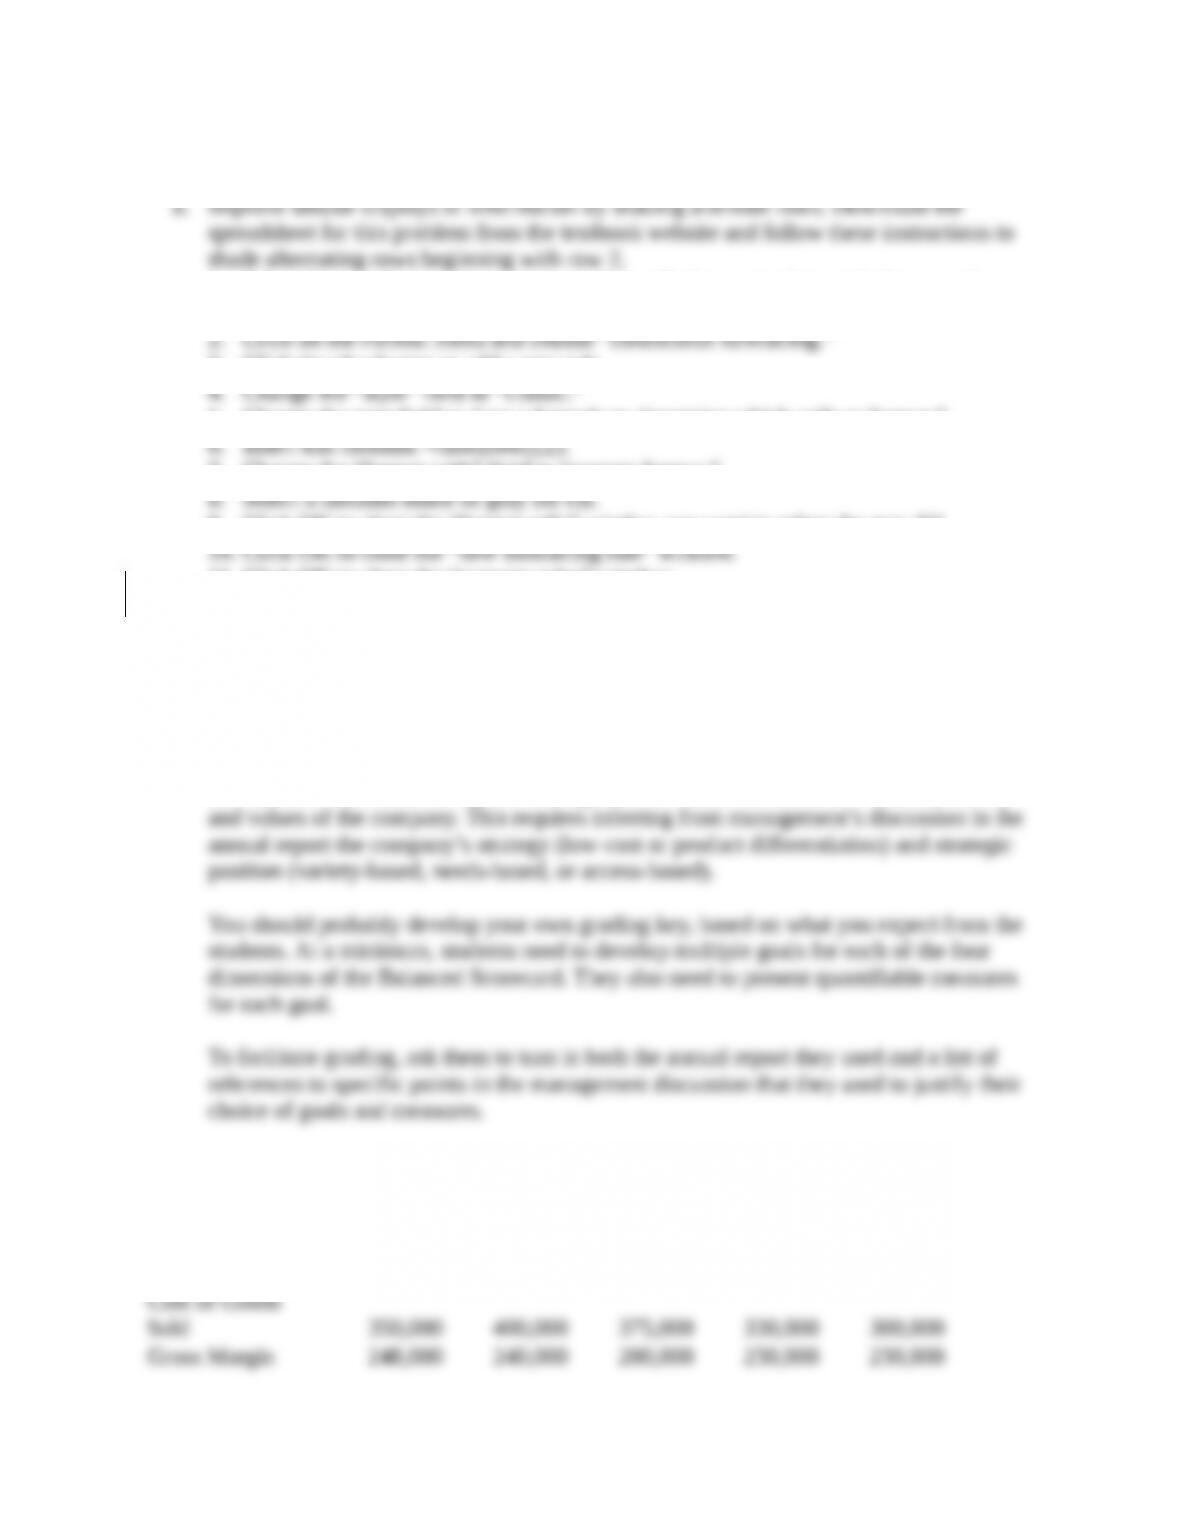
16.8 Excel Problem Objective: Practice graph design principles.
Use the data in Table 16-3 to create the following graphs:
2014 2013 2012 2011 2010
Sales 598,000 640,000 575,000 560,000 530,000
a. Sales
20142013201220112010
598,000
640,000
575,000
560,000
530,000
Sales
b. Sales and Gross Margin
598,000
640,000
575,000
560,000
530,000
248,000
240,000
200,000
230,000230,000
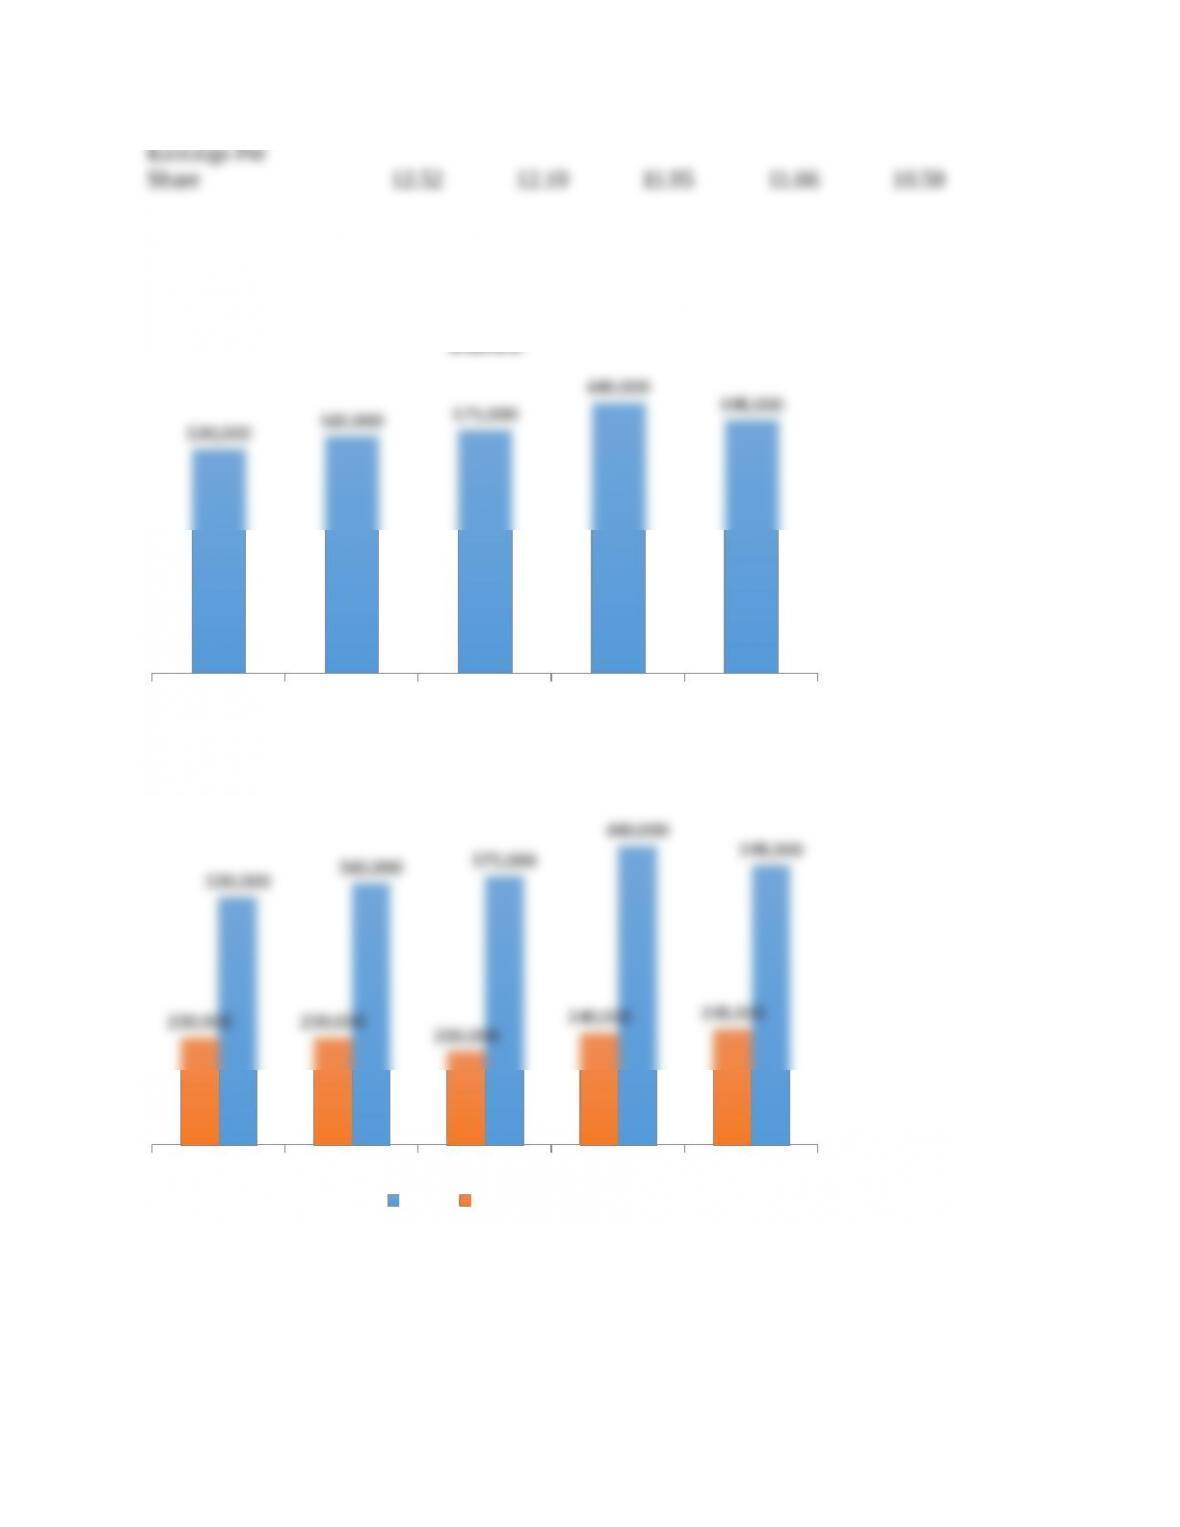
20142013201220112010
12.52
12.10
11.95
11.66
10.50
Earnings Per Share
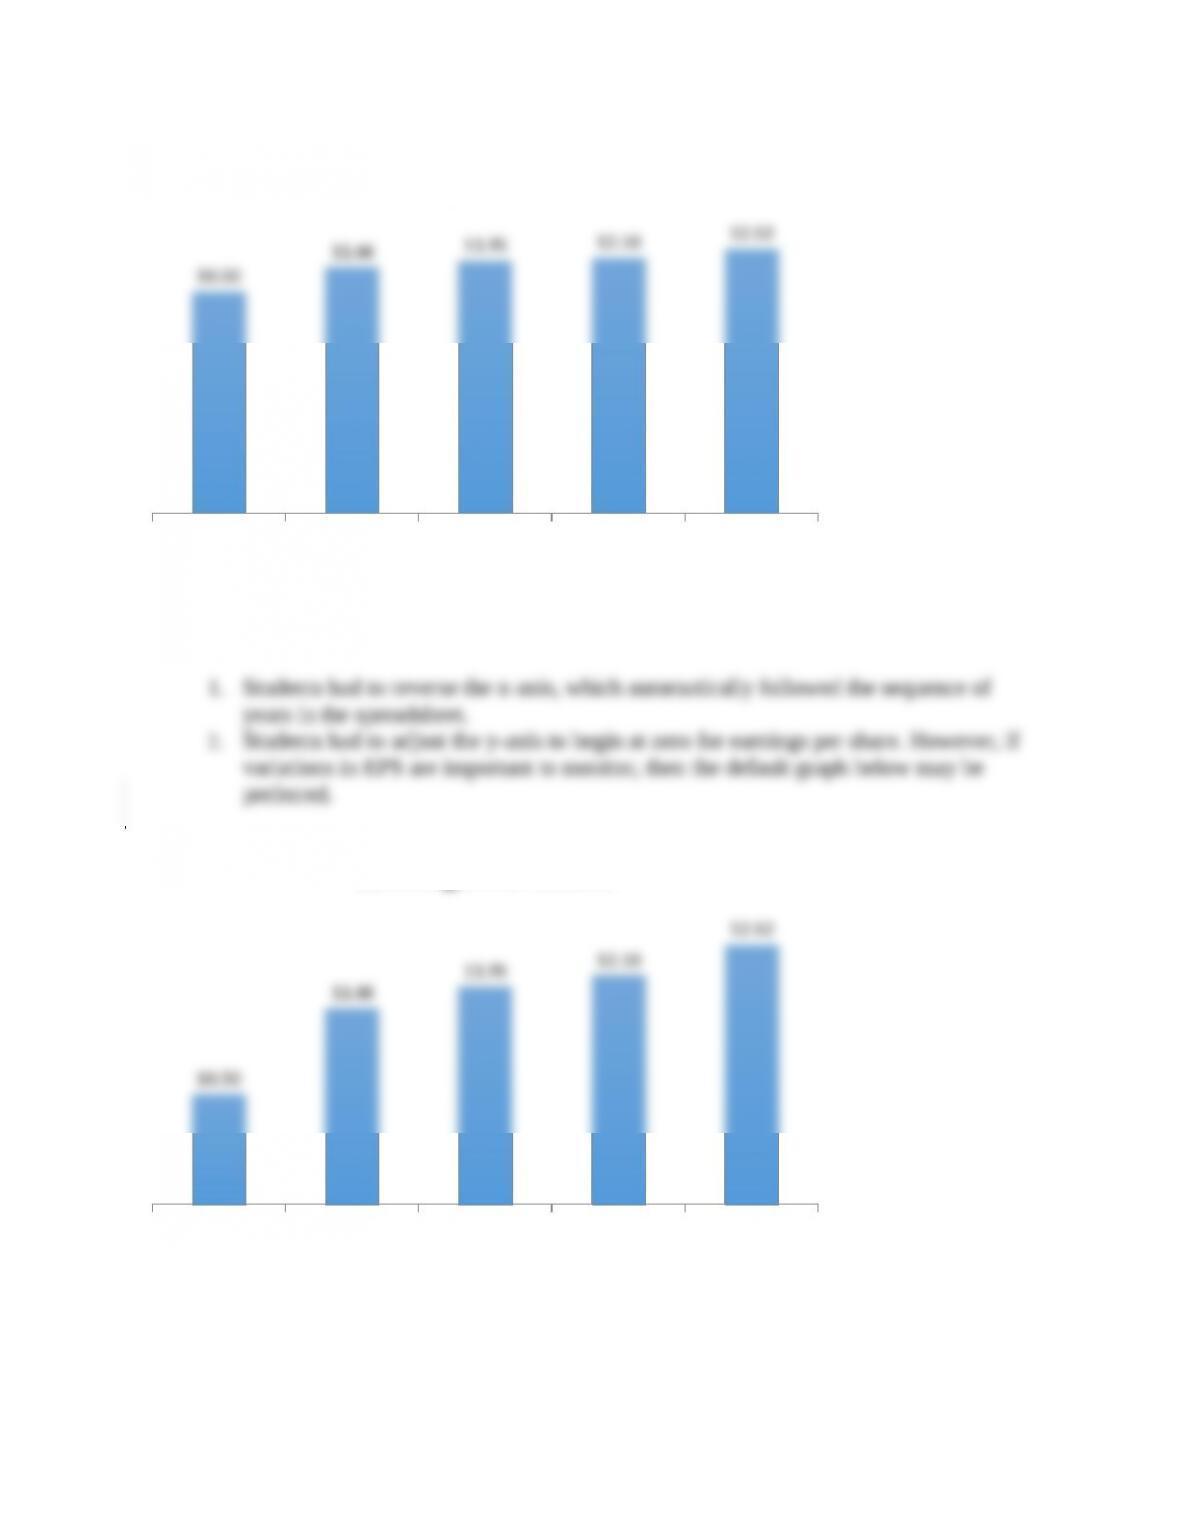
d. Which principles of graph design, if any, did you have to manually implement to
over-ride the default graphs created by Excel?
20142013201220112010
12.52
12.10
11.95
11.66
10.50
Earnings Per Share