Chapter 9 The Master Budget
(25−30 min.) E9-31A
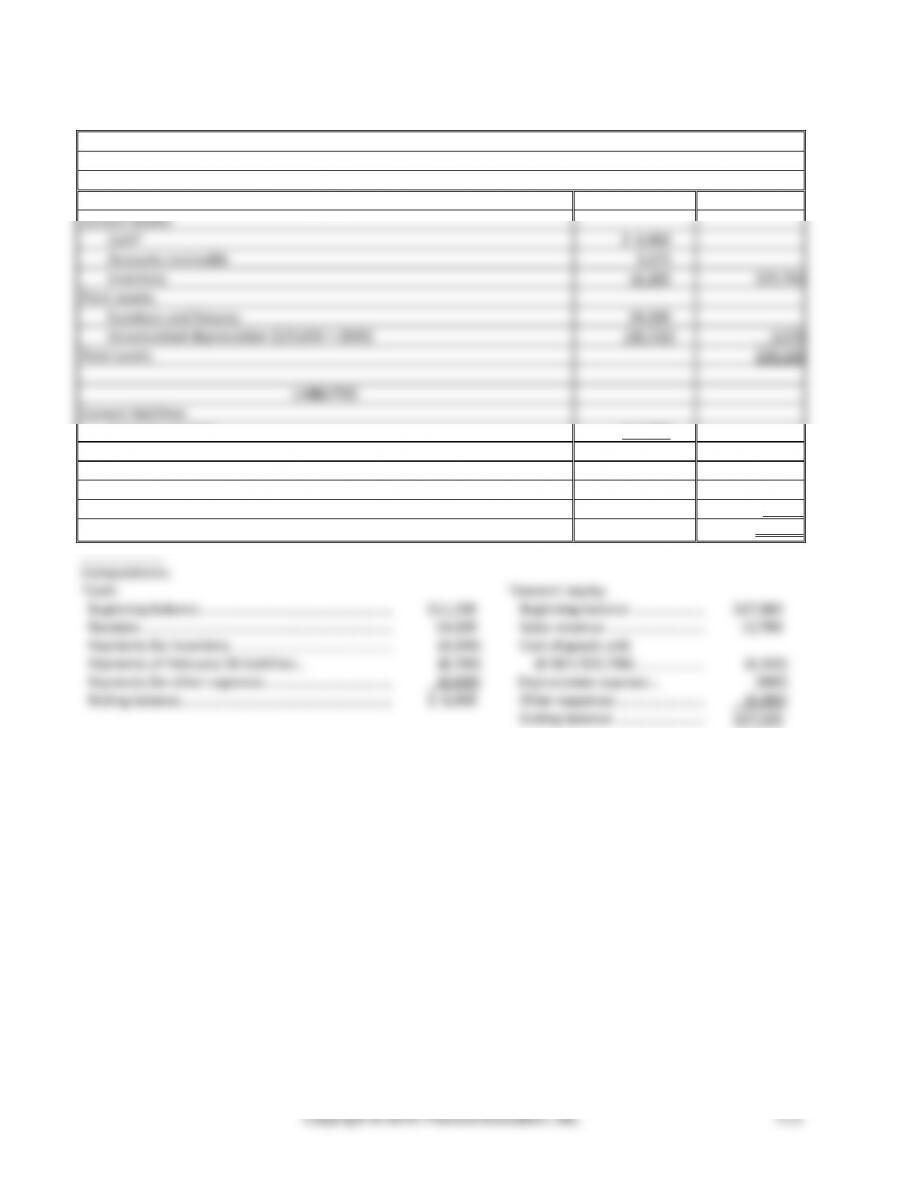
Games Corporation
Budgeted Balance Sheet
March 31
ASSETS
Current Assets:
Casha
$ 6,400
Accounts receivable
3,175
Inventory
16,185
$25,760
Plant assets:
Furniture and fixtures
34,300
Accumulated depreciation ($29,830 + $900)
(30,730)
3,570
Total assets
$29,330
LIABILITIES
Current liabilities:
Accounts payable
$ 2,000
Total liabilities
$ 2,000
OWNERS’ EQUITY
Stockholders’ equityb
27,330
Total liabilities and owners’ equity
$29,330
14,100
$27,330
Managerial Accounting 4e Solutions Manual
(15−20 min.) E9-32A
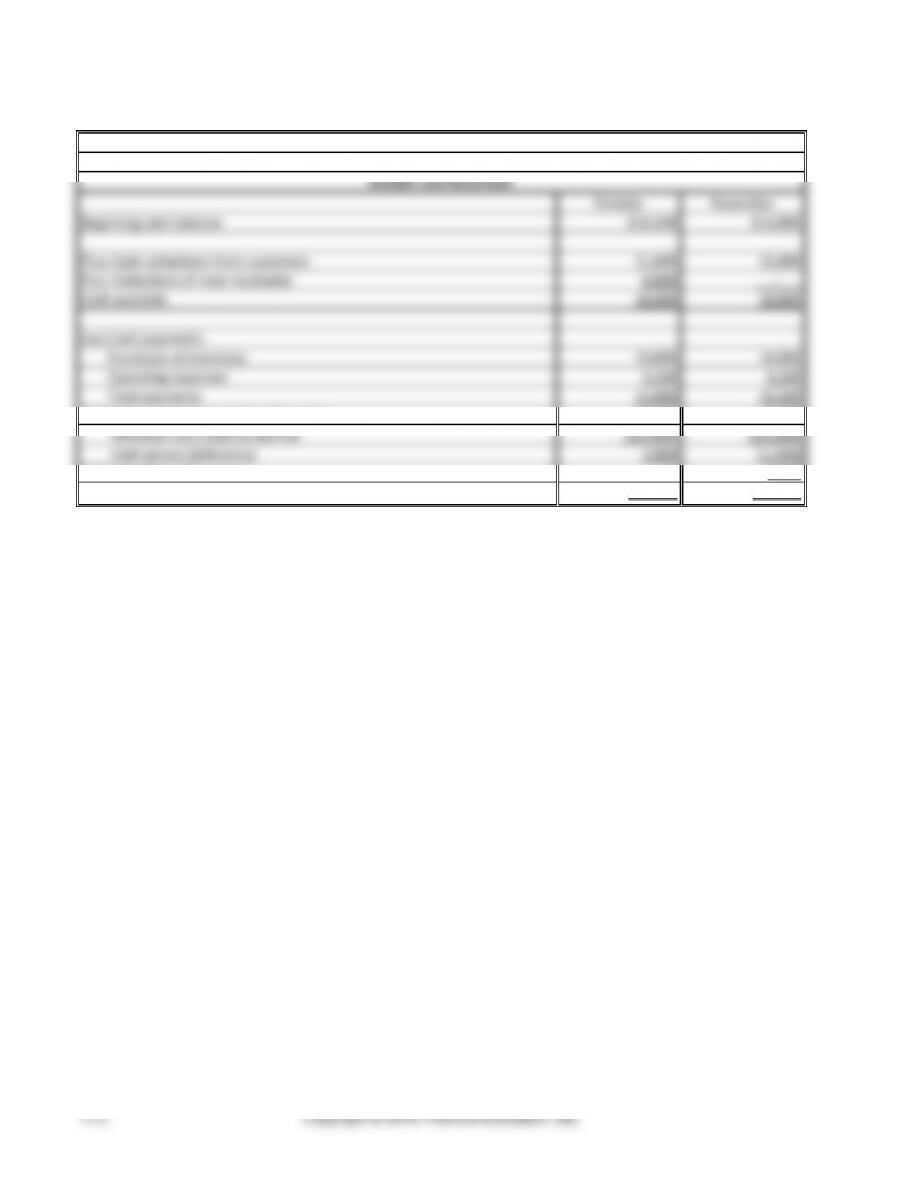
Flash Medical Supply
Cash Budget
October and November
October
November
Beginning cash balance
$10,200
$13,000
Plus: Cash collections from customers
11,800
15,800
Plus: Collections of note receivable
6,000
–
Cash available
28,000
28,800
Less Cash payments:
Purchases of inventory
10,800
14,900
Operating expenses
4,200
4,200
Total payments
15,000
19,100
(1) Ending cash balance before financing
13,000
9,700
Minimum cash balance desired
(11,000)
(11,000)
Cash excess (deficiency)
2,000
(1,300)
(2) Total effect of financing
-0-
2,000
Ending cash balance, (1) + (2)
$13,000
$11,700
(20 min.) E9-33A
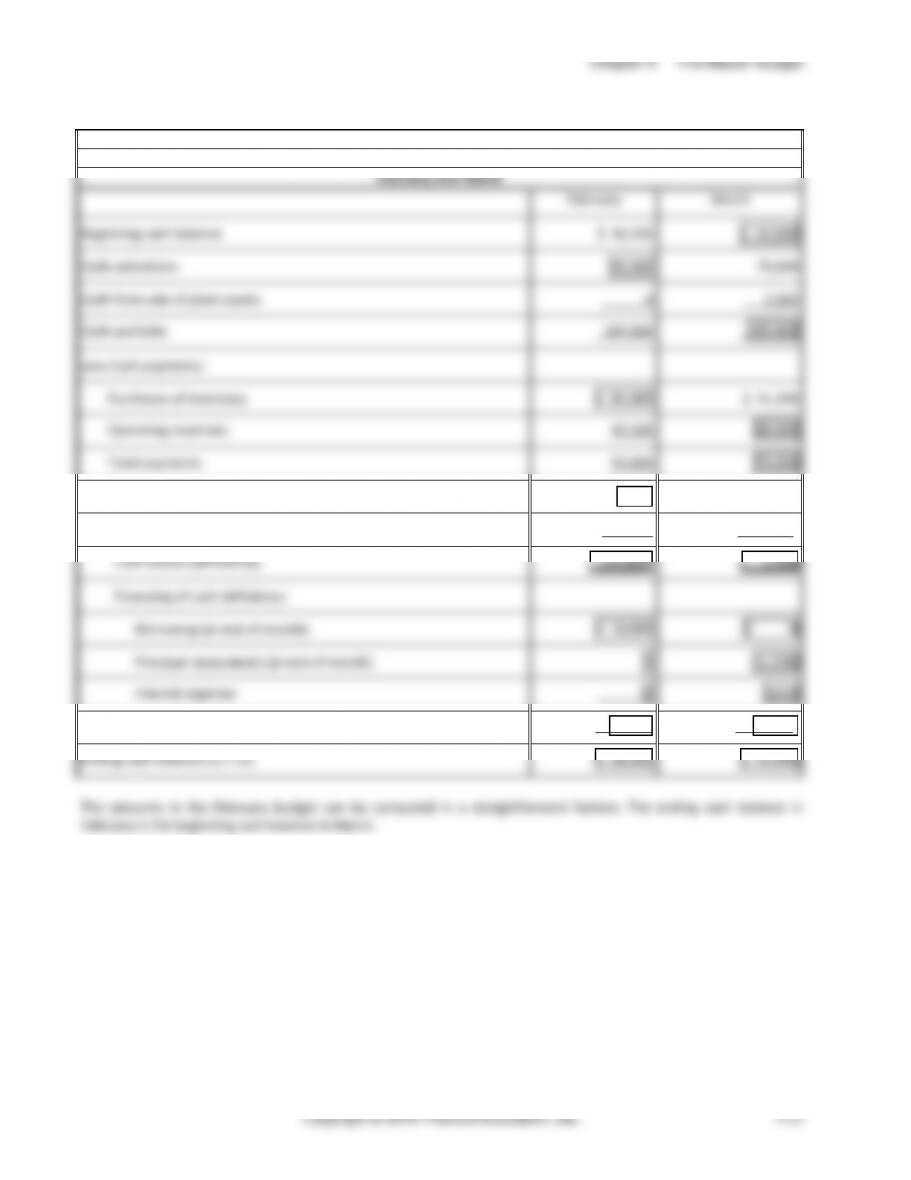
Backyard Adventures
Cash Budget
February and March
February
March
Beginning cash balance
$ 16,500
$ 24,000
Cash collections
90,500
79,600
Cash from sale of plant assets
0
2,000
Cash available
107,000
105,600
Less Cash payments:
Purchases of inventory
$ 50,300
$ 41,200
Operating expenses
47,500
38,000
Total payments
97,800
79,200
(1) Ending cash balance before financing
9,200
26,400
Less: Minimum cash balance desired
(24,000)
(24,000)
Cash excess (deficiency)
(14,800)
2,400
Financing of cash deficiency:
Borrowing (at end of month)
$ 14,800
$ 0
Principal repayments (at end of month)
0
(2,208)
Interest expense
0
(192)
(2) Total effects of financing
14,800
(2,400)
Ending cash balance (1) + (2)
$ 24,000
$ 24,000
The amounts in the February budget can be computed in a straightforward fashion. The ending cash balance in
February is the beginning cash balance in March.
Managerial Accounting 4e Solutions Manual
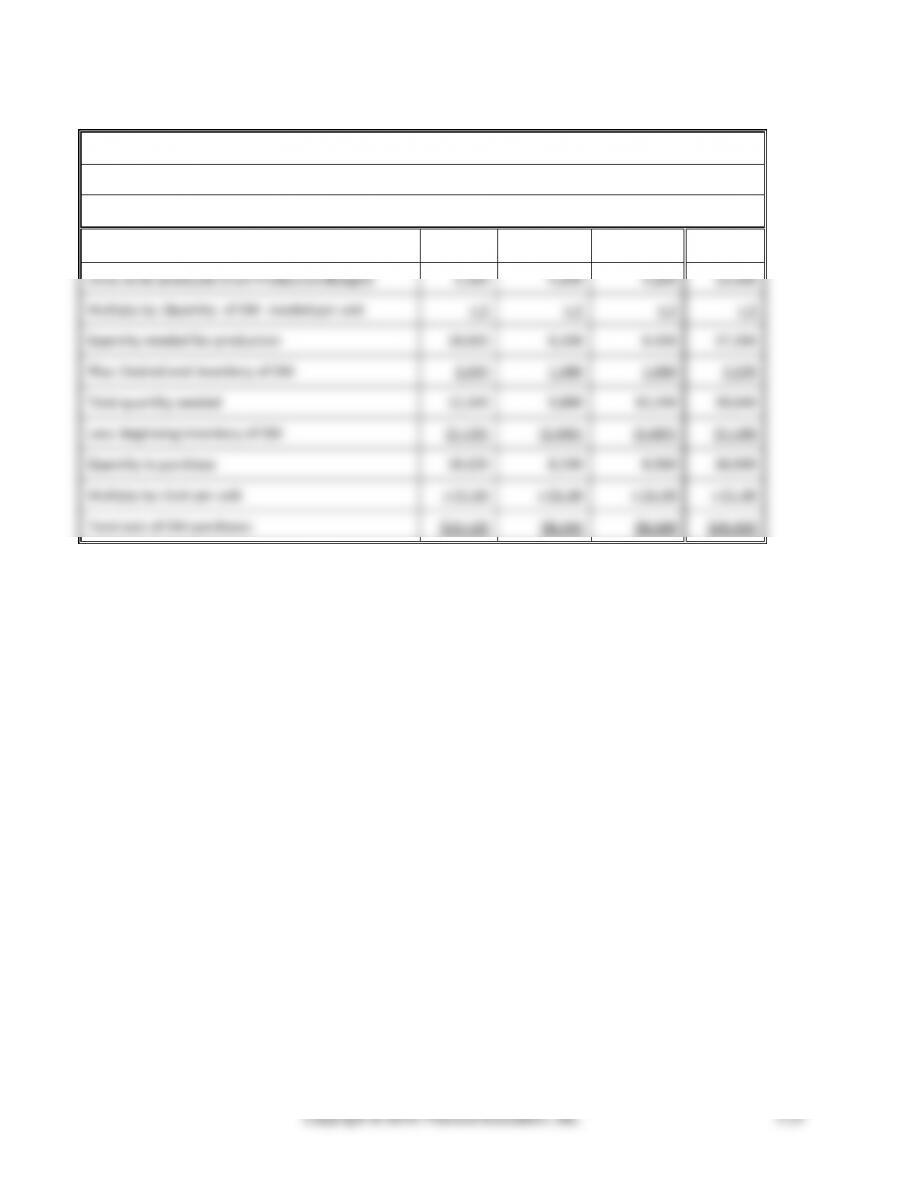
(15-20 min.) E9-34A
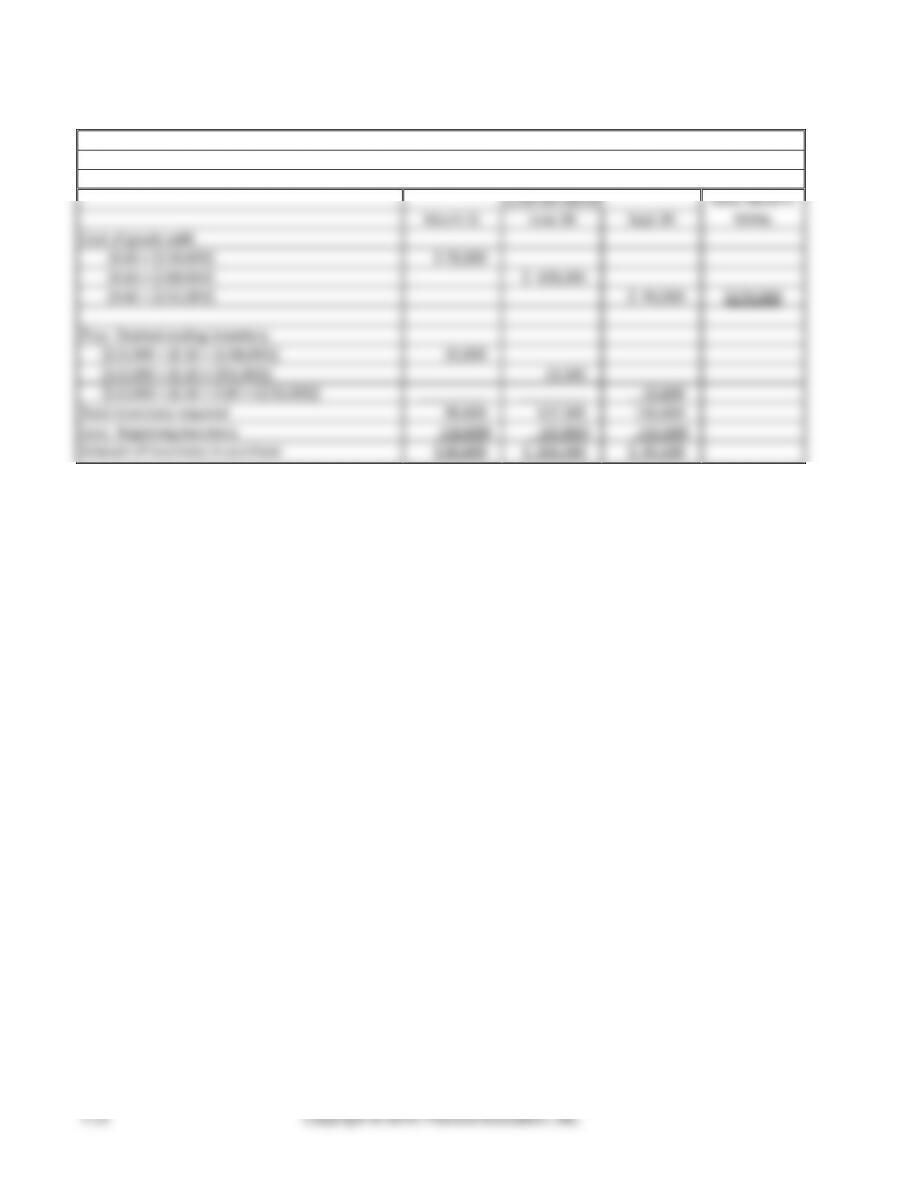
Scannell Readers
Inventory, Purchases, and Cost of Goods Sold Budget
Nine Months Ended September 30
QUARTER ENDED
NINE-MONTH
March 31
June 30
Sept.30
TOTAL
Cost of goods sold:
(0.60 × $130,000)
$ 78,000
(0.60 × $180,000)
$ 108,000
(0.60 × $155,000)
$ 93,000
$279,000
Plus: Desired ending inventory
[$10,000 + (0.10 × $108,000)]
20,800
[$10,000 + (0.10 × $93,000)]
19,300
[$10,000 + (0.10 × 0.60 × $230,000)]
23,800
Total inventory required
98,800
127,300
116,800
Less: Beginning inventory
(18,000)
(20,800)
(19,300)
Amount of inventory to purchase
$ 80,800
$ 106,500
$ 97,500
Quarter 2
Quarter 3
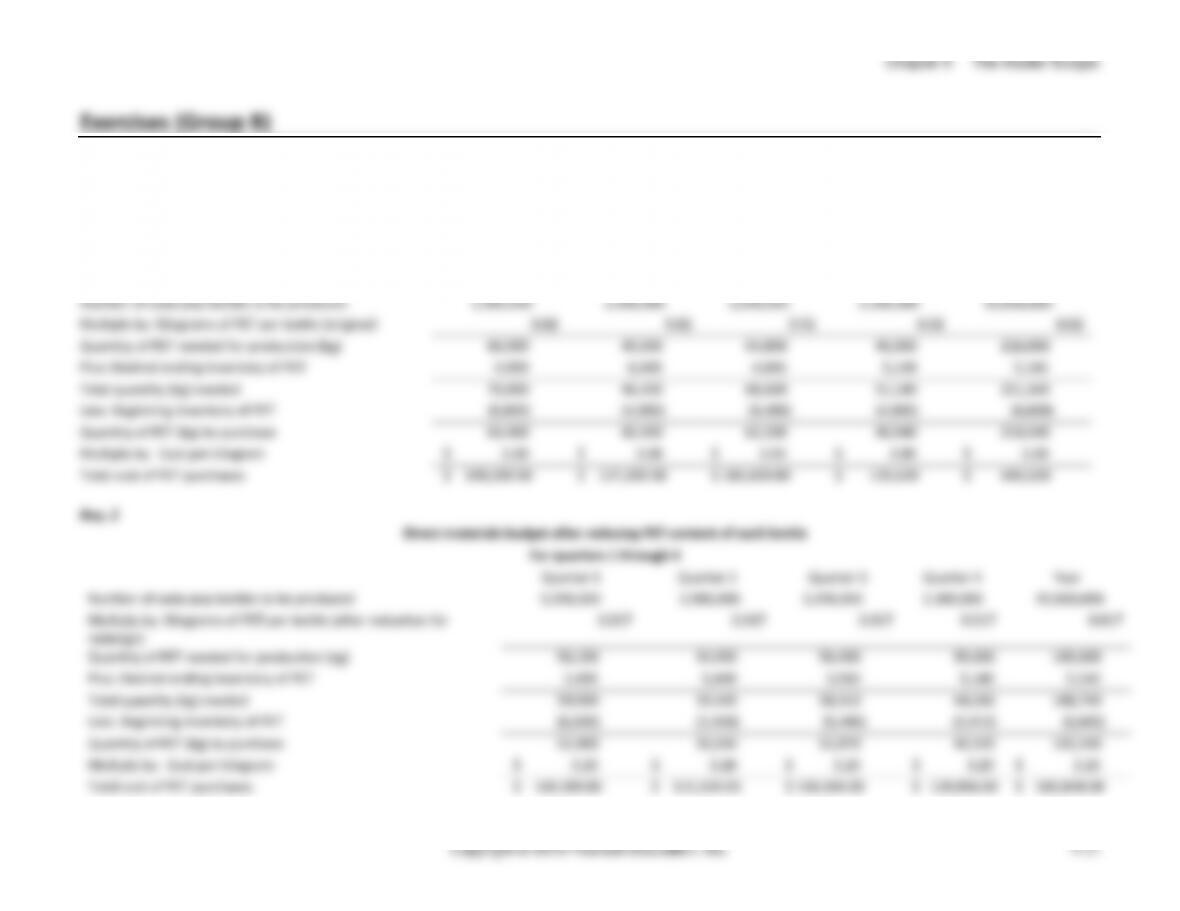
(10-15 min.) E9-35B
Req. 1
Direct materials budget before any changes
For quarters 1 through 4
Quarter 1
Quarter 2
Quarter 3
Quarter 4
Year
Number of soda pop bottles to be produced
3,300,000
2,000,000
3,200,000
2,300,000
10,800,000
Multiply by: Kilograms of PET per bottle (original)
0.02
0.02
0.02
0.02
0.02
Quantity of PET needed for production (kg)
66,000
40,000
64,000
46,000
216,000
Plus: Desired ending inventory of PET
4,000
6,400
4,600
5,140
5,140
Total quantity (kg) needed
70,000
46,400
68,600
51,140
221,140
Less: Beginning inventory of PET
(6,600)
(4,000)
(6,400)
(4,600)
(6,600)
Quantity of PET (kg) to purchase
63,400
42,400
62,200
46,540
214,540
Multiply by: Cost per kilogram
$ 3.00
$ 3.00
$ 3.00
$ 3.00
$ 3.00
Total cost of PET purchases
$ 190,200.00
$ 127,200.00
$ 186,600.00
$ 139,620
$ 643,620
Managerial Accounting 4e Solutions Manual
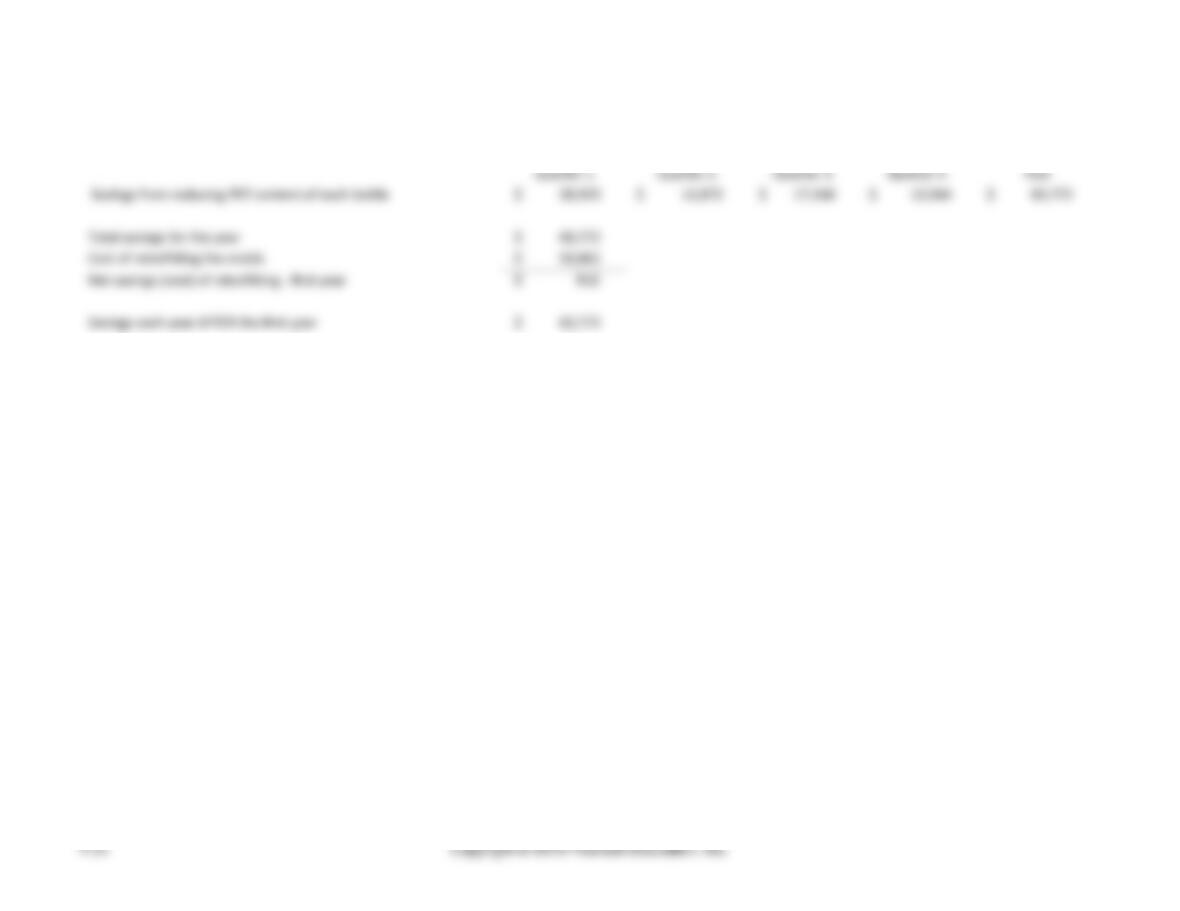
(continued) E9-35B
Req. 3
Quarter 1
Quarter 2
Quarter 3
Quarter 4
Year
Savings from reducing PET content of each bottle
$ 20,920
$ 11,872
$ 17,416
$ 10,564
$ 60,772
Total savings for the year
$ 60,772
Cost of retrofitting the molds
$ 59,862
Net savings (cost) of retrofitting – first year
$ 910
Savings each year AFTER the first year
$ 60,772
Chapter 9 The Master Budget
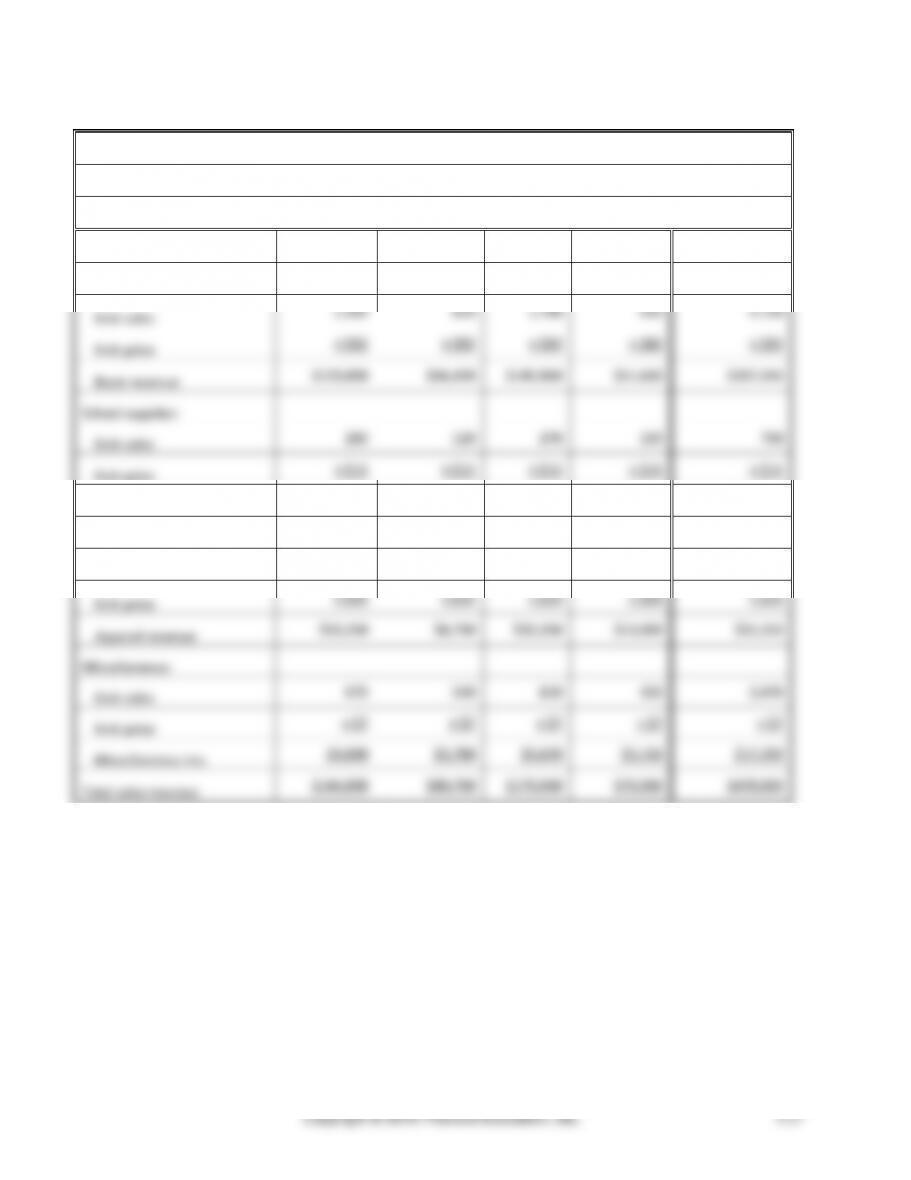
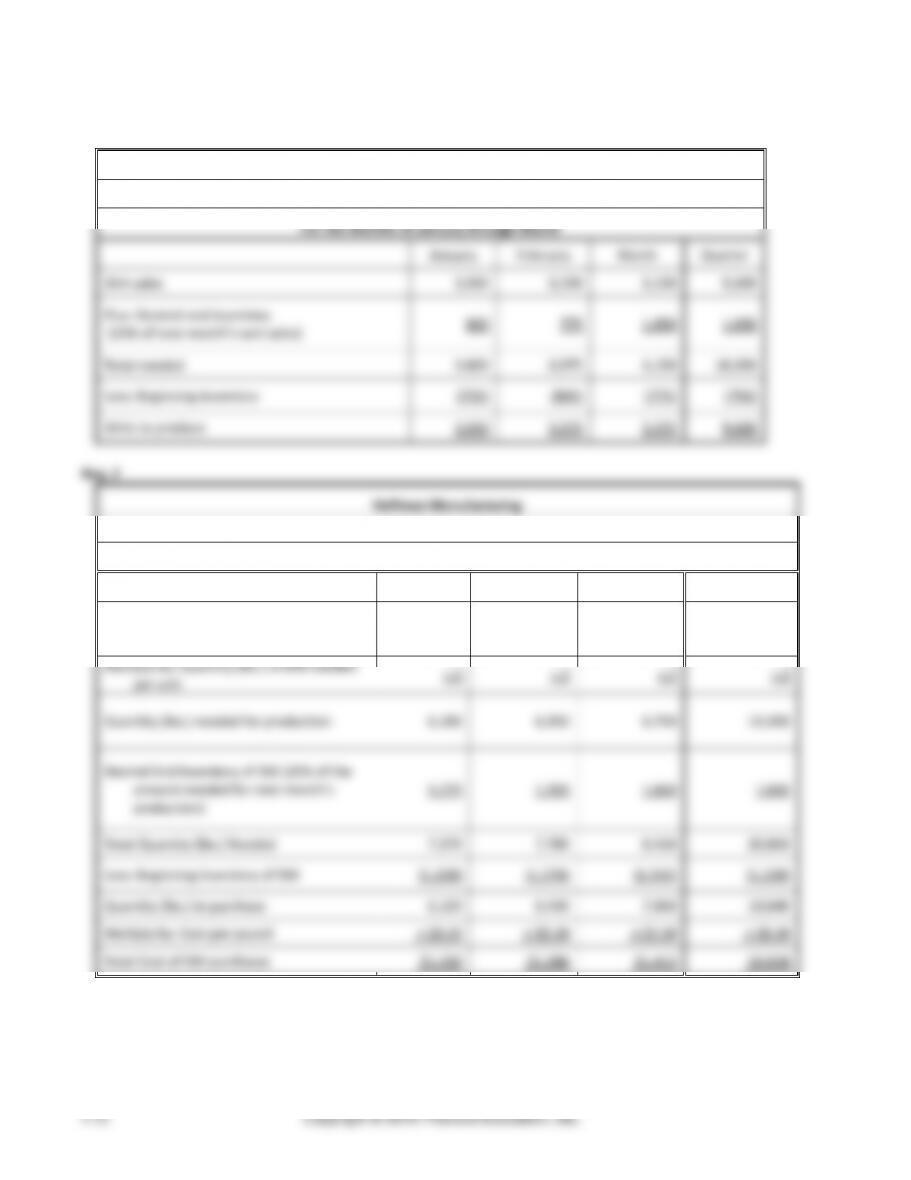
(10 min.) E9-36B
Albany College Bookstore
Sales Budget
For the Upcoming Year
Q1
Q2
Q3
Q4
Year
Books:
Unit sales
1,500
810
1,780
630
4,720
Unit price
× $82
× $82
× $82
× $82
× $82
Book revenue
$123,000
$66,420
$145,960
$51,660
$387,040
School supplies:
Unit sales
210
120
270
150
750
Unit price
× $15
× $15
× $15
× $15
× $15
School supplies rev.
$3,150
$1,800
$4,050
$2,250
$11,250
Apparel:
Unit sales
530
350
810
520
2,210
Unit price
× $25
× $25
× $25
× $25
× $25
Apparel revenue
$13,250
$8,750
$20,250
$13,000
$55,250
Miscellaneous:
Unit sales
670
540
810
450
2,470
Unit price
× $7
× $7
× $7
× $7
× $7
Miscellaneous rev.
$4,690
$3,780
$5,670
$3,150
$17,290
Total sales revenue
$144,090
$80,750
$175,930
$70,060
$470,830
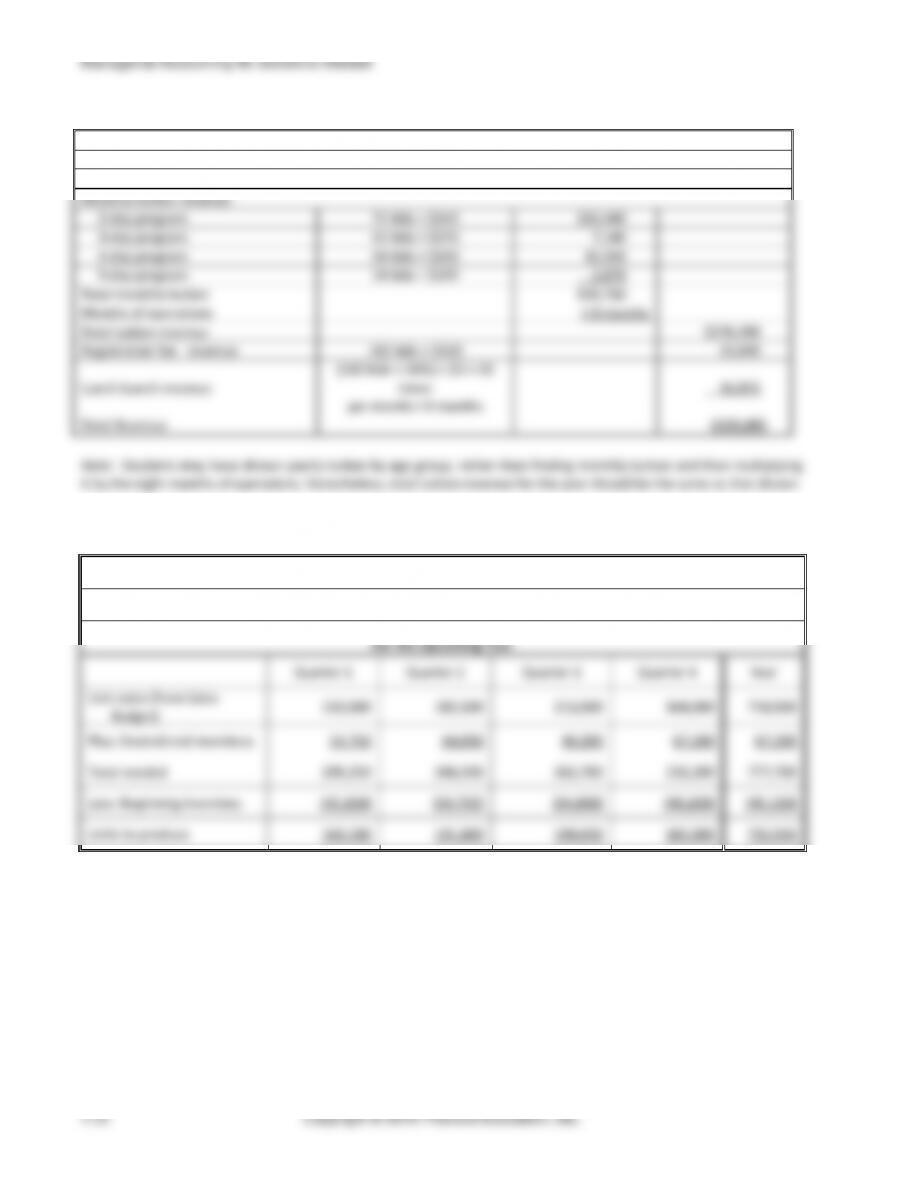
(10-20 min.) E9-37B
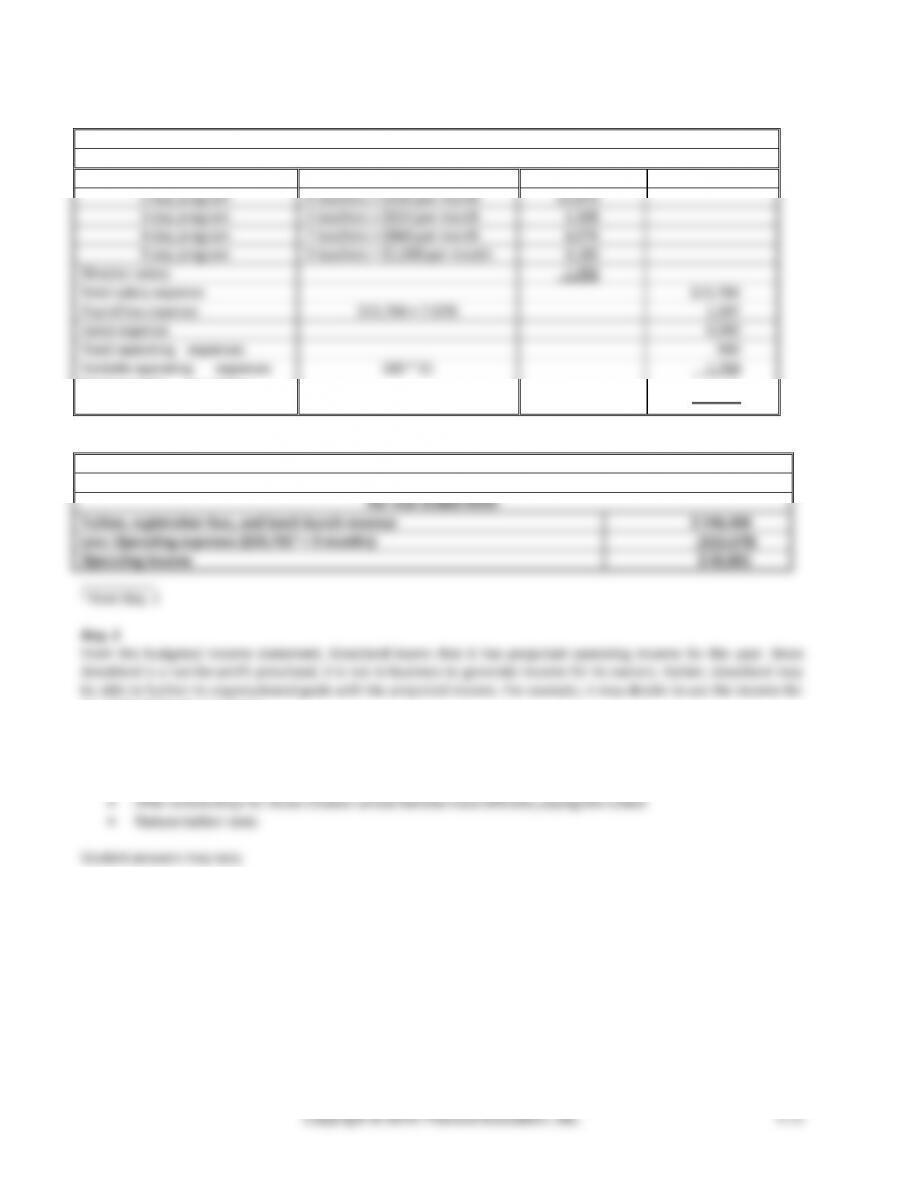
Geary Preschool
Budgeted Revenue
For Year Ended XXXX
Monthly tuition revenue:
2-day program
72 kids × $145
$10,440
3-day program
42 kids × $170
7,140
4-day program
54 kids × $190
10,260
5-day program
14 kids × $205
2,870
Total monthly tuition
$30,710
Months of operations
× 9 months
Total tuition revenue
$276,390
Registration fee revenue
182 kids × $120
21,840
Lunch bunch revenue
(182 kids × 50%) × $3 × 15
times
per month × 9 months
36,855
Total Revenue
$335,085
Note: Students may have shown yearly tuition by age group, rather than finding monthly tuition and then multiplying
it by the eight months of operations. Nonetheless, total tuition revenue for the year should be the same as that shown.
(10-15 min.) E9-38B
Ringer Foods
Production Budget
For the Upcoming Year
Quarter 1
Quarter 2
Quarter 3
Quarter 4
Year
Unit sales (from Sales
Budget)
150,500
182,500
213,500
164,000
710,500
Plus: Desired end inventory
54,750
64,050
49,200
67,200
67,200
Total needed
205,250
246,550
262,700
231,200
777,700
Less: Beginning inventory
(45,150)
(54,750)
(64,050)
(49,200)
(45,150)
Units to produce
160,100
191,800
198,650
182,000
732,550
Chapter 9 The Master Budget
(5 min.) E9-39B
Gable Industries
Direct Materials Budget
For the Months of January through March
January
February
March
Quarter
Units to be produced (from Production Budget)
5,300
4,100
4,200
13,600
Multiply by: Quantity of DM needed per unit
× 2
× 2
× 2
× 2
Quantity needed for production
10,600
8,200
8,400
27,200
Plus: Desired end inventory of DM
1,640
1,680
1,680
2,120
Total quantity needed
12,240
9,880
10,240
29,040
Less: Beginning Inventory of DM
(2,120)
(1,640)
(1,680)
(2,120)
Quantity to purchase
10,120
8,240
8,560
26,920
Multiply by: Cost per unit
× $1.00
× $1.00
× $1.00
× $1.00
Total cost of DM purchases
$10,120
$8,240
$8,560
$26,920
Managerial Accounting 4e Solutions Manual
(5 min.) E9-40B
Req. 1
Hoffman Manufacturing
Production Budget
For the Months of January through March
January
February
March
Quarter
Unit sales
3,000
3,200
3,100
9,300
Plus: Desired end inventory
(25% of next month’s unit sales)
800
775
1,050
1,050
Total needed
3,800
3,975
4,150
10,350
Less: Beginning inventory
(750)
(800)
(775)
(750)
Units to produce
3,050
3,175
3,375
9,600
Req. 2
Hoffman Manufacturing
Direct Materials Budget
For the Months of January through March
January
February
March
Quarter
Units to be produced
(from Production Budget)
3,050
3,175
3,375
9,600
Multiply by: Quantity (lbs.) of DM needed
per unit
× 2
× 2
× 2
× 2
Quantity (lbs.) needed for production
6,100
6,350
6,750
19,200
Desired End Inventory of DM (20% of the
amount needed for next month’s
production)
1,270
1,350
1,660
1,660
Total Quantity (lbs.) Needed
7,370
7,700
8,410
20,860
Less: Beginning Inventory of DM
(1,220)
(1,270)
(1,350)
(1,220)
Quantity (lbs.) to purchase
6,150
6,430
7,060
19,640
Multiply by: Cost per pound
× $0.20
× $0.20
× $0.20
× $0.20
Total Cost of DM purchases
$1,230
$1,286
$1,412
$3,928
Chapter 9 The Master Budget
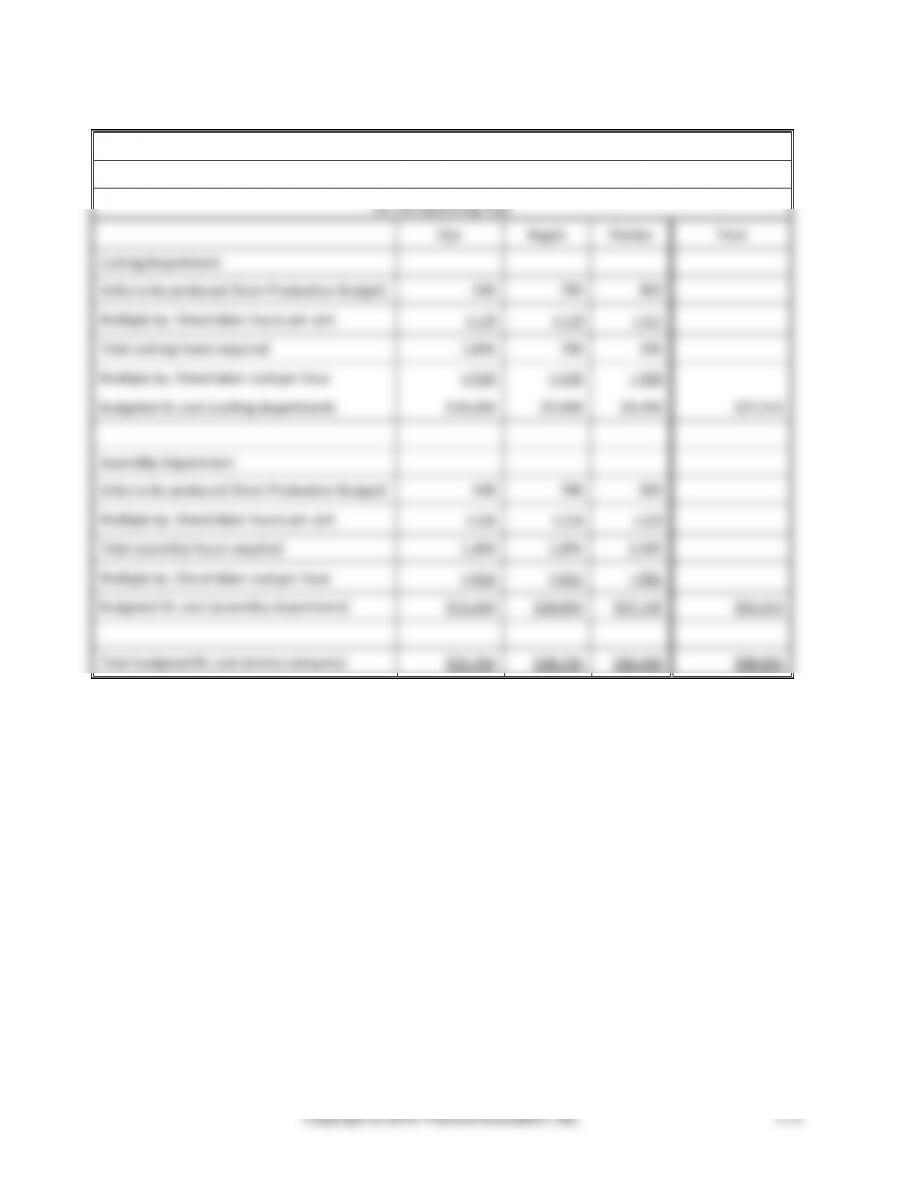
(15 min.) E9-41B
Cleary Industries
Direct Labor Budget
For the Upcoming Year
Zips
Regals
Flashes
Total
Cutting Department
Units to be produced (from Production Budget)
540
790
850
Multiply by: Direct labor hours per unit
× 1.9
× 1.0
× 1.1
Total cutting hours required
1,026
790
935
Multiply by: Direct labor cost per hour
× $10
× $10
× $10
Budgeted DL cost (cutting department)
$10,260
$7,900
$9,350
$27,510
Assembly Department
Units to be produced (from Production Budget)
540
790
850
Multiply by: Direct labor hours per unit
× 2.6
× 2.4
× 2.9
Total assembly hours required
1,404
1,896
2,465
Multiply by: Direct labor cost per hour
× $11
× $11
× $11
Budgeted DL cost (assembly department)
$15,444
$20,856
$27,115
$63,415
Total budgeted DL cost (entire company)
$25,704
$28,756
$36,465
$90,925
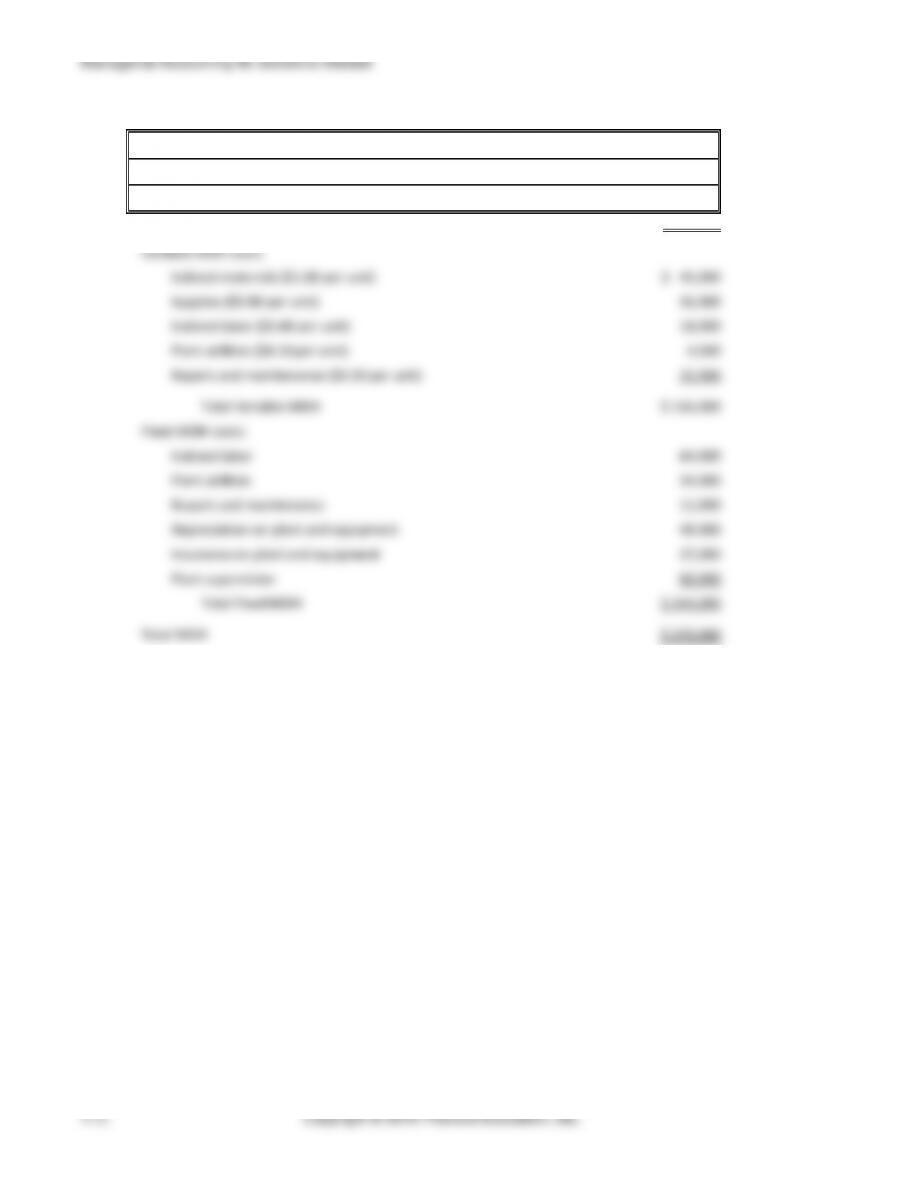
(5 min.) E9-42B
The Henry Company
Manufacturing Overhead Budget
For the Upcoming Year
Projected Sales (from Sales Budget)
45,000
Variable MOH costs:
Indirect materials ($1.00 per unit)
$ 45,000
Supplies ($0.80 per unit)
36,000
Indirect labor ($0.40 per unit)
18,000
Plant utilities ($0.10 per unit)
4,500
Repairs and maintenance ($0.50 per unit)
22,500
Total Variable MOH
$ 126,000
Fixed MOH costs:
Indirect labor
64,000
Plant utilities
34,000
Repairs and maintenance
11,000
Depreciation on plant and equipment
48,000
Insurance on plant and equipment
27,000
Plant supervision
60,000
Total Fixed MOH
$ 244,000
Total MOH
$ 370,000
Chapter 9 The Master Budget
(20-30 min.) E9-43B
Req. 1
Greatland Preschool
Budgeted Monthly Operating Expenses
Teachers’ salary:
2-day program
9 teachers × $430 per month
$3,870
3-day program
2 teachers × $654 per month
1,308
4-day program
7 teachers × $868 per month
6,076
5-day program
3 teachers × $1,060 per month
3,180
Director salary
1,350
Total salary expense
$15,784
Payroll tax expense
$15,784 × 7.65%
1,207
Lease expense
4,040
Fixed operating expenses
940
Variable operating expenses
160 * 11
1,760
Total monthly operating
expenses
$23,731
Req. 2
Greatland Preschool
Budgeted Income Statement
For Year Ended XXXX
Tuition, registration fees, and lunch bunch revenue
$ 246,400
Less: Operating expenses ($23,731a × 9 months)
(213,579)
Operating income
$ 32,821
__________
a from Req. 1
Req. 3
From the budgeted income statement, Greatland learns that it has projected operating income for the year. Since
Greatland is a not-for-profit preschool, it is not in business to generate income for its owners. Rather, Greatland may
be able to further its organizational goals with the projected income. For example, it may decide to use the income for
any of the following purposes:
• Invest in additional (or better) classroom equipment
• Invest in additional (or better) playground equipment
• Improve the current program (more crafts, books, better curriculum, special guest visitors, special programs,
field trips, etc.)
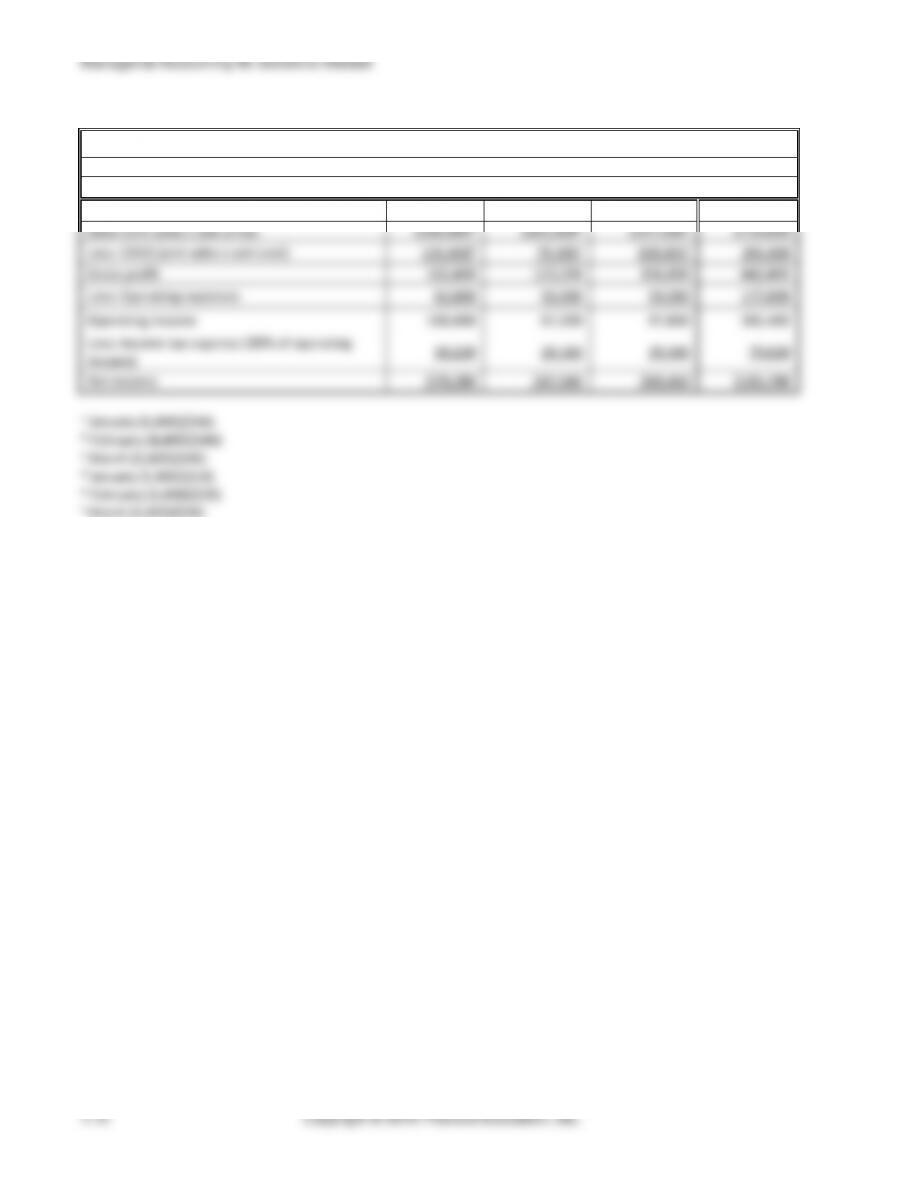
(5 min.) E9-44B
Rossdale Labs
Budgeted Income Statement
For the Quarter Ended March 31
Jan.
Feb.
March
Quarter
Sales (unit sales x sale price)
$266,800a
$202,400b
$257,600c
$726,800
Less: COGS (unit sales x unit cost)
104,400d
79,200e
100,800f
284,400
Gross profit
162,400
123,200
156,800
442,400
Less: Operating expenses
62,000
56,000
59,000
177,000
Operating income
100,400
67,200
97,800
265,400
Less: Income tax expense (30% of operating
income)
30,120
20,160
29,340
79,620
Net income
$70,280
$47,040
$68,460
$185,780
a January (5,800)($46)
b February (4,400)($46)
c March (5,600)($46)
d January (5,800)($18)
e February (4,400)($18)
f March (5,600)($18)
Chapter 9 The Master Budget
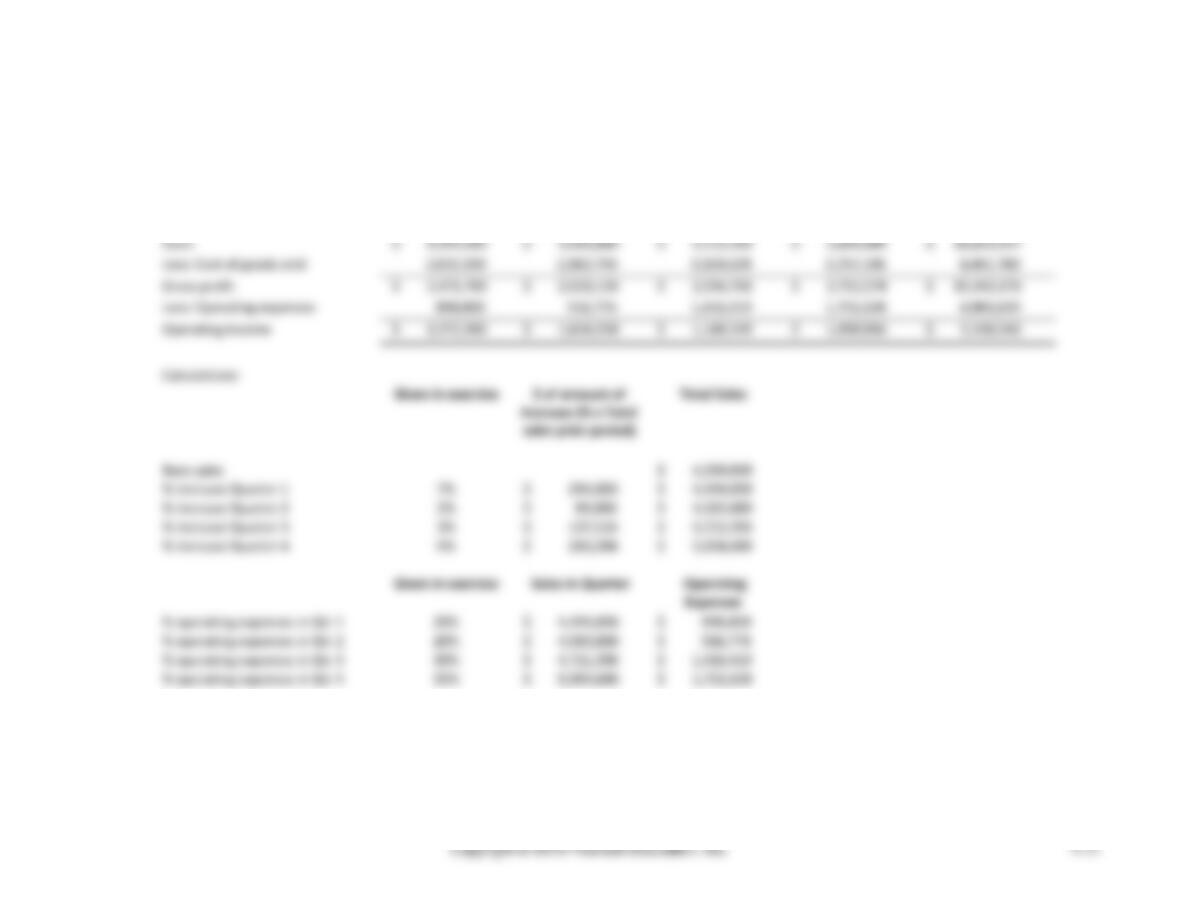
(5 min.) E9-45B
Samson Motors
Budgeted Income Statement
For the Upcoming Year
Quarter 1
Quarter 2
Quarter 3
Quarter 4
Year
Sales
$ 4,494,000
$ 4,583,880
$ 4,721,396
$ 5,004,680
$ 18,803,957
Less: Cost of goods sold
2,022,300
2,062,746
2,124,628
2,252,106
8,461,780
Gross profit
$ 2,471,700
$ 2,521,134
$ 2,596,768
$ 2,752,574
$ 10,342,176
Less: Operating expenses
898,800
916,776
1,416,419
1,751,638
4,983,633
Operating income
$ 1,572,900
$ 1,604,358
$ 1,180,349
$ 1,000,936
$ 5,358,543
Calculations:
Given in exercise
$ of amount of
increase (% x Total
sales prior period)
Total Sales
Base sales
$ 4,200,000
% increase Quarter 1
7%
$ 294,000
$ 4,494,000
% increase Quarter 2
2%
$ 89,880
$ 4,583,880
% increase Quarter 3
3%
$ 137,516
$ 4,721,396
% increase Quarter 4
6%
$ 283,284
$ 5,004,680
Given in exercise
Sales in Quarter
Operating
Expenses
% operating expenses in Qtr 1
20%
$ 4,494,000
$ 898,800
% operating expenses in Qtr 2
20%
$ 4,583,880
$ 916,776
% operating expenses in Qtr 3
30%
$ 4,721,396
$ 1,416,419
% operating expenses in Qtr 4
35%
$ 5,004,680
$ 1,751,638
Managerial Accounting 4e Solutions Manual
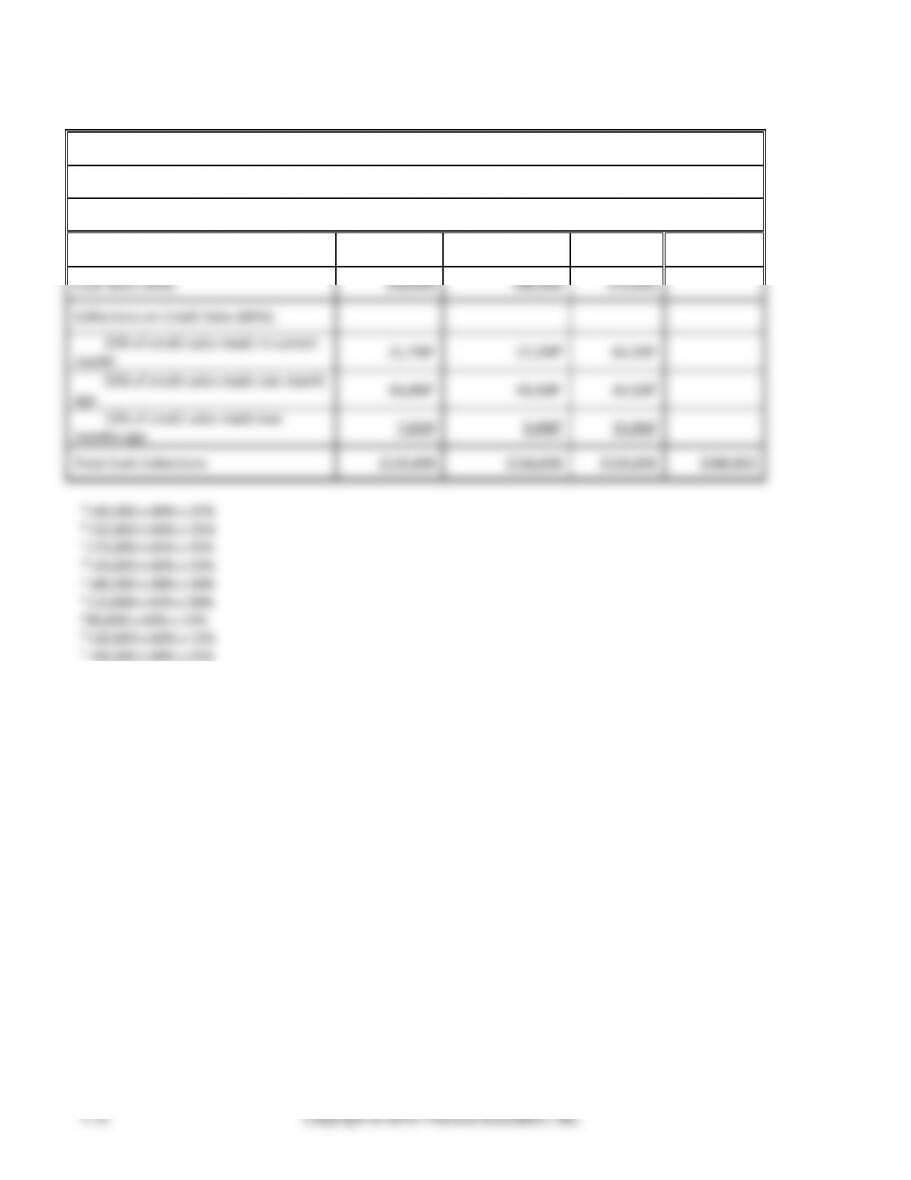
(5 min.) E9-46B
General Corporation
Cash Collections Budget
For the Months of January through March
January
February
March
Quarter
Cash Sales (40%)
$58,000
$46,000
$70,000
Collections on Credit Sales (60%):
25% of credit sales made in current
month
21,750a
17,250b
26,250c
50% of credit sales made one month
ago
33,000d
43,500e
34,500f
15% of credit sales made two
months ago
7,650g
9,900h
13,050i
Total Cash Collections
$120,400
$116,650
$143,800
$380,850
a 145,000 x 60% x 25%
b 115,000 x 60% x 25%
c 175,000 x 60% x 25%
d 110,000 x 60% x 50%
e 145,000 x 60% x 50%
f 115,000 x 60% x 50%
g 85,000 x 60% x 15%
h 110,000 x 60% x 15%
I 145,000 x 60% x 15%
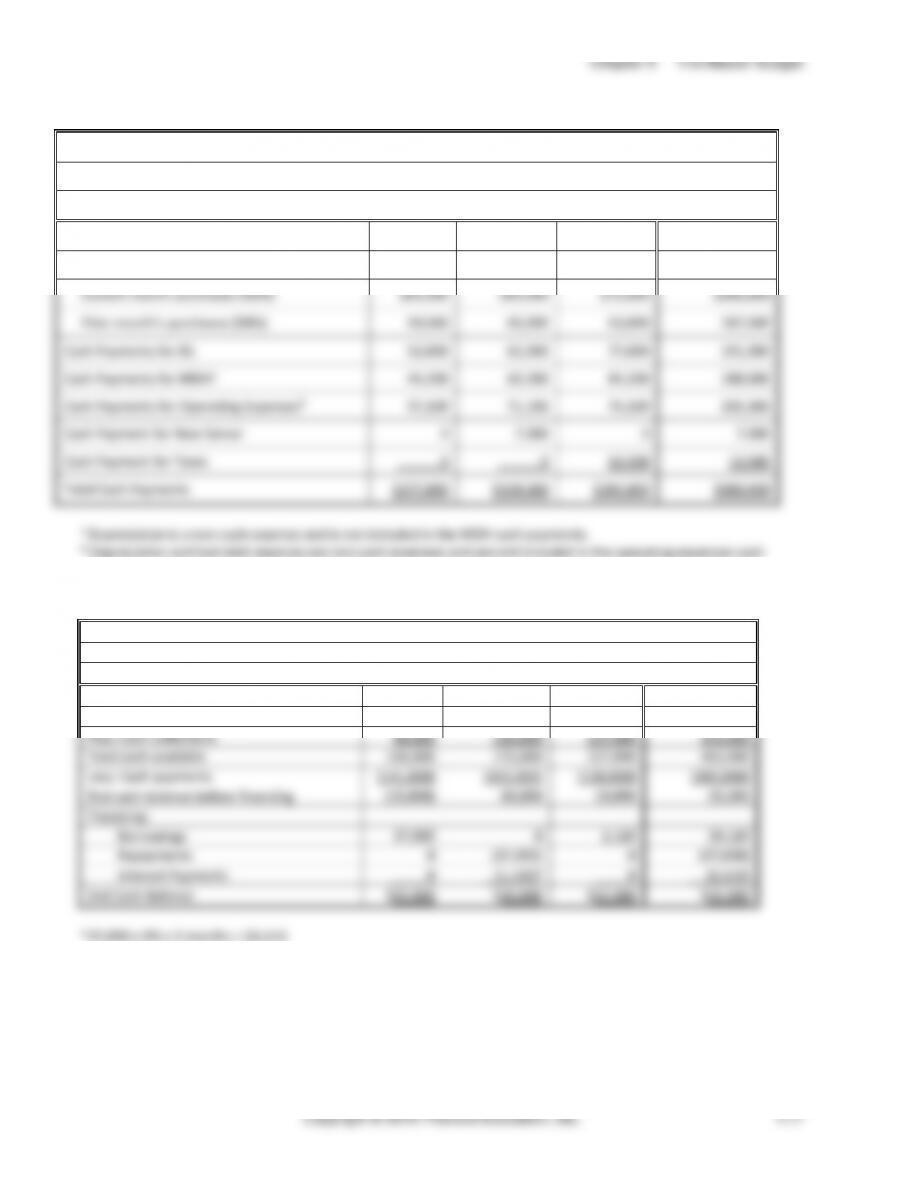
(5 min.) E9-47B
Bauer Corporation
Cash Payments Budget
For the Months of April through June
April
May
June
Quarter
Cash Payments for DM:
Current month purchases (50%)
$65,000
$63,000
$72,000
$200,000
Prior month’s purchases (50%)
59,500
65,000
63,000
187,500
Cash Payments for DL
52,000
62,000
77,000
191,000
Cash Payments for MOHa
44,200
60,200
84,200
188,600
Cash Payments for Operating Expensesb
57,100
71,100
74,100
202,300
Cash Payment for New Server
0
7,000
0
7,000
Cash Payment for Taxes
0
0
13,500
13,500
Total Cash Payments
$277,800
$328,300
$383,800
$989,900
a Depreciation is a non-cash expense and is not included in the MOH cash payments.
b Depreciation and bad debt expense are non-cash expenses and are not included in the operating expenses cash
payments.
(5 min.) E9-48B
Mission Health Center
Combined Cash Budget
For the Months of July through September
July
August
Sept.
Quarter
Beginning balance of cash
$30,000
$22,000
$30,890
$30,000
Plus: Cash collections
96,000
150,000
127,000
373,000
Total cash available
126,000
172,000
157,890
403,000
Less: Cash payments
(141,000)
(103,000)
(138,000)
(382,000)
End cash balance before financing
(15,000)
69,000
19,890
21,000
Financing:
Borrowings
37,000
0
2,110
39,110
Repayments
0
(37,000)
0
(37,000)
Interest Payments
0
(1,110)a
0
(1,110)
End Cash Balance
$22,000
$30,890
$22,000
$22,000
a 37,000 x 3% x 3 months = $1,110
Managerial Accounting 4e Solutions Manual
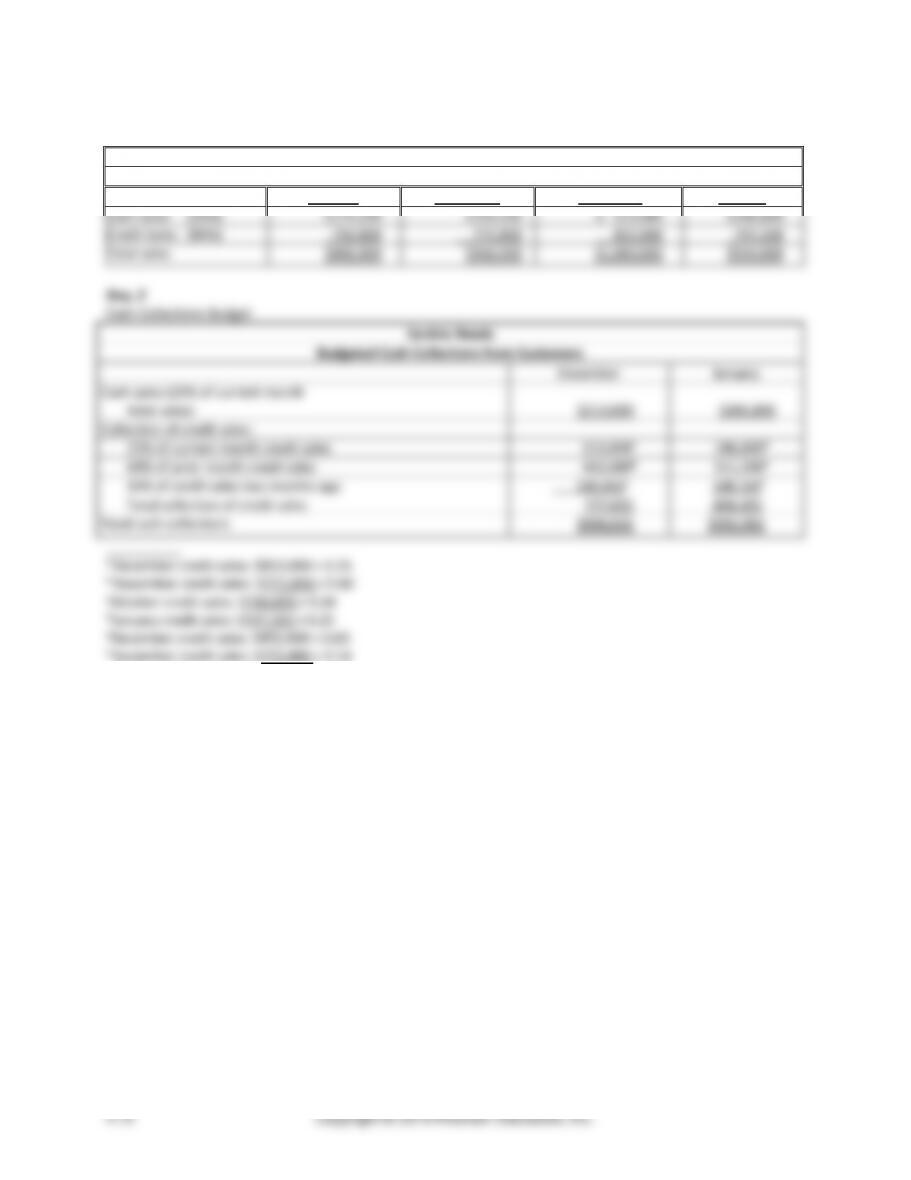
(20-30 min.) E9-49B
Req. 1
Sales Budget
Serdnic Reeds
Sales Budget
October
November
December
January
Cash Sales (20%)
$179,200
$193,200
$ 213,000
$186,800
Credit Sales (80%)
716,800
772,800
852,000
747,200
Total sales
$896,000
$966,000
$1,065,000
$934,000
Req. 2
Cash Collections Budget
Serdnic Reeds
Budgeted Cash Collections from Customers
December
January
Cash sales (20% of current month
total sales)
$213,000
$186,800
Collection of credit sales:
25% of current month credit sales
213,000a
186,800d
60% of prior month credit sales
463,680b
511,200e
14% of credit sales two months ago
100,352c
108,192f
Total collection of credit sales
777,032
806,192
Total cash collections
$990,032
$992,992
__________
a December credit sales: $852,000 × 0.25
b November credit sales: $772,800 × 0.60
cOctober credit sales: $716,800 × 0.14
dJanuary credit sales: $747,200 × 0.25
eDecember credit sales: $852,000 × 0.60
f November credit sales: $772,800 × 0.14
Chapter 9 The Master Budget
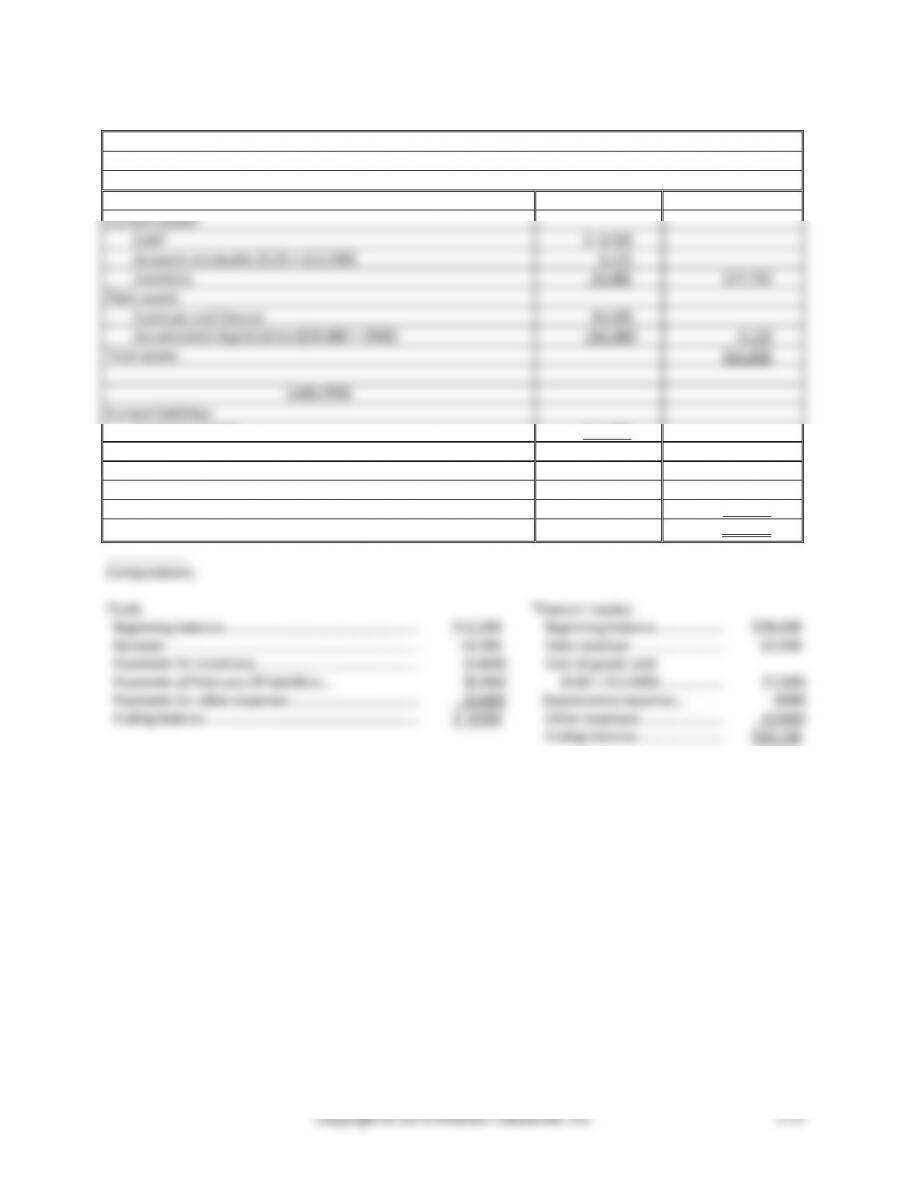
(25−30 min.) E9-50B
Marine Corporation
Budgeted Balance Sheet
March 31
ASSETS
Current Assets:
Casha
$ 9,500
Accounts receivable (0.25 × $12,500)
3,125
Inventory
15,085
$27,710
Plant assets:
Furniture and fixtures
34,500
Accumulated depreciation ($29,880 + $500)
(30,380)
4,120
Total assets
$31,830
LIABILITIES
Current liabilities:
Accounts payable
$ 1,700
Total liabilities
$ 1,700
OWNERS’ EQUITY
Owners’ equityb
30,130
Total liabilities and owners’ equity
$31,830
$28,630
14,300
Managerial Accounting 4e Solutions Manual
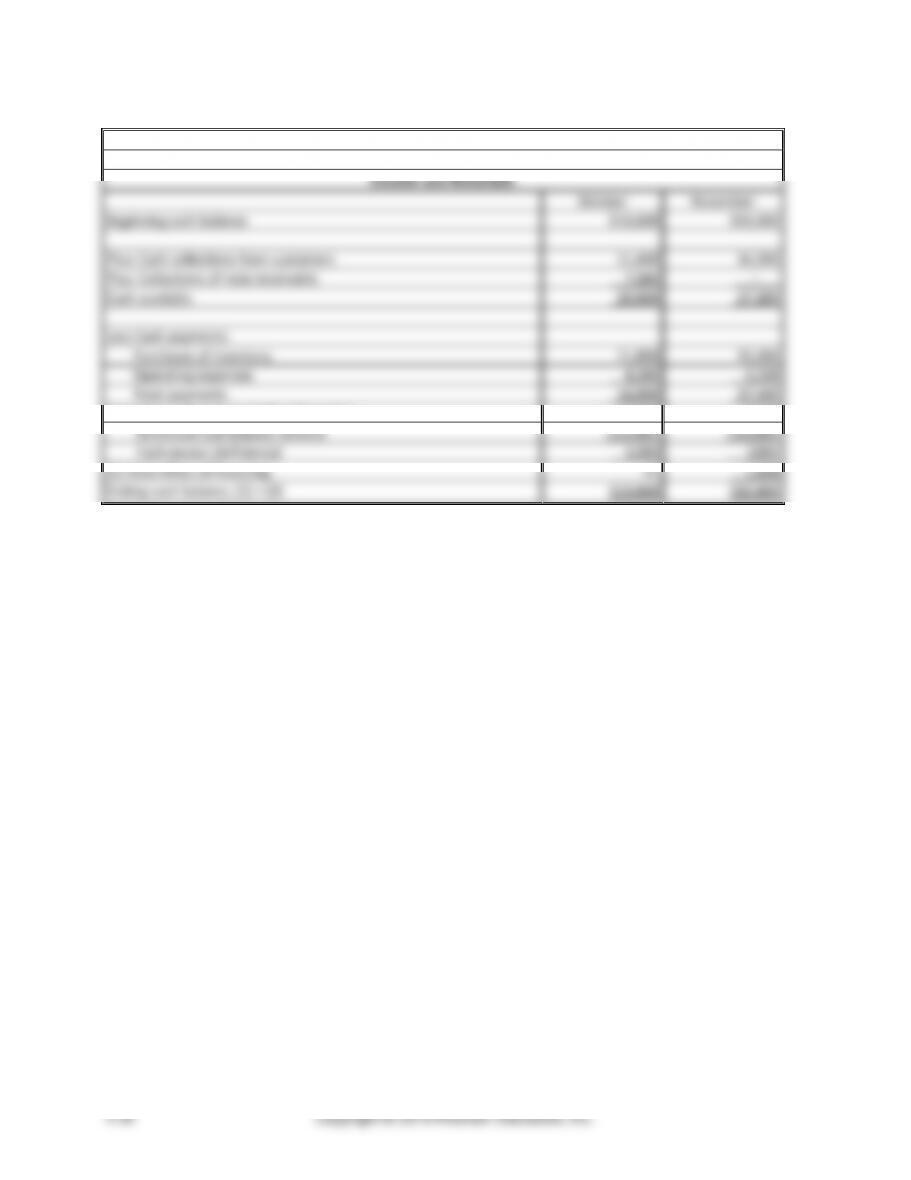
(15−20 min.) E9-51B
Speedy Medical Supply
Cash Budget
October and November
October
November
Beginning cash balance
$10,600
$13,000
Plus: Cash collections from customers
11,400
14,200
Plus: Collections of note receivable
7,000
–
Cash available
29,000
27,200
Less Cash payments:
Purchases of inventory
11,800
13,200
Operating expenses
4,200
4,200
Total payments
16,000
17,400
(1) Ending cash balance before financing
13,000
9,800
Minimum cash balance desired
(10,000)
(10,000)
Cash excess (deficiency)
3,000
(200)
(2) Total effect of financing
-0-
1,000
Ending cash balance, (1) + (2)
$13,000
$10,800