Chapter 9 The Master Budget
Copyright © 2015 Pearson Education, Inc.
9-1
Chapter 9
The Master Budget
Quick Check
Answers:
QC-1. c
QC-3. a
QC-5. b
QC-7. a
QC-9. a
QC-2. d
QC-4. d
QC-6. d
QC-8. b
QC-10. b
Short Exercises
(5-10 min.) S9-1
Prepare the components of the master budget in the following order:
Sales budget
Production budget
(5 min.) S9-2
a. Rolling budget
b. Master budget
c. Financial budgets
d. Production budget
Chapter 9 The Master Budget
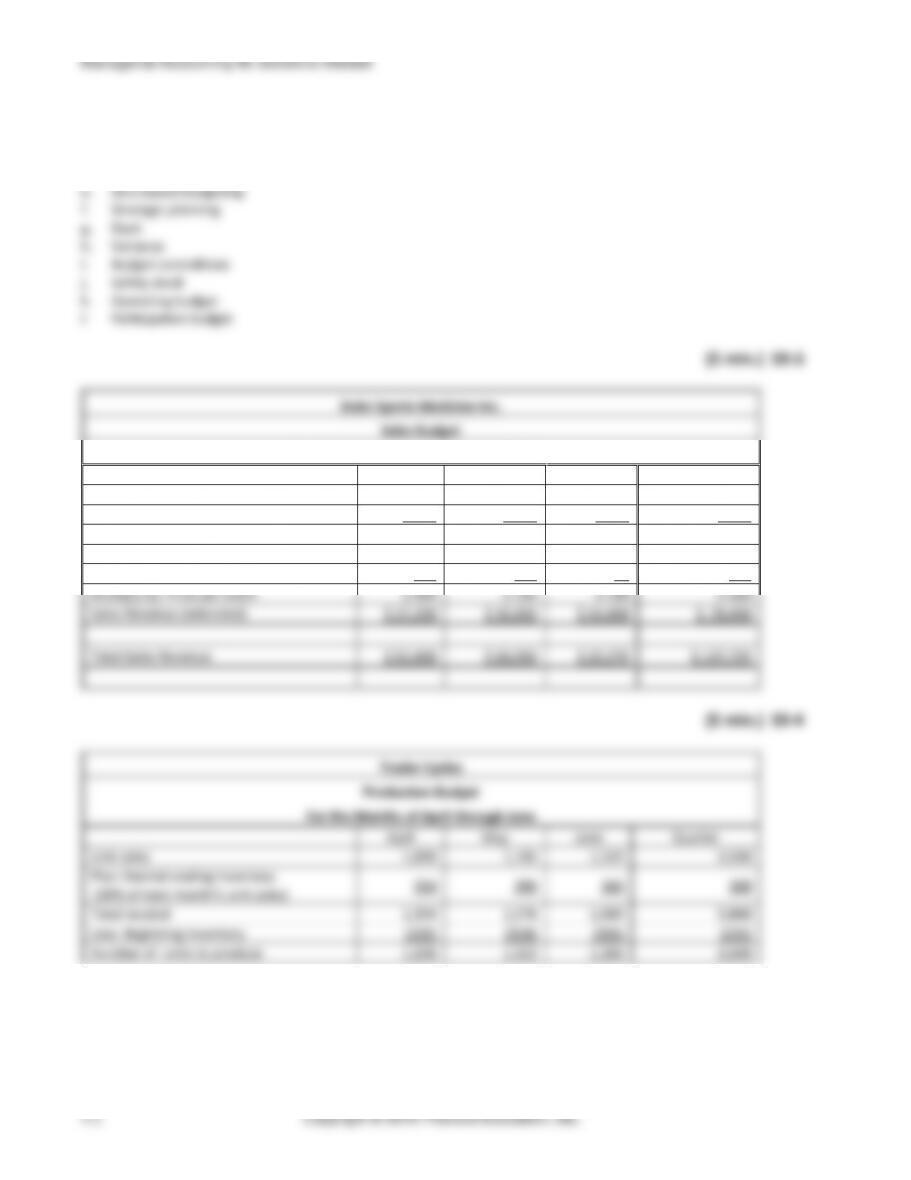
(5 min.) S9-5
The Bakery by the Bay
Direct Materials Budget
For the Months of July through September
July
August
Sept.
Quarter
Units to be produced
1,460
1,920
1,760
5,140
Multiply by: Pounds of flour
needed per unit
× 0.50
× 0.50
× 0.50
× 0.50
Quantity (lbs.) needed for
production
730
960
880
2,570
Plus: Desired end inventory of DM
(10% of the amount needed
for next month’s production)
96
88
74
74
Total quantity (lbs.) needed
826
1,048
954
2,644
Less: Beginning inventory of DM
(100)
(96)
(88)
(100)
Quantity (lbs.) to purchase
726
952
866
2,544
Multiply by: Cost per pound
× $2.00
× $2.00
× $2.00
× $2.00
Total cost of DM purchases
$1,452
$1,904
$1,732
$5,088
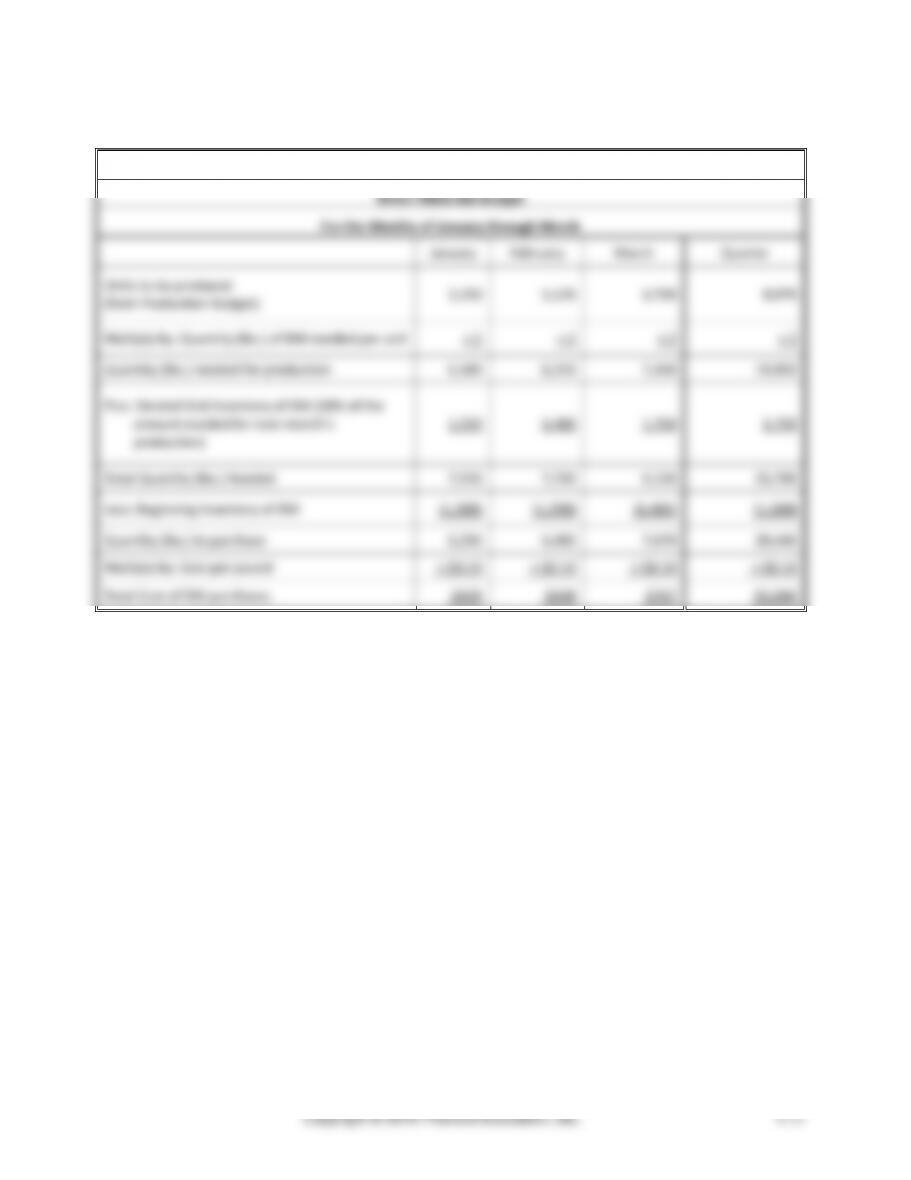
(5 min.) S9-6
Cameron Manufacturing
Direct Labor Budget
For the Months of January through March
January
February
March
Quarter
Units to be produced
560
600
860
2,020
Multiply by: Direct labor hours per unit
× 6.0
× 6.0
× 6.0
× 6.0
Total hours required
3,360
3,600
5,160
12,120
Multiply by: Direct labor cost per hour
× $16
× $16
× $16
× $16
Total direct labor cost
$53,760
$57,600
$82,560
$193,920
(5 min.) S9-7
Total Variable MOH
Plus: Fixed MOH
3,000
Total MOH
(5 min.) S9-8
Davenport Corporation
Operating Expenses Budget
For the Months of July through September
July
August
Sept.
Quarter
Sales Units
(from Sales Budget)
1,210
1,440
1,700
4,350
Variable Op. Expenses
($6 per unit sold)
7,260
8,640
10,200
26,100
Fixed Op. Expenses:
Salaries
5,100
5,100
5,100
15,300
Office Rent
3,300
3,300
3,300
9,900
Depreciation
2,200
2,200
2,200
6,600
Total Fixed Op. Expenses
10,600
10,600
10,600
31,800
Total Operating Expenses
$17,860
$19,240
$20,800
$57,900
Probe Corporation
Manufacturing Overhead Budget
For the Months of April through June
Chapter 9 The Master Budget
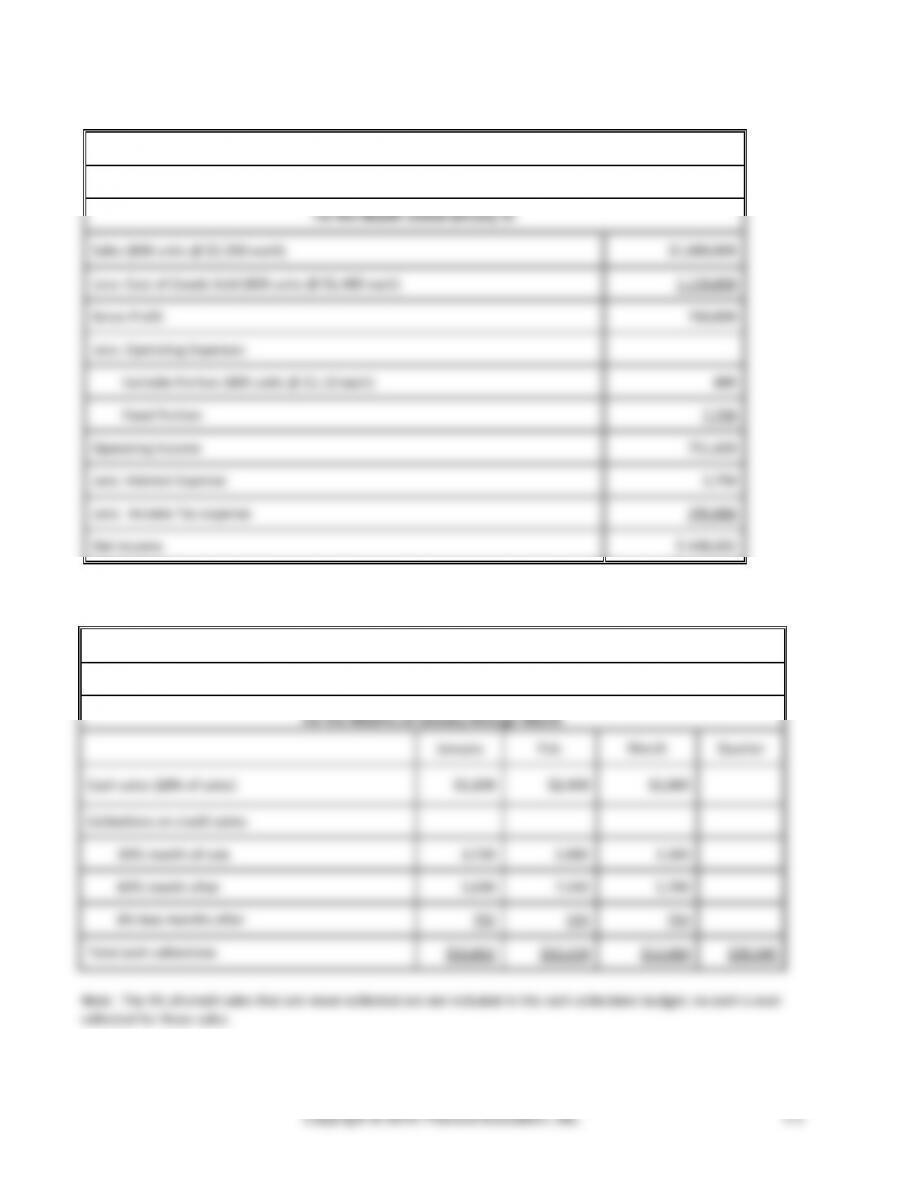
(5 min.) S9-9
Bell Simpson
Budgeted Income Statement
For the Month ended January 31
Sales (800 units @ $2,350 each)
$1,880,000
Less: Cost of Goods Sold (800 units @ $1,400 each)
1,120,000
Gross Profit
760,000
Less: Operating Expenses
Variable Portion (800 units @ $1.10 each)
880
Fixed Portion
7,700
Operating Income
751,420
Less: Interest Expense
3,700
Less: Income Tax expense
299,088
Net Income
$ 448,632
(5 min.) S9-10
Emerald Service
Cash Collections Budget
For the Months of January through March
January
Feb.
March
Quarter
Cash sales (20% of sales)
$3,100
$2,400
$2,800
Collections on credit sales:
30% month of sale
3,720
2,880
3,360
60% month after
5,040
7,440
5,760
6% two months after
792
504
744
Total cash collections
$12,652
$13,224
$12,664
$38,540
Note: The 4% of credit sales that are never collected are not included in the cash collections budget; no cash is ever
collected for these sales.
Managerial Accounting 4e Solutions Manual
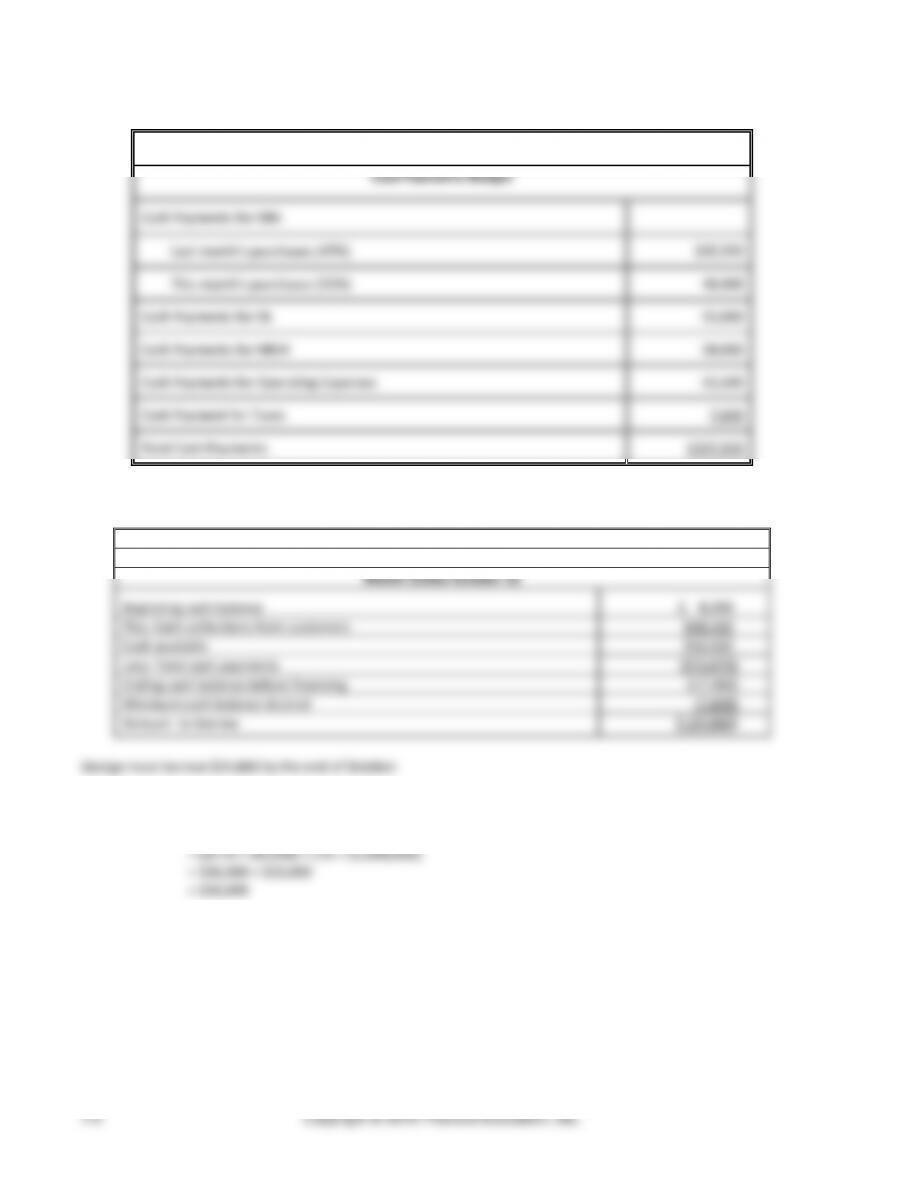
(5 min.) S9-11
Stately Corporation
Cash Payments Budget
Cash Payments for DM:
Last month’s purchases (45%)
$35,550
This month’s purchases (55%)
48,400
Cash Payments for DL
35,000
Cash Payments for MOH
38,000
Cash Payments for Operating Expenses
42,600
Cash Payment for Taxes
7,600
Total Cash Payments
$207,150
(5-10 min.) S9-12
George Services, Inc.
Cash Budget
Month Ended October 31
Beginning cash balance
$ 8,200
Plus: Cash collections from customers
548,410
Cash available
556,610
Less: Total cash payments
(573,870)
Ending cash balance before financing
(17,260)
Minimum cash balance desired
(7,600)
Amount to borrow
$ (24,860)
George must borrow $24,860 by the end of October.
(5 min.) S9-13
Transaction fee = ($0.45 × number of transactions) + (1% × sales made with credit and debit cards)
Chapter 9 The Master Budget
(15 min.) S9-14
Req. 1
Techworks Company
Sales Budget
January
February
Total
Sales price per phone
$ 170.00
$ 200.00
Multiply by: Number of phones
× 4,200
× 3,800
Total sales
$714,000
$760,000
$1,474,000
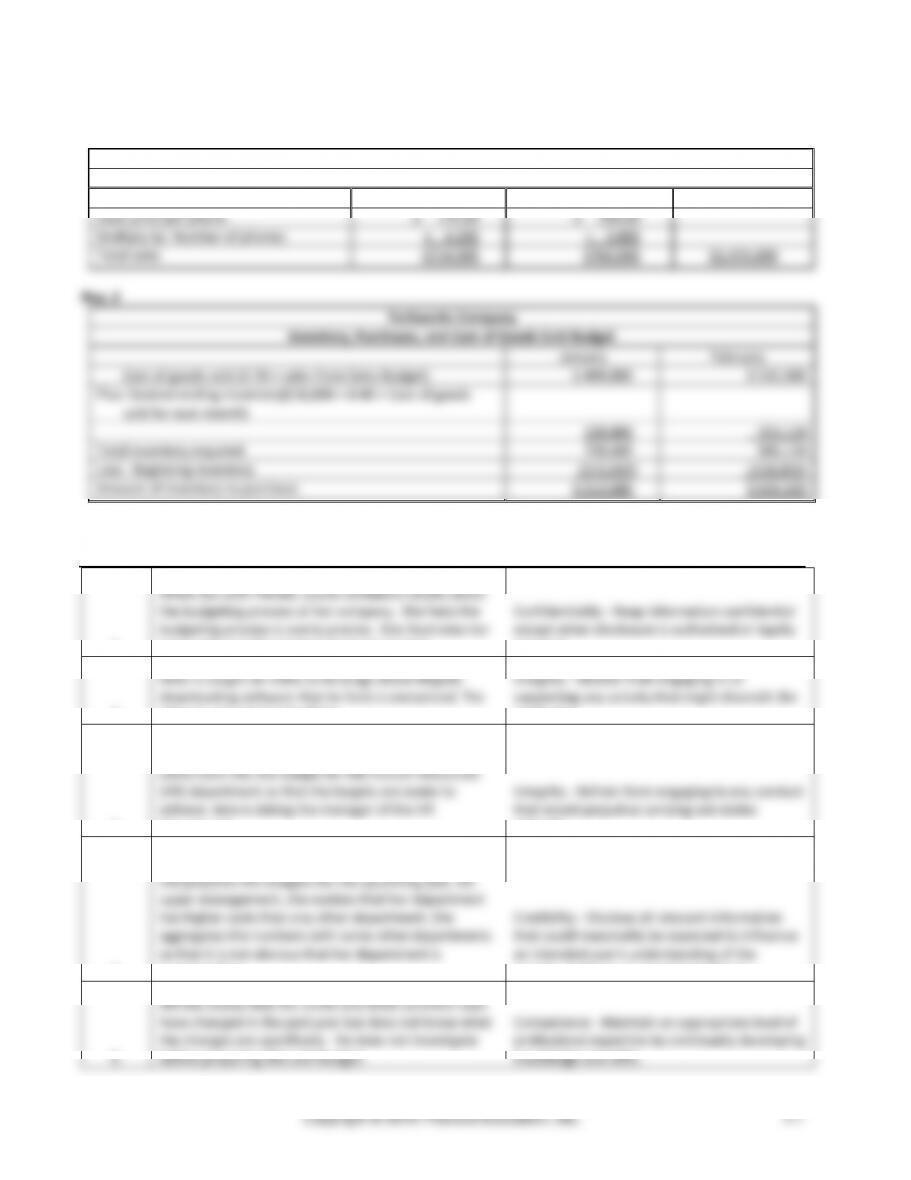
Req. 2
Techworks Company
Inventory, Purchases, and Cost of Goods Sold Budget
January
February
Cost of goods sold (0.70 × sales from Sales Budget)
$ 499,800
$ 532,000
Plus: Desired ending inventory($16,000 + 0.40 × Cost of goods
sold for next month)
228,800
353,120
Total inventory required
728,600
885,120
Less: Beginning inventory
(215,920)
(228,800)
Amount of inventory to purchase
$ 512,680
$ 656,320
(5-10 min.) S9-15
1.
When out with friends, Louise complains loudly about
the budgeting process at her company. She feels the
budgeting process is overly precise. She illustrates her
point with specific numbers from the budget.
Confidentiality – Keep information confidential
except when disclosure is authorized or legally
required.
2.
Allan is caught on video as he brags about illegally
downloading software that he feels is overpriced. The
video is uploaded to YouTube.
Integrity – Abstain from engaging in or
supporting any activity that might discredit the
profession.
3.
Jake, an accountant for Snow Films Company, builds
some slack into the budget for the Human Resources
(HR) department so that the targets are easier to
achieve. Jake is dating the manager of the HR
department.
Integrity – Refrain from engaging in any conduct
that would prejudice carrying out duties
ethically.
4.
Pearl is the controller for Cloudy Fork Gardens. When
she prepares the budgets for the upcoming year, for
upper management, she realizes that her department
has higher costs than any other department. She
aggregates the numbers with some other departments
so that it is not obvious that her department is
overspending.
Credibility – Disclose all relevant information
that could reasonably be expected to influence
an intended user’s understanding of the
reports, analyses, or recommendations.
5.
Alfredo knows that the credit and debit card fees laws
have changed in the past year but does not know what
the changes are specifically. He does not investigate
before preparing the cash budget.
Competence – Maintain an appropriate level of
professional expertise by continually developing
knowledge and skills.
Managerial Accounting 4e Solutions Manual
Exercises (Group A)
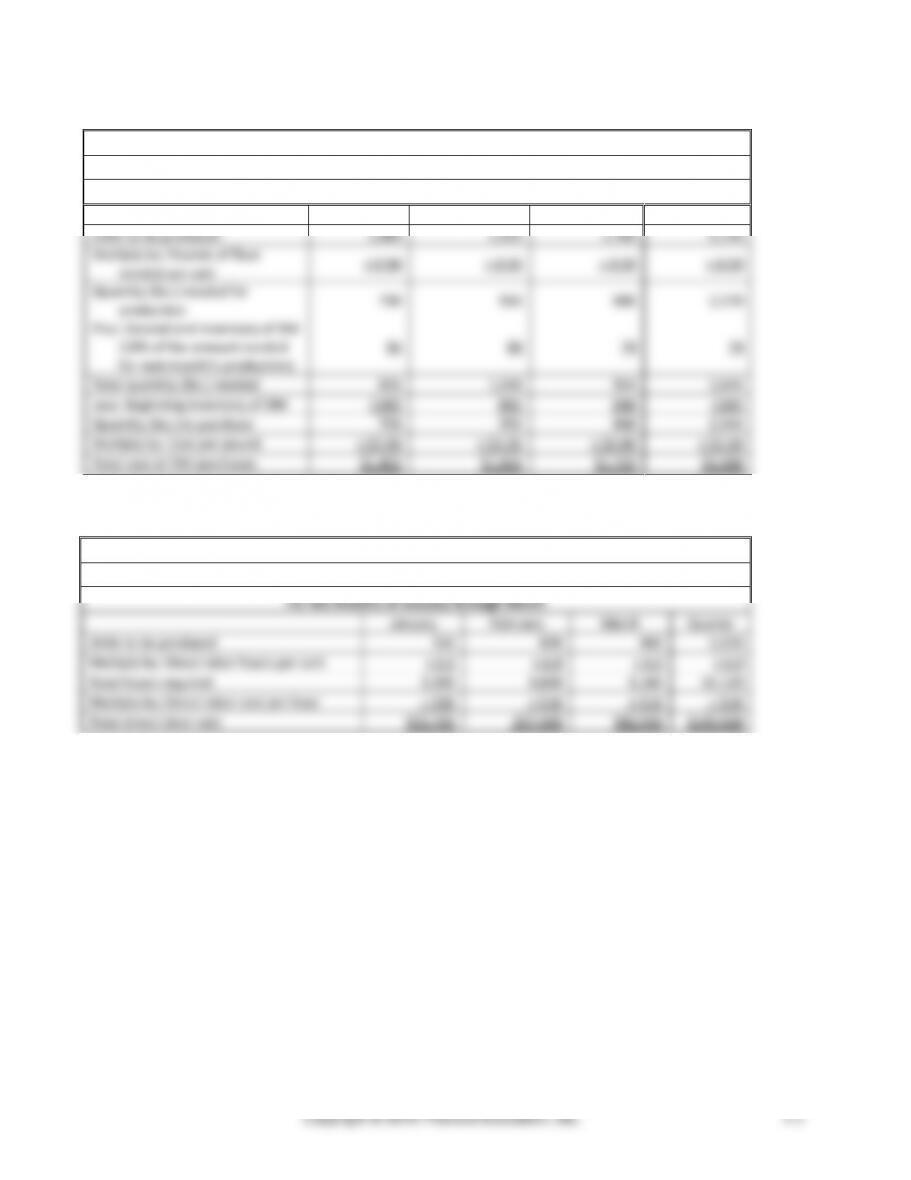
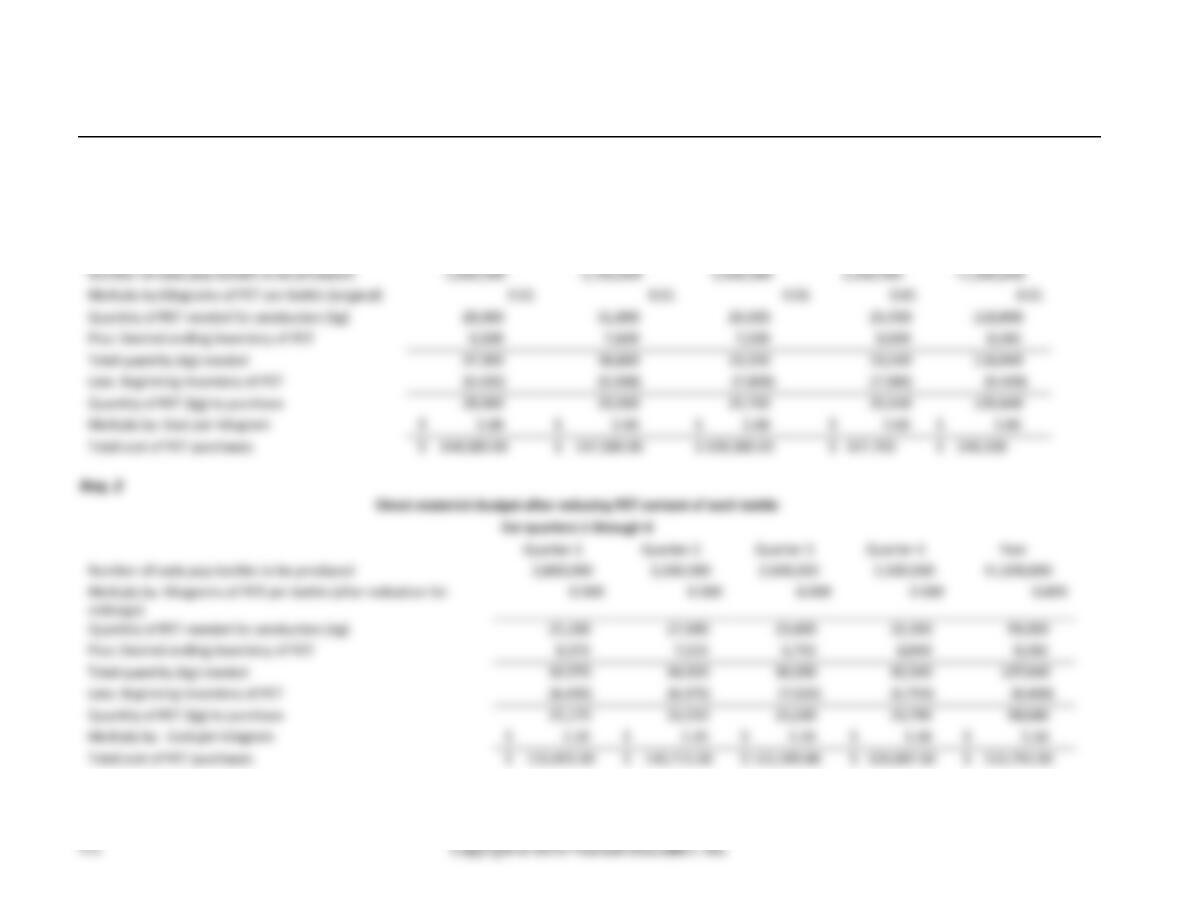
(15 min.) E9-16A
Req. 1
Direct materials budget before any changes
For quarters 1 through 4
Quarter 1
Quarter 2
Quarter 3
Quarter 4
Year
Number of soda pop bottles to be produced
2,800,000
3,100,000
2,600,000
2,500,000
11,000,000
Multiply by:Kilograms of PET per bottle (original)
0.01
0.01
0.01
0.01
0.01
Quantity of PET needed for production (kg)
28,000
31,000
26,000
25,000
110,000
Plus: Desired ending inventory of PET
9,300
7,800
7,500
8,040
8,040
Total quantity (kg) needed
37,300
38,800
33,500
33,040
118,040
Less: Beginning inventory of PET
(8,400)
(9,300)
(7,800)
(7,500)
(8,400)
Quantity of PET (kg) to purchase
28,900
29,500
25,700
25,540
109,640
Multiply by: Cost per kilogram
$ 5.00
$ 5.00
$ 5.00
$ 5.00
$ 5.00
Total cost of PET purchases
$ 144,500.00
$ 147,500.00
$ 128,500.00
$ 127,700
$ 548,200
Req. 2
Direct materials budget after reducing PET content of each bottle
For quarters 1 through 4
Quarter 1
Quarter 2
Quarter 3
Quarter 4
Year
Number of soda pop bottles to be produced
2,800,000
3,100,000
2,600,000
2,500,000
11,000,000
Multiply by: Kilograms of PET per bottle (after reduction for
redesign)
0.009
0.009
0.009
0.009
0.009
Quantity of PET needed for production (kg)
25,200
27,900
23,400
22,500
99,000
Plus: Desired ending inventory of PET
8,370
7,020
6,750
8,040
8,040
Total quantity (kg) needed
33,570
34,920
30,150
30,540
107,040
Less: Beginning inventory of PET
(8,400)
(8,370)
(7,020)
(6,750)
(8,400)
Quantity of PET (kg) to purchase
25,170
26,550
23,130
23,790
98,640
Multiply by: Cost per kilogram
$ 5.30
$ 5.30
$ 5.30
$ 5.30
$ 5.30
Total cost of PET purchases
$ 133,401.00
$ 140,715.00
$ 122,589.00
$ 126,087.00
$ 522,792.00
Chapter 9 The Master Budget
(continued) E9-16A
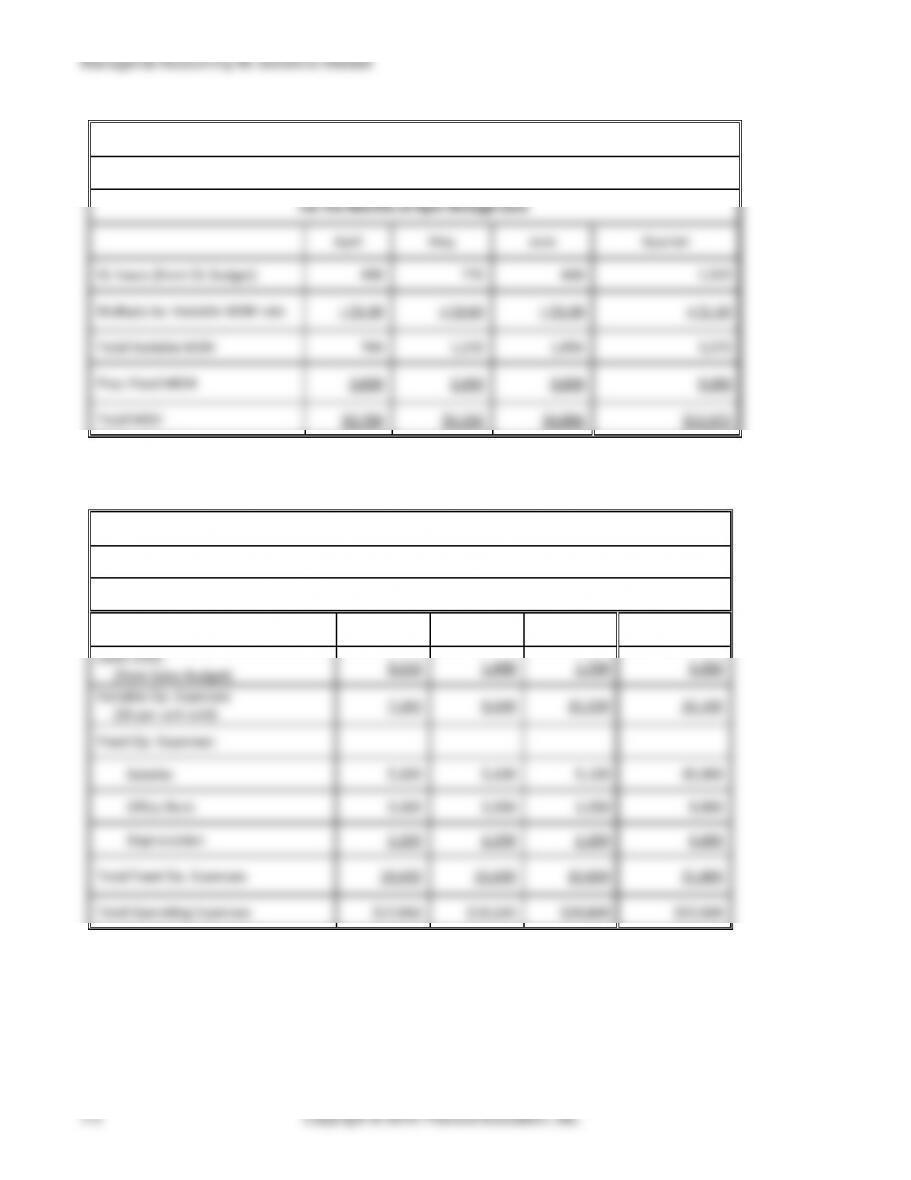
Req. 3
Quarter 1
Quarter 2
Quarter 3
Quarter 4
Year
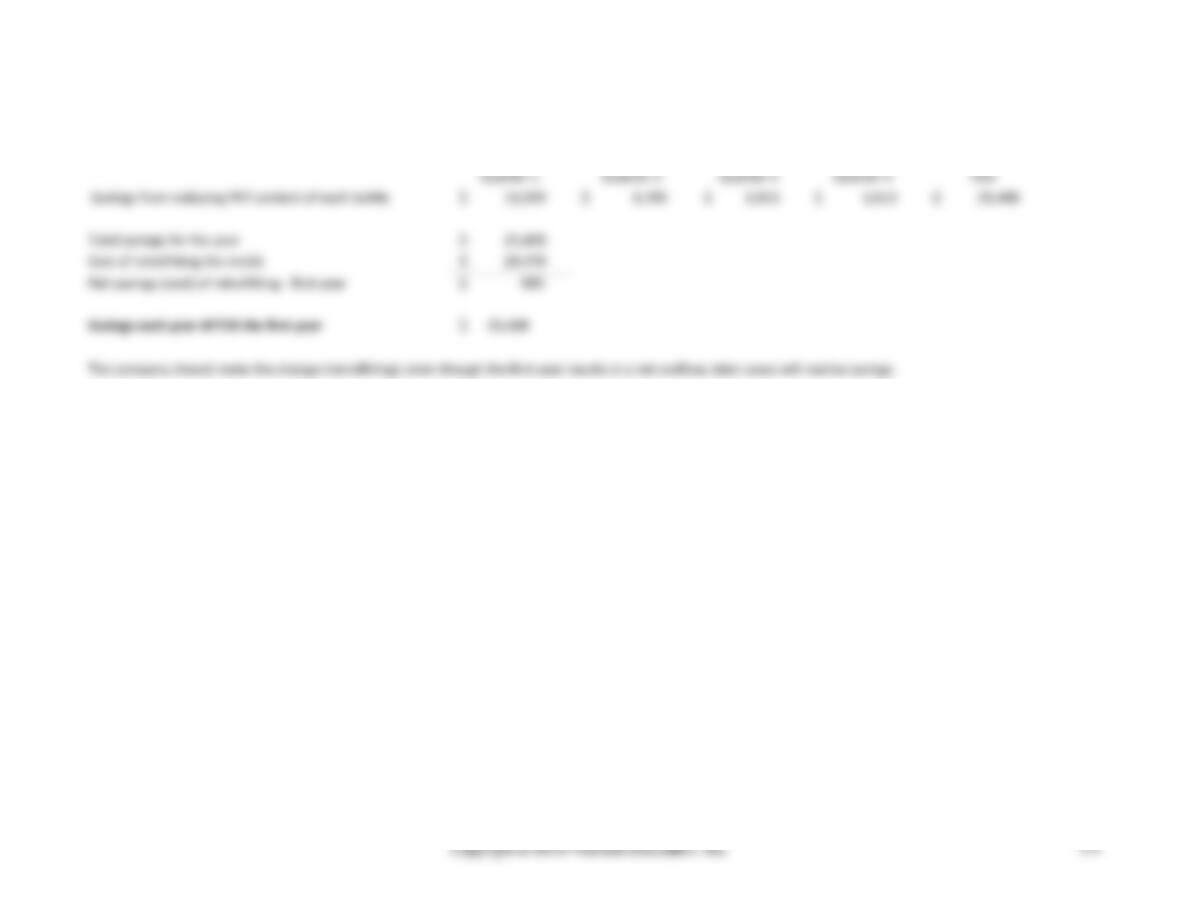
Savings from reducing PET content of each bottle
$ 11,099
$ 6,785
$ 5,911
$ 1,613
$ 25,408
Total savings for the year
$ 25,408
Cost of retrofitting the molds
$ 24,478
Net savings (cost) of retrofitting – first year
$ 930
Savings each year AFTER the first year
$ 25,408
The company should make the change (retrofitting); even though the first year results in a net outflow, later years will realize savings.
(5 min.) E9-17A
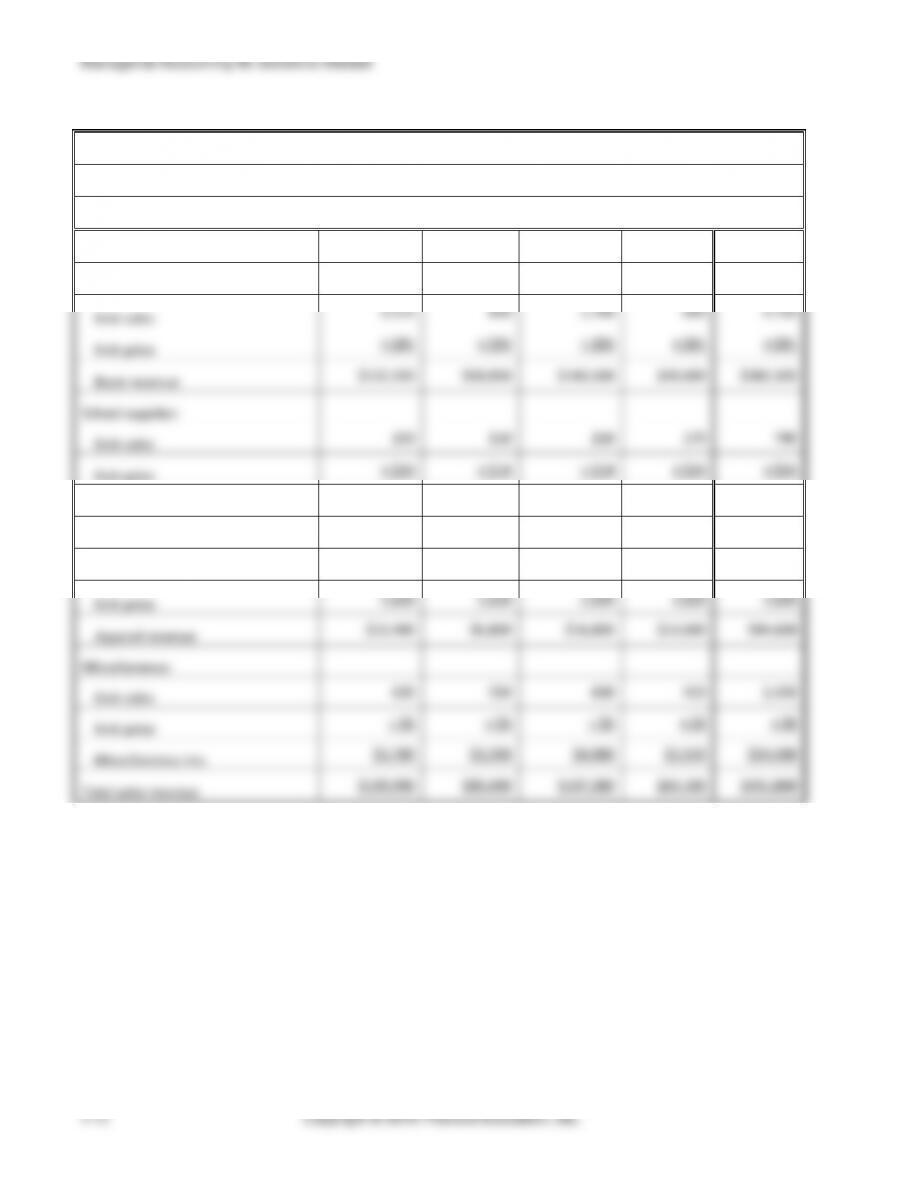
Miami College Bookstore
Sales Budget
For the Upcoming Year
Q1
Q2
Q3
Q4
Year
Books:
Unit sales
1,510
850
1,760
600
4,720
Unit price
× $81
× $81
× $81
× $81
× $81
Book revenue
$122,310
$68,850
$142,560
$48,600
$382,320
School supplies:
Unit sales
250
110
210
170
740
Unit price
× $14
× $14
× $14
× $14
× $14
School supplies rev.
$3,500
$1,540
$2,940
$2,380
$10,360
Apparel:
Unit sales
520
340
840
530
2,230
Unit price
× $20
× $20
× $20
× $20
× $20
Apparel revenue
$10,400
$6,800
$16,800
$10,600
$44,600
Miscellaneous:
Unit sales
630
550
830
420
2,430
Unit price
× $6
× $6
× $6
× $6
× $6
Miscellaneous rev.
$3,780
$3,300
$4,980
$2,520
$14,580
Total sales revenue
$139,990
$80,490
$167,280
$64,100
$451,860
Chapter 9 The Master Budget
(10-20 min.) E9-18A
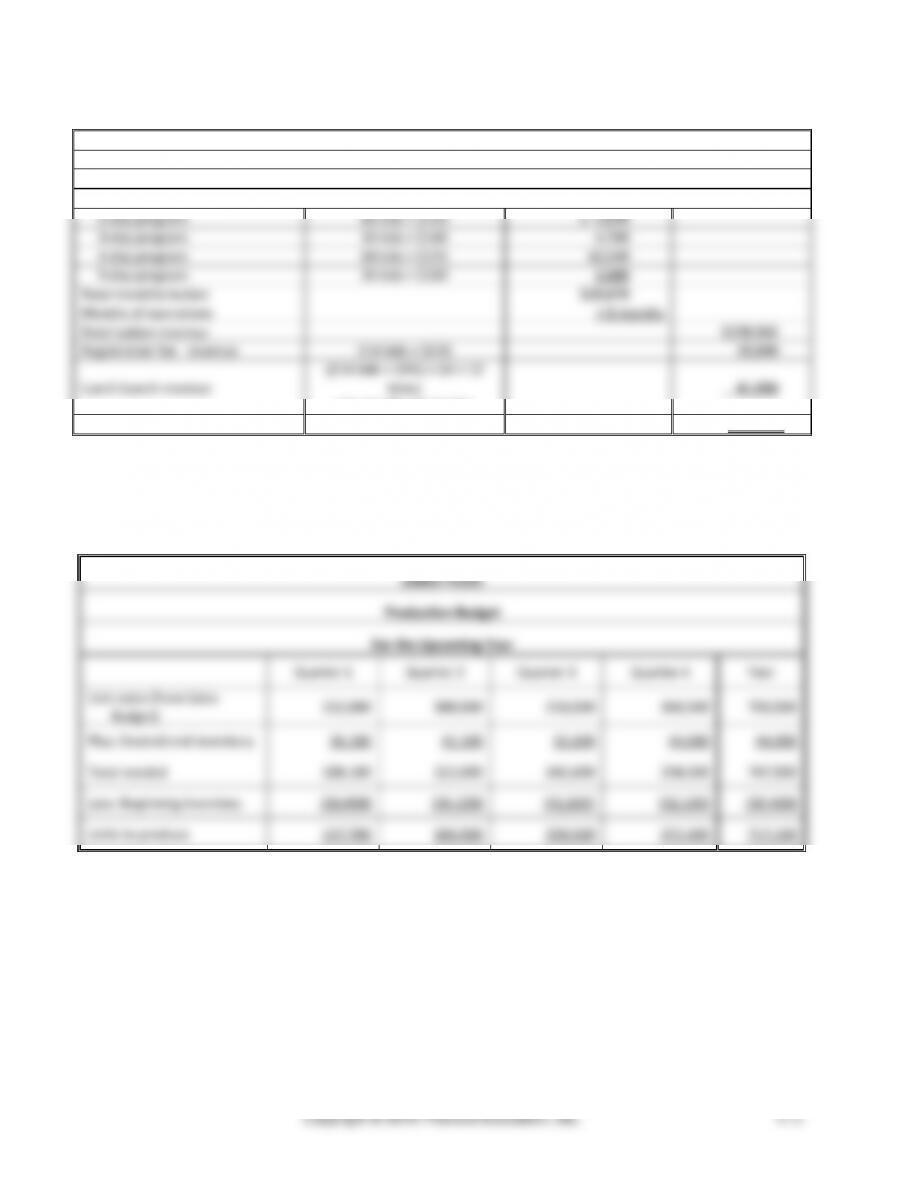
Hinckley Preschool
Budgeted Revenue
For Year Ended XXXX
Monthly tuition revenue:
2-day program
86 kids × $115
$ 9,890
3-day program
34 kids × $140
4,760
4-day program
68 kids × $155
10,540
5-day program
26 kids × $180
4,680
Total monthly tuition
$29,870
Months of operations
× 8 months
Total tuition revenue
$238,960
Registration fee revenue
214 kids × $135
28,890
Lunch bunch revenue
(214 kids × 50%) × $4 × 12
times
per month × 8 months
41,088
Total Revenue
$308,938
Note: Students may have shown yearly tuition by age group, rather than finding monthly tuition and then multiplying
it by the nine months of operations. Nonetheless, total tuition revenue for the year should be the same as that shown.
(5 min.) E9-19A
Jabber Foods
Production Budget
For the Upcoming Year
Quarter 1
Quarter 2
Quarter 3
Quarter 4
Year
Unit sales (from Sales
Budget)
152,000
180,500
210,500
160,500
703,500
Plus: Desired end inventory
36,100
42,100
32,100
44,000
44,000
Total needed
188,100
222,600
242,600
204,500
747,500
Less: Beginning inventory
(30,400)
(36,100)
(42,100)
(32,100)
(30,400)
Units to produce
157,700
186,500
200,500
172,400
717,100
(5 min.) E9-20A
Beckett Industries
Direct Materials Budget
For the Months of January through March
January
February
March
Quarter
Units to be produced (from Production Budget)
5,600
4,200
4,800
14,600
Multiply by: Quantity of DM needed per unit
× 2
× 2
× 2
× 2
Quantity needed for production
11,200
8,400
9,600
29,200
Plus: Desired end inventory of DM
2,100
2,400
2,250
2,250
Total quantity needed
13,300
10,800
11,850
31,450
Less: Beginning Inventory of DM
(2,800)
(2,100)
(2,400)
(2,800)
Quantity to purchase
10,500
8,700
9,450
28,650
Multiply by: Cost per chip
× $3.00
× $3.00
× $3.00
× $3.00
Total cost of DM purchases
$31,500
$26,100
$28,350
$85,950
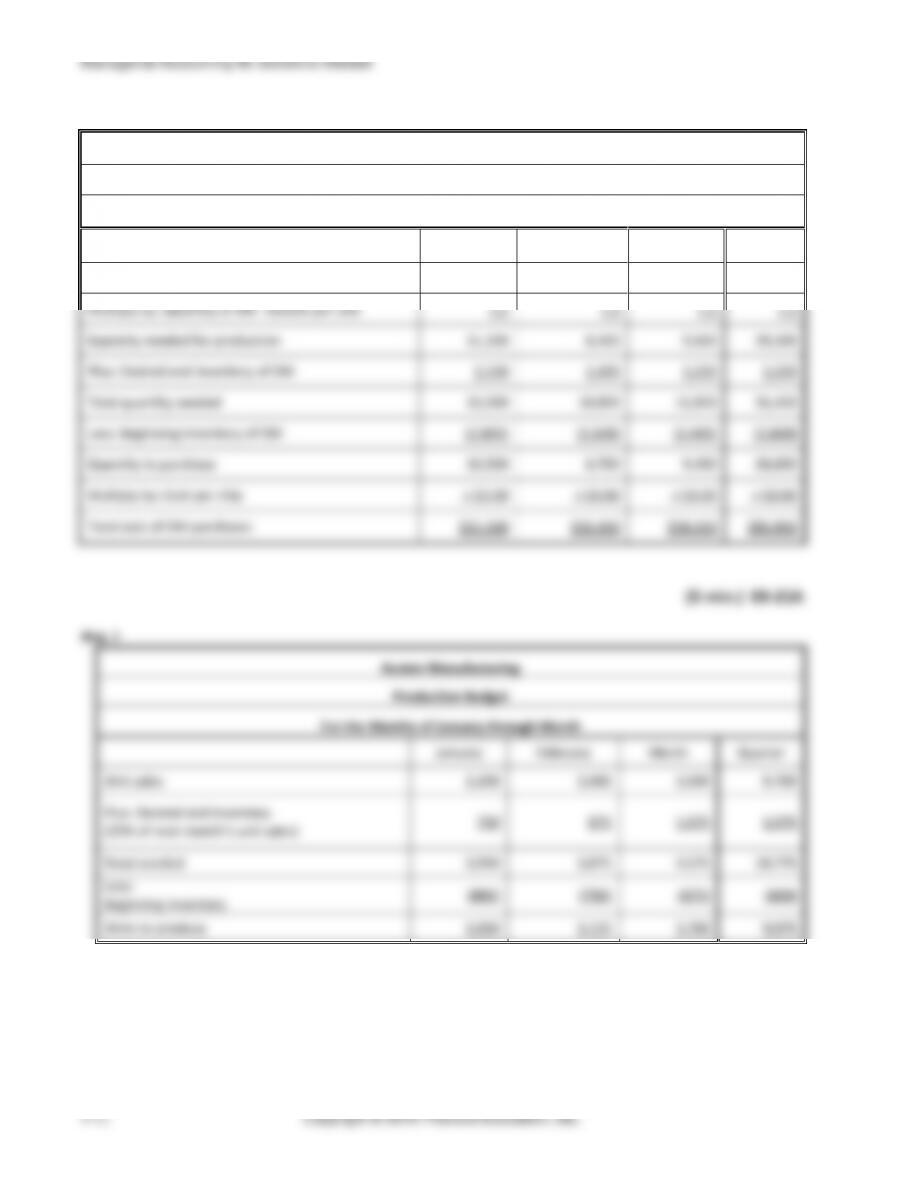
(5 min.) E9-21A
Req. 1
Austen Manufacturing
Production Budget
For the Months of January through March
January
February
March
Quarter
Unit sales
3,200
3,000
3,500
9,700
Plus: Desired end inventory
(25% of next month’s unit sales)
750
875
1,075
1,075
Total needed
3,950
3,875
4,575
10,775
Less:
Beginning inventory
(800)
(750)
(875)
(800)
Units to produce
3,150
3,125
3,700
9,975
Chapter 9 The Master Budget
(continued) E9-21A
Req. 2
Austen Manufacturing
Direct Materials Budget
For the Months of January through March
January
February
March
Quarter
Units to be produced
(from Production Budget)
3,150
3,125
3,700
9,975
Multiply by: Quantity (lbs.) of DM needed per unit
× 2
× 2
× 2
× 2
Quantity (lbs.) needed for production
6,300
6,250
7,400
19,950
Plus: Desired End Inventory of DM (20% of the
amount needed for next month’s
production)
1,250
1,480
1,750
1,750
Total Quantity (lbs.) Needed
7,550
7,730
9,150
21,700
Less: Beginning Inventory of DM
(1,260)
(1,250)
(1,480)
(1,260)
Quantity (lbs.) to purchase
6,290
6,480
7,670
20,440
Multiply by: Cost per pound
× $0.10
× $0.10
× $0.10
× $0.10
Total Cost of DM purchases
$629
$648
$767
$2,044
Managerial Accounting 4e Solutions Manual
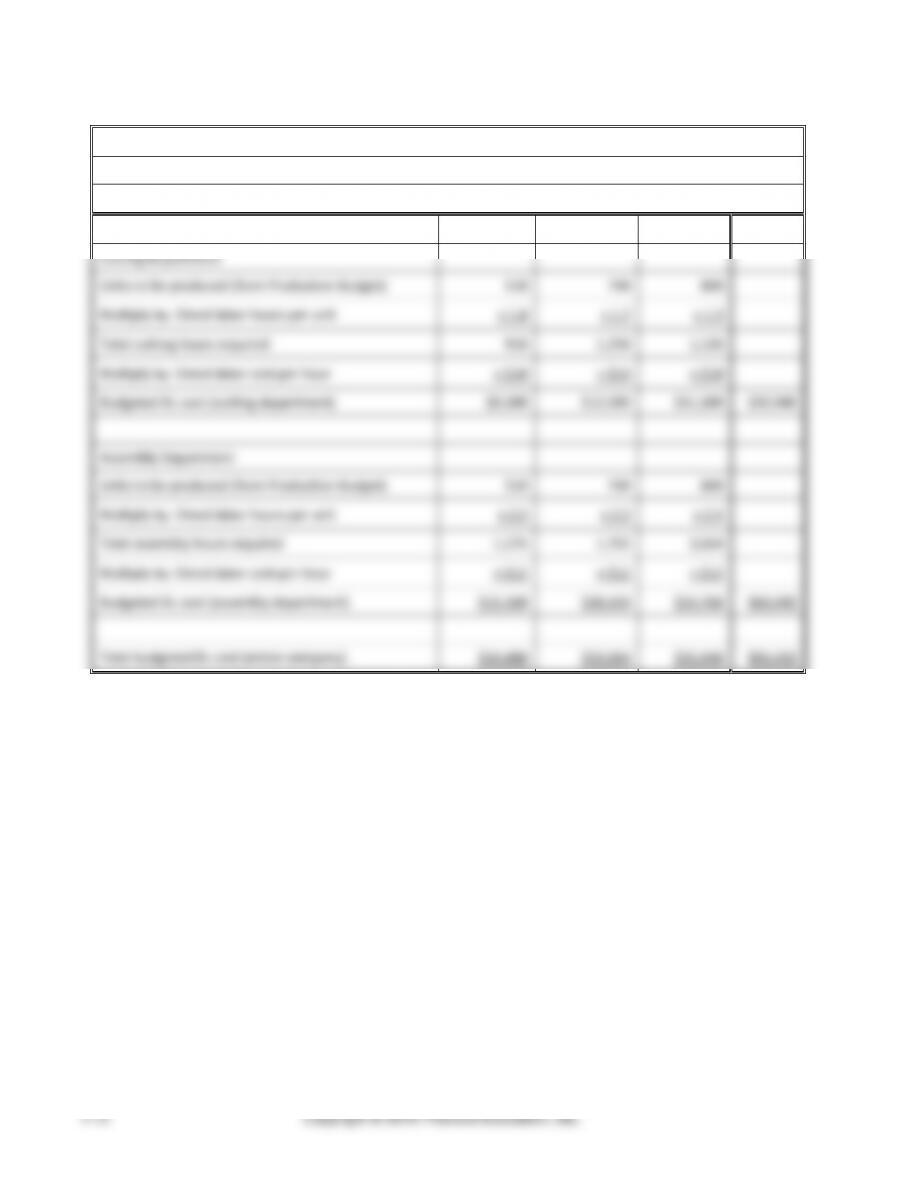
(5 min.) E9-22A
Anderson Industries
Direct Labor Budget
For the Upcoming Year
Rockets
Imperials
Zooms
Total
Cutting Department
Units to be produced (from Production Budget)
510
740
860
Multiply by: Direct labor hours per unit
× 1.8
× 1.7
× 1.3
Total cutting hours required
918
1,258
1,118
Multiply by: Direct labor cost per hour
× $10
× $10
× $10
Budgeted DL cost (cutting department)
$9,180
$12,580
$11,180
$32,940
Assembly Department
Units to be produced (from Production Budget)
510
740
860
Multiply by: Direct labor hours per unit
× 2.5
× 2.3
× 2.4
Total assembly hours required
1,275
1,702
2,064
Multiply by: Direct labor cost per hour
× $12
× $12
× $12
Budgeted DL cost (assembly department)
$15,300
$20,424
$24,768
$60,492
Total budgeted DL cost (entire company)
$24,480
$33,004
$35,948
$93,432
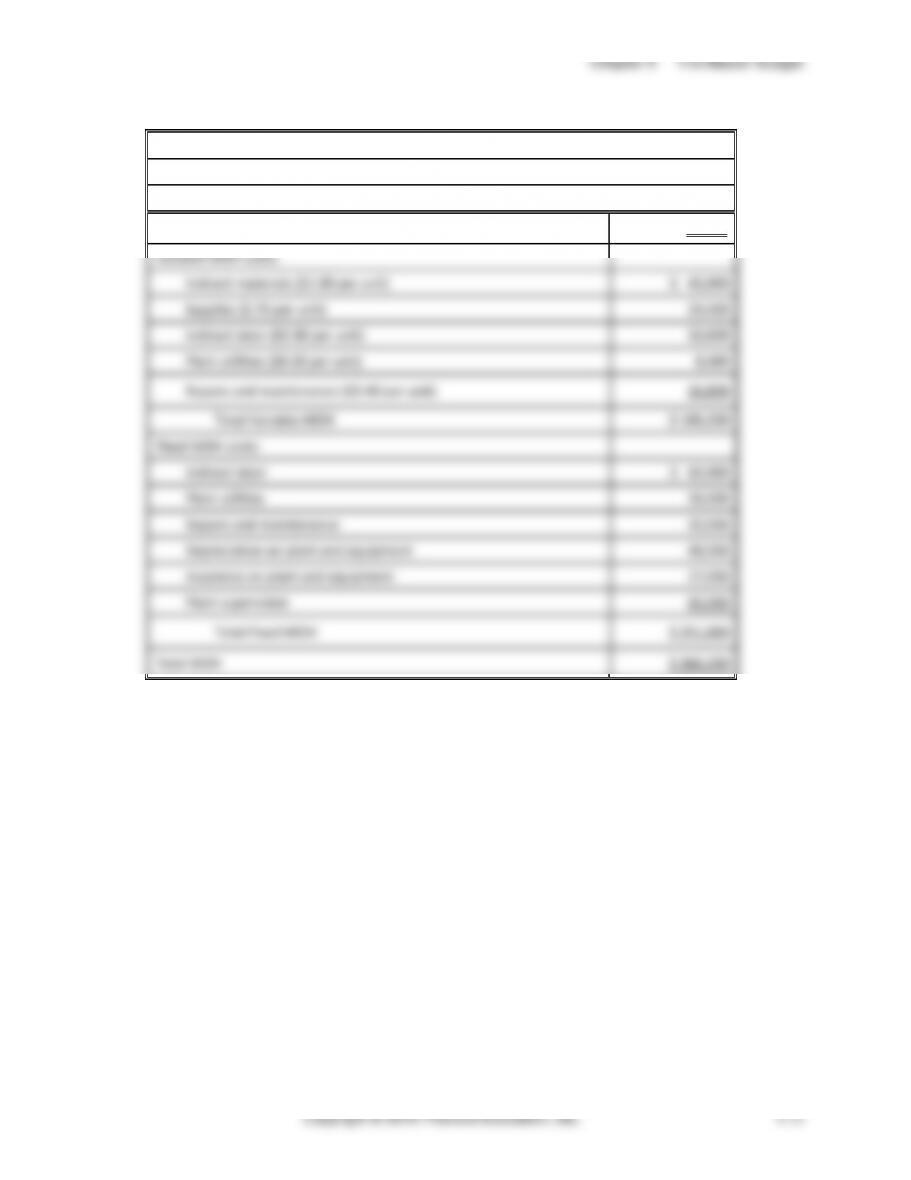
(15 min.) E9-23A
The Mcknight Company
Manufacturing Overhead Budget
For the Upcoming Year
Projected Sales (from Sales Budget)
42,000
Variable MOH costs:
Indirect materials ($1.00 per unit)
$ 42,000
Supplies ($.70 per unit)
29,400
Indirect labor ($0.30 per unit)
12,600
Plant utilities ($0.20 per unit)
8,400
Repairs and maintenance ($0.40 per unit)
16,800
Total Variable MOH
$ 109,200
Fixed MOH costs:
Indirect labor
$ 62,000
Plant utilities
39,000
Repairs and maintenance
10,000
Depreciation on plant and equipment
48,000
Insurance on plant and equipment
27,000
Plant supervision
65,000
Total Fixed MOH
$ 251,000
Total MOH
$ 360,200
Managerial Accounting 4e Solutions Manual
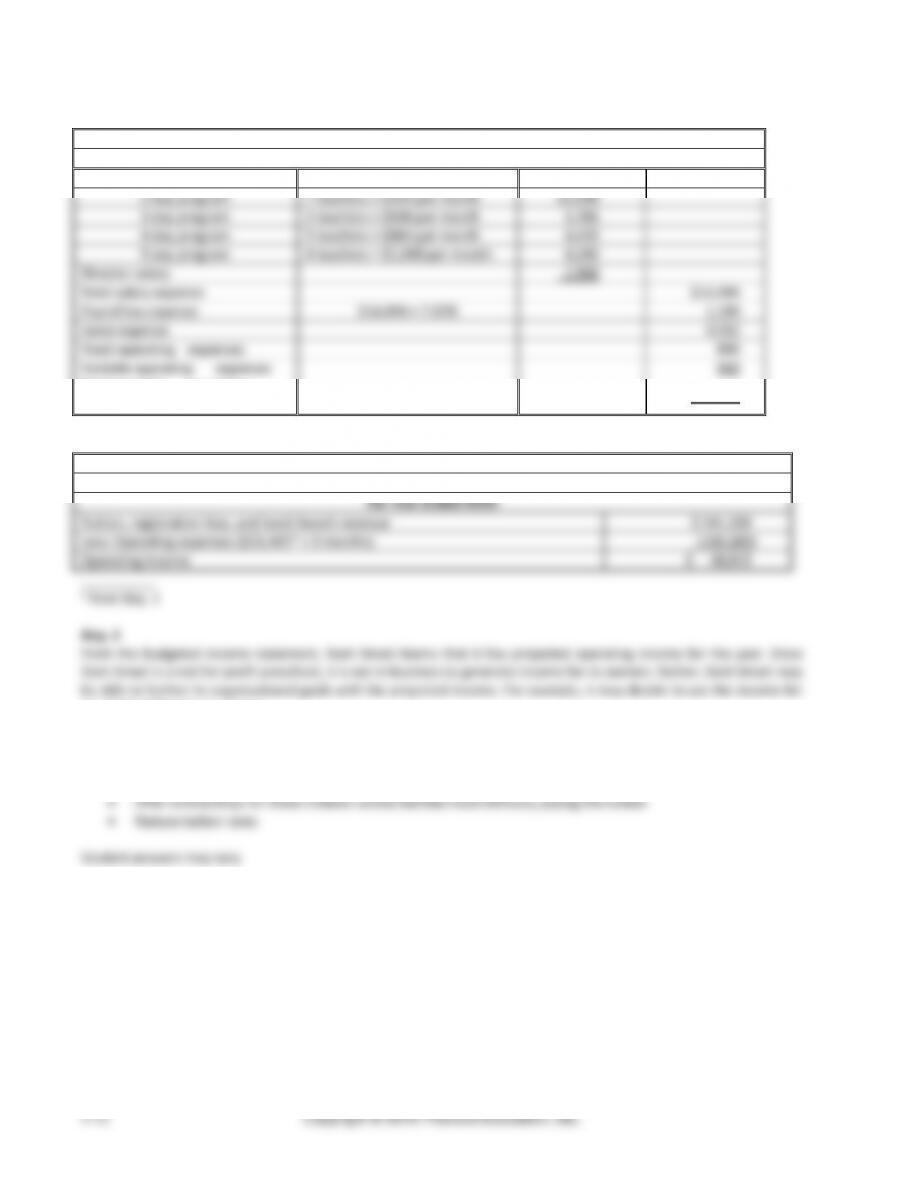
(20-30 min.) E9-24A
Req. 1
Start Smart Preschool
Budgeted Monthly Operating Expenses
Teachers’ salary:
2-day program
7 teachers × $434 per month
$3,038
3-day program
2 teachers × $648 per month
1,296
4-day program
5 teachers × $884 per month
4,420
5-day program
4 teachers × $1,060 per month
4,240
Director salary
1,500
Total salary expense
$14,494
Payroll tax expense
$14,494 × 7.65%
1,109
Lease expense
4,012
Fixed operating expenses
890
Variable operating expenses
960
Total monthly operating
expenses
$21,465
Req. 2
Start Smart Preschool
Budgeted Income Statement
For Year Ended XXXX
Tuition, registration fees, and lunch bunch revenue
$ 241,200
Less: Operating expenses ($21,465* × 9 months)
(193,185)
Operating income
$ 48,015
__________
a from Req. 1
Req. 3
From the budgeted income statement, Start Smart learns that it has projected operating income for the year. Since
Start Smart is a not-for-profit preschool, it is not in business to generate income for its owners. Rather, Start Smart may
be able to further its organizational goals with the projected income. For example, it may decide to use the income for
any of the following purposes:
• Invest in additional (or better) classroom equipment
• Invest in additional (or better) playground equipment
• Improve the current program (more crafts, books, better curriculum, special guest visitors, special programs,
field trips, etc.)
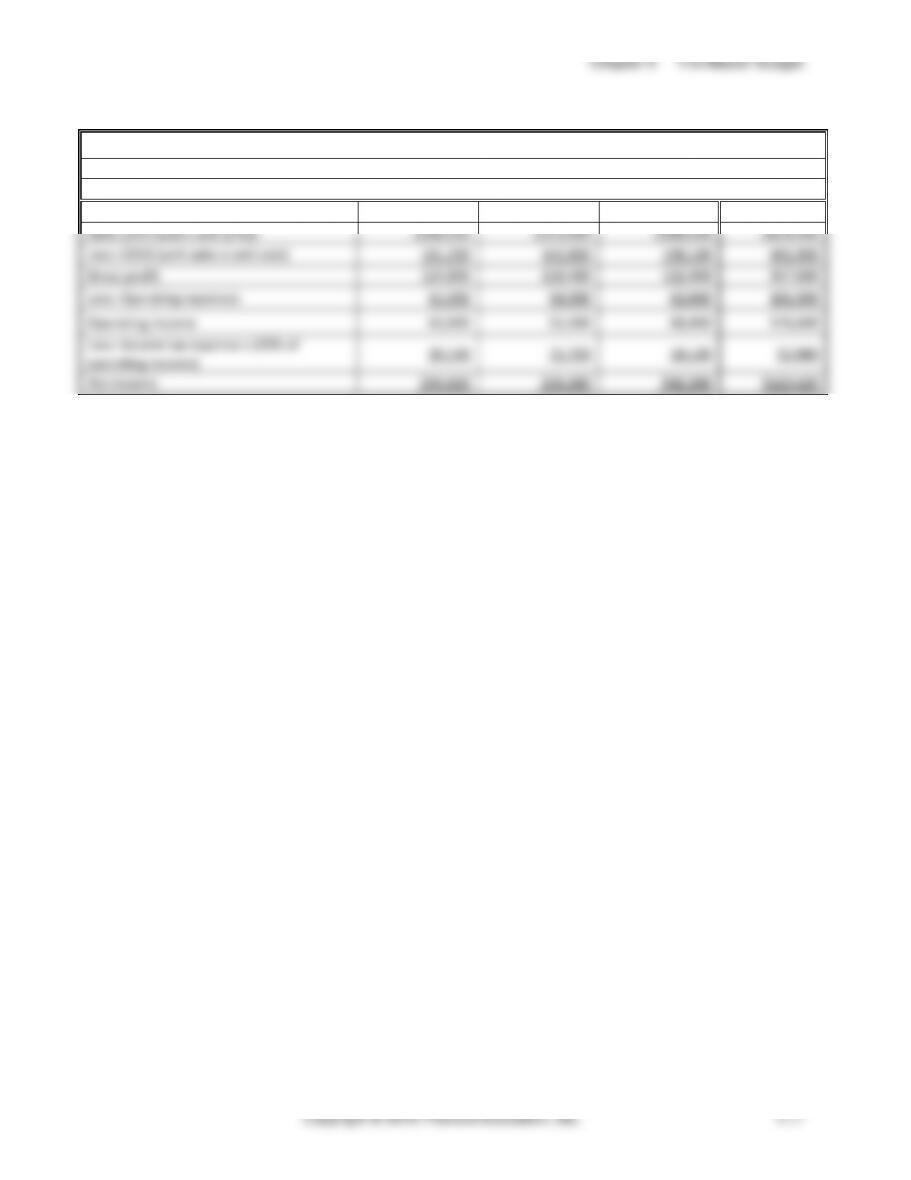
(5 min.) E9-25A
Germaine Labs
Budgeted Income Statement
For the Quarter Ended March 31
Jan.
Feb.
March
Quarter
Sales (unit sales x sale price)
$286,000
$253,000
$280,500
$819,500
Less: COGS (unit sales x unit cost)
161,200
142,600
158,100
461,900
Gross profit
124,800
110,400
122,400
357,600
Less: Operating expenses
61,000
58,000
62,000
181,000
Operating income
63,800
52,400
60,400
176,600
Less: Income tax expense s (30% of
operating income)
19,140
15,720
18,120
52,980
Net income
$44,660
$36,680
$42,280
$123,620
Managerial Accounting 4e Solutions Manual
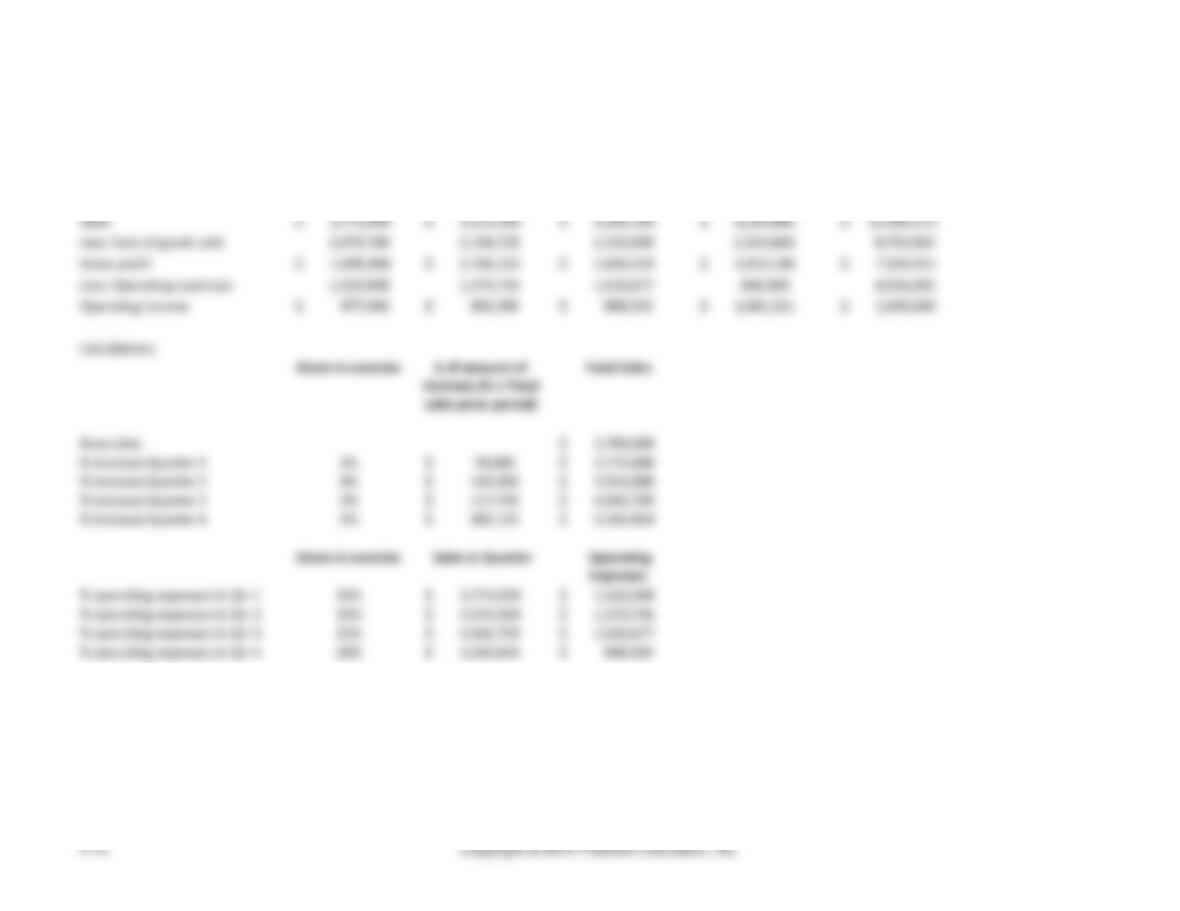
(15 min.) E9-26A
Berkner Motors
Budgeted Income Statement
For the Upcoming Year
Quarter 1
Quarter 2
Quarter 3
Quarter 4
Year
Sales
$ 3,774,000
$ 3,924,960
$ 4,042,709
$ 4,244,844
$ 15,986,513
Less: Cost of goods sold
2,075,700
2,158,728
2,223,490
2,334,664
8,792,582
Gross profit
$ 1,698,300
$ 1,766,232
$ 1,819,219
$ 1,910,180
$ 7,193,931
Less: Operating expenses
1,320,900
1,373,736
1,010,677
848,969
4,554,282
Operating Income
$ 377,400
$ 392,496
$ 808,542
$ 1,061,211
$ 2,639,649
Calculations:
Given in exercise
$ of amount of
increase (% x Total
sales prior period)
Total Sales
Base sales
$ 3,700,000
% increase Quarter 1
2%
$ 74,000
$ 3,774,000
% increase Quarter 2
4%
$ 150,960
$ 3,924,960
% increase Quarter 3
3%
$ 117,749
$ 4,042,709
% increase Quarter 4
5%
$ 202,135
$ 4,244,844
Given in exercise
Sales in Quarter
Operating
Expenses
% operating expenses in Qtr 1
35%
$ 3,774,000
$ 1,320,900
% operating expenses in Qtr 2
35%
$ 3,924,960
$ 1,373,736
% operating expenses in Qtr 3
25%
$ 4,042,709
$ 1,010,677
% operating expenses in Qtr 4
20%
$ 4,244,844
$ 848,969
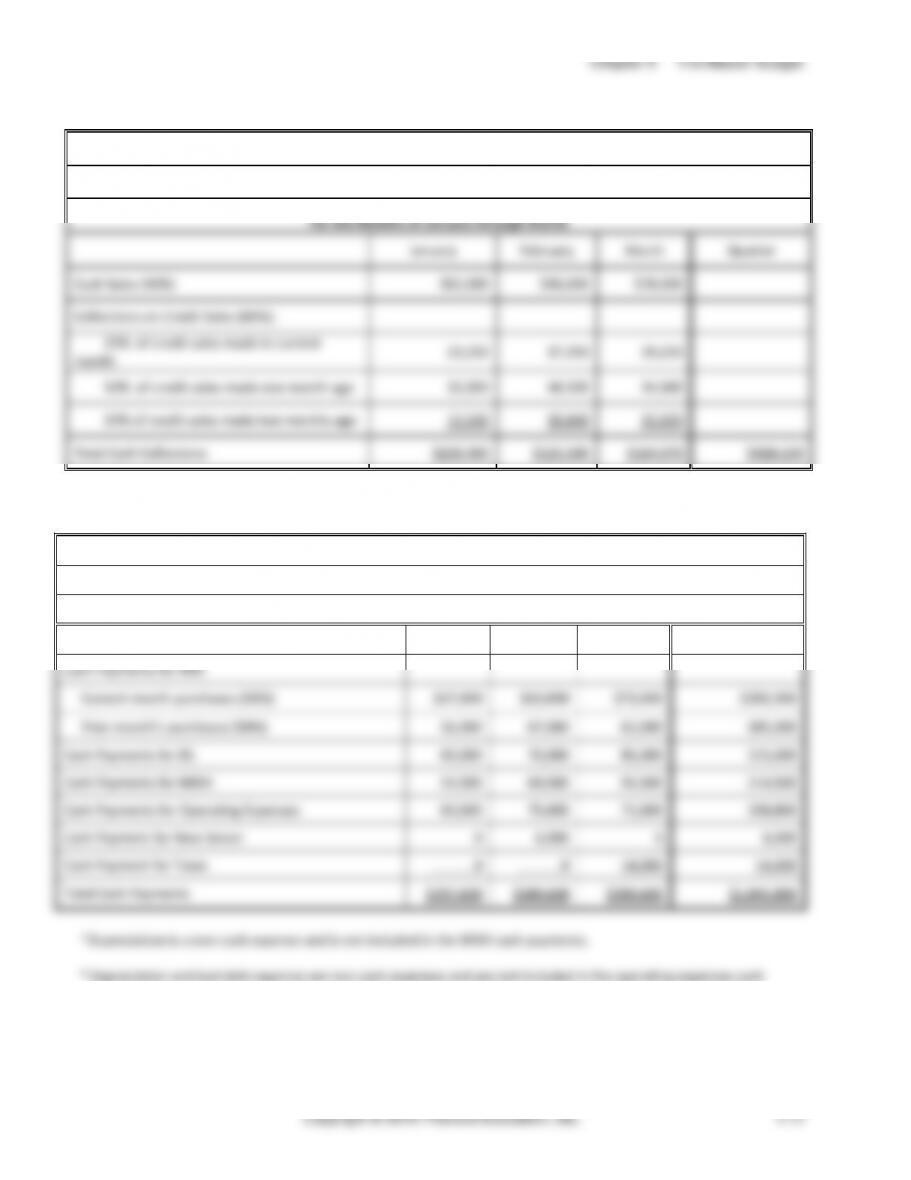
(5 min.) E9-27A
Bentfield Corporation
Cash Collections Budget
For the Months of January through March
January
February
March
Quarter
Cash Sales (40%)
$62,000
$46,000
$78,000
Collections on Credit Sales (60%):
25% of credit sales made in current
month
23,250
17,250
29,250
50% of credit sales made one month ago
33,000
46,500
34,500
24% of credit sales made two months ago
12,240
15,840
22,320
Total Cash Collections
$130,490
$125,590
$164,070
$420,150
(5 min.) E9-28A
The Smith Company
Cash Payments Budget
For the Months of April through June
April
May
June
Quarter
Cash Payments for DM:
Current month purchases (50%)
$67,000
$62,000
$73,500
$202,500
Prior month’s purchases (50%)
56,000
67,000
62,000
185,000
Cash Payments for DL
60,000
70,000
85,000
215,000
Cash Payments for MOH
54,000
69,000
91,500
214,500
Cash Payments for Operating Expenses
60,600
75,600
72,600
208,800
Cash Payment for New Server
0
6,000
0
6,000
Cash Payment for Taxes
0
0
14,000
14,000
Total Cash Payments
$297,600
$349,600
$398,600
$1,045,800
a Depreciation is a non-cash expense and is not included in the MOH cash payments.
b Depreciation and bad debt expense are non-cash expenses and are not included in the operating expenses cash
payments.
Managerial Accounting 4e Solutions Manual
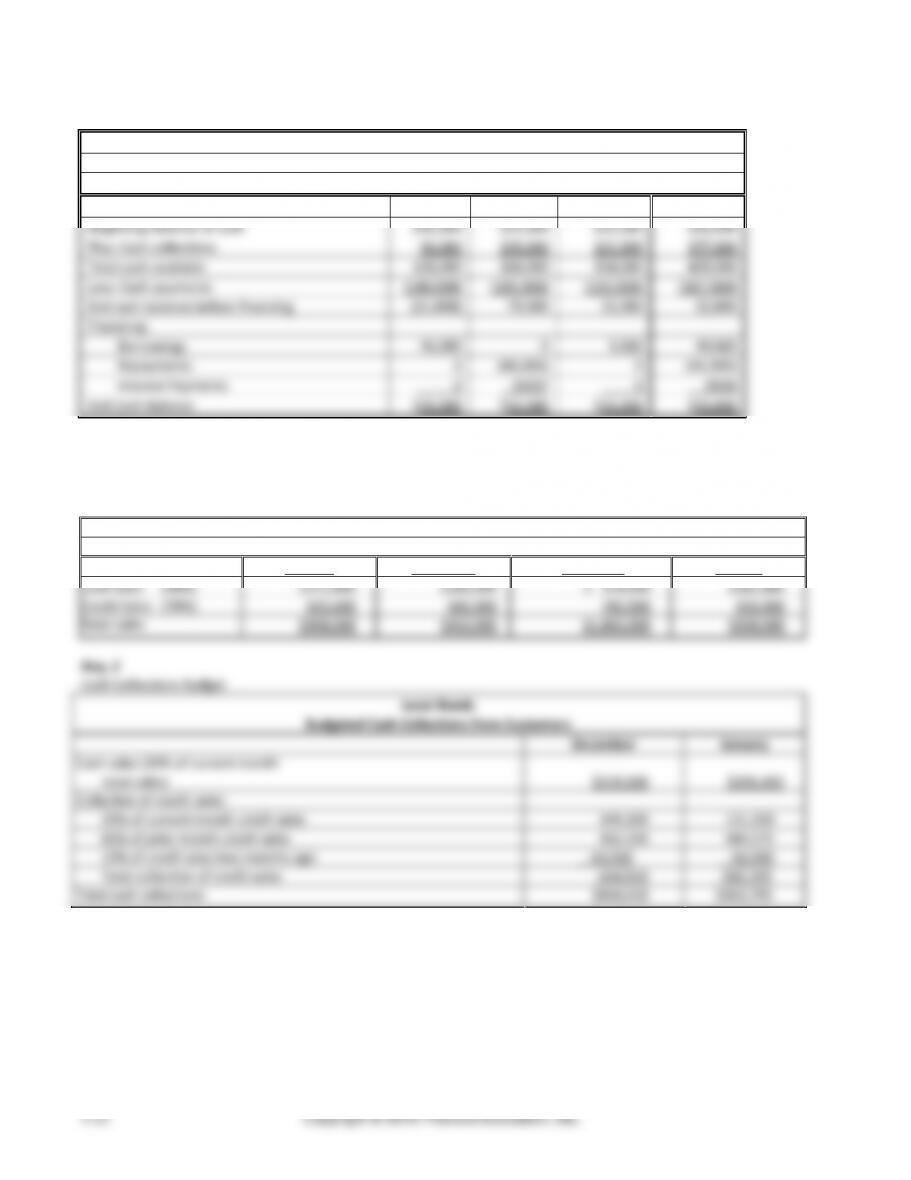
(5 min.) E9-29A
Monette Health Center
Combined Cash Budget
For the Months of July through September
July
August
Sept.
Quarter
Beginning balance of cash
$32,000
$25,000
$32,080
$32,000
Plus: Cash collections
96,000
159,000
122,000
377,000
Total cash available
128,000
184,000
154,080
409,000
Less: Cash payments
(149,000)
(105,000)
(133,000)
(387,000)
End cash balance before financing
(21,000)
79,000
21,080
22,000
Financing:
Borrowings
46,000
0
3,920
49,920
Repayments
0
(46,000)
0
(46,000)
Interest Payments
0
(920)a
0
(920)
End Cash Balance
$25,000
$32,080
$25,000
$25,000
(20-30 min.) E9-30A
Req. 1
Sales Budget
Leret Reeds
Sales Budget
October
November
December
January
Cash Sales (30%)
$272,400
$285,000
$ 319,500
$281,400
Credit Sales (70%)
635,600
665,000
745,500
656,600
Total sales
$908,000
$950,000
$1,065,000
$938,000
Req. 2
Cash Collections Budget
Leret Reeds
Budgeted Cash Collections from Customers
December
January
Cash sales (30% of current month
total sales)
$319,500
$281,400
Collection of credit sales:
20% of current month credit sales
149,100
131,320
65% of prior month credit sales
432,250
484,575
10% of credit sales two months ago
63,560
66,500
Total collection of credit sales
644,910
682,395
Total cash collections
$964,410
$963,795