Chapter 7 Cost-Volume-Profit Analysis
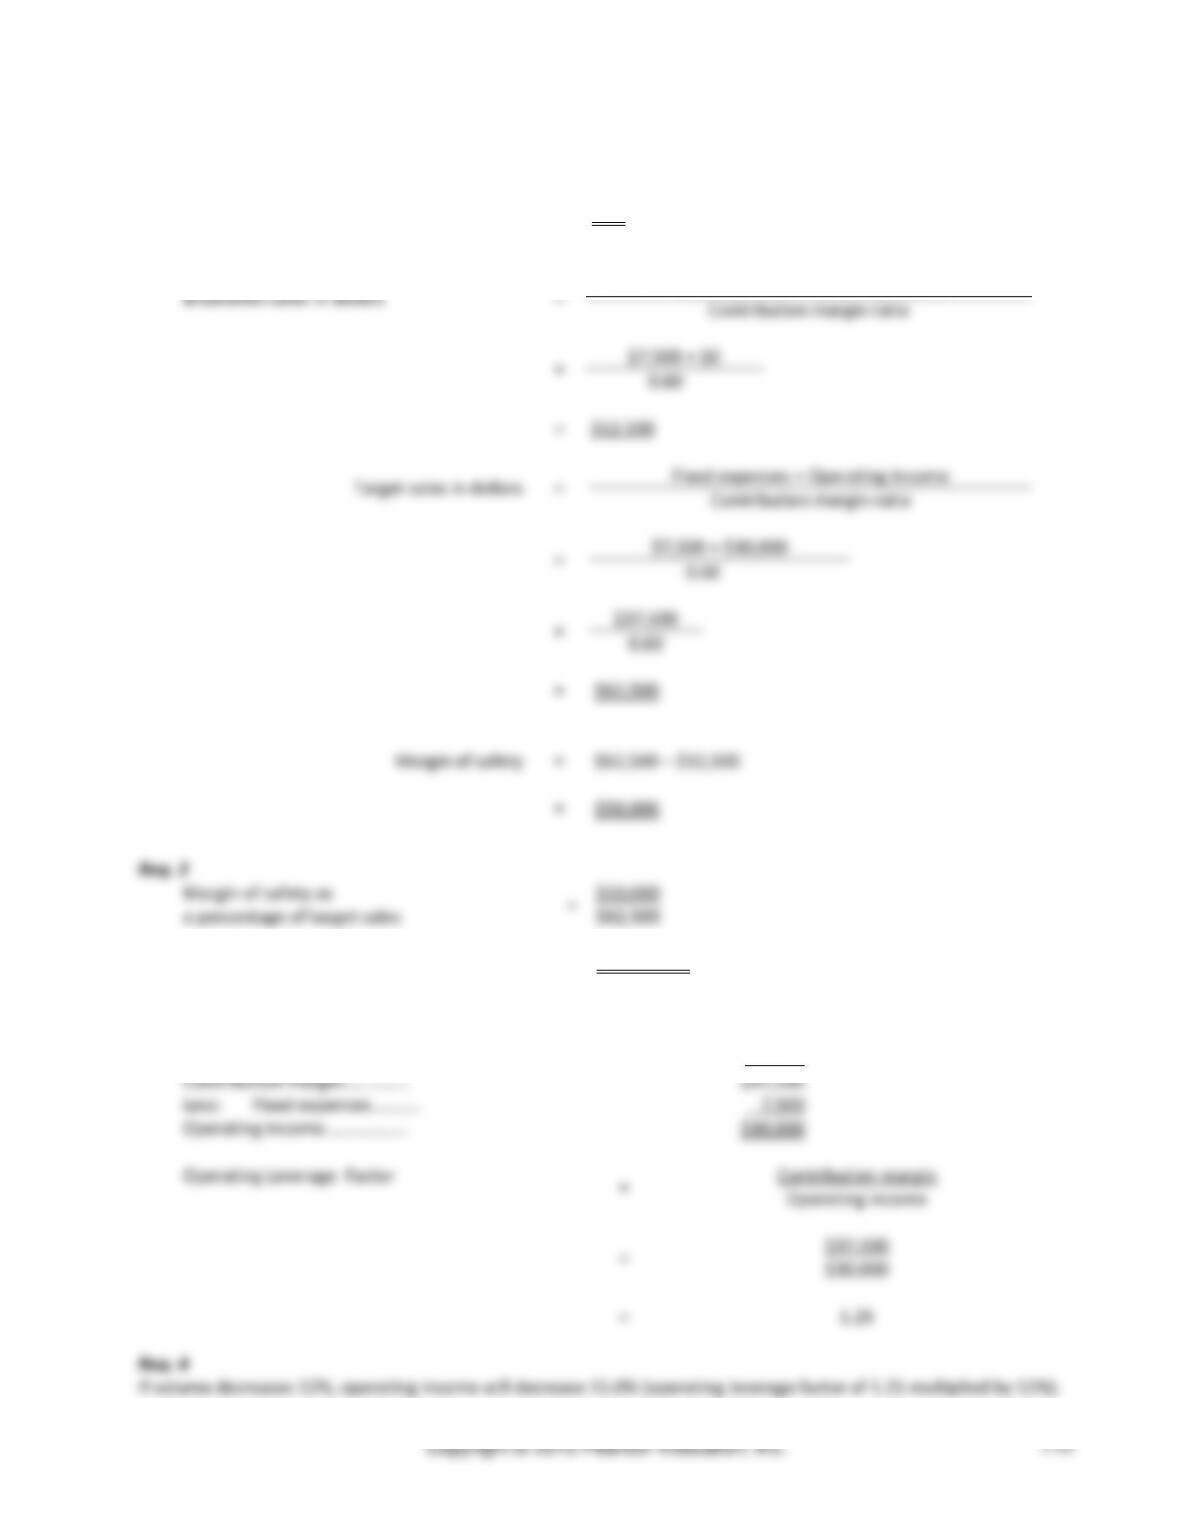
(15 min.) E7-53B
Req. 1
Contribution margin ratio
=
1.00 − 0.40
=
0.60
Breakeven sales in dollars
=
Fixed expenses + Operating income
Contribution margin ratio
=
$7,500 + $0
0.60
=
$12,500
$7,500 + $30,000
$62,500
$62,500 − $12,500
$50,000
=
Managerial Accounting 4e Solutions Manual
(10 min.) E7-54B
First, find the contribution margin:
Sales………………………………
$45,000
Contribution margin ratio……..
× .20
Contribution margin……………
$ 9,000
Contribution margin……..
$9,000
Less: Fixed expenses….
Unknown
Operating income………..
$ 5,625
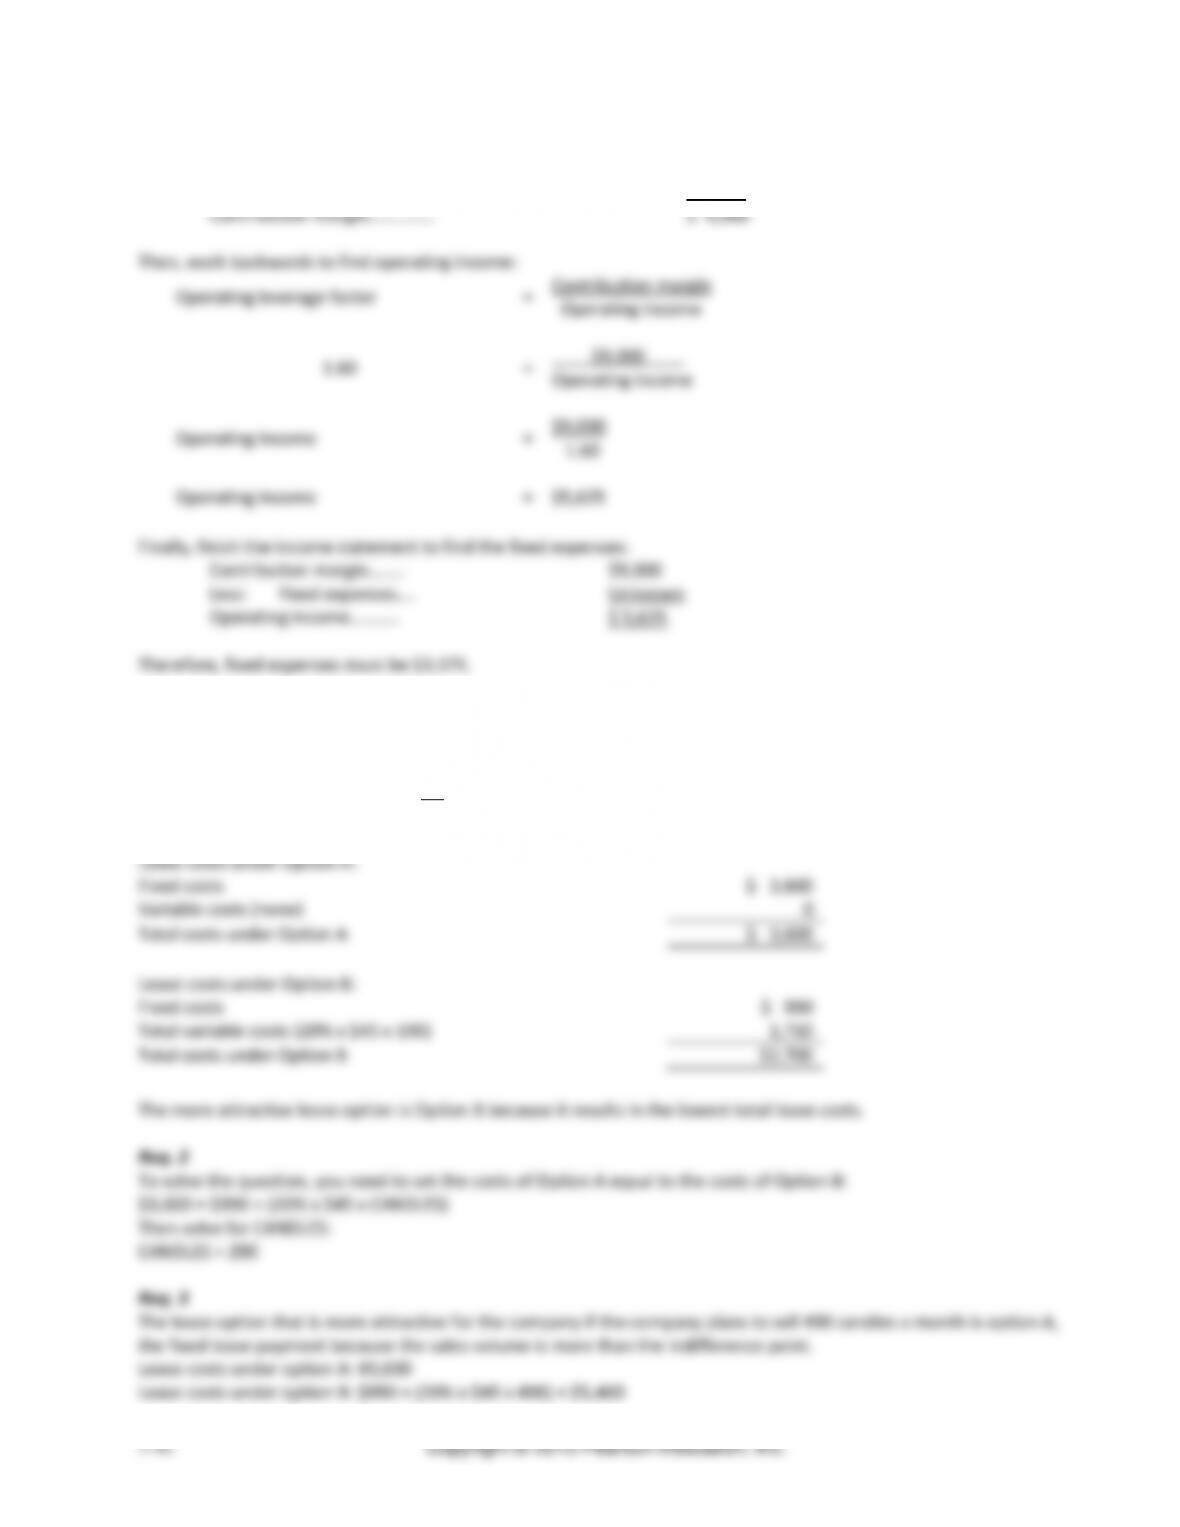
(10-15 min.) E7-55B
Req. 1
Selling price $45
Less: Variable costs ($10 + $4 + $2) 16
CM per unit $29
Lease costs under Option A:
Fixed costs
$ 3,600
Variable costs (none)
0
Total costs under Option A
$ 3,600
Lease costs under Option B:
Fixed costs
$ 990
Total variable costs (20% x $45 x 190)
1,710
Total costs under Option B
$2,700
The more attractive lease option is Option B because it results in the lowest total lease costs.
Req. 2
To solve the question, you need to set the costs of Option A equal to the costs of Option B:
$3,600 = $990 + (20% x $45 x CANDLES)
Then solve for CANDLES:
CANDLES = 290
Req. 3
The lease option that is more attractive for the company if the company plans to sell 490 candles a month is option A,
the fixed lease payment because the sales volume is more than the indifference point.
Lease costs under option A: #3,600
Lease costs under option B: $990 + (20% x $45 x 490) = $5,400
Managerial Accounting 4e Solutions Manual
(continued) E7-56B
Req. 3
Margin of safety in dollars:
Sales at target level
$3,285
Sales at B/E level:
($720 / 40) x $73
$1,314
Margin of safety in dollars
$1,971
Margin of safety in units:
Sales at target level:
45
Sales at B/E level:
($720 / 40)
18
Margin of safety in units
27
Margin of safety in %:
Margin of safety in dollars:
$1,971
Sales at target level:
$3,285
$1,971/ $3,285
60.0%
(20-25 min.) E7-57B
Req. 1
Total
Per Unit
%
Sales
$115,000
$50
100%
Less: Variable expenses
57,500
25
50%
Contribution Margin
$57,500
$25
50%
Less: Fixed expenses
11,500
Operating income
$46,000
1a) Total contribution margin is $57,500.
1b) Per unit contribution margin is $25.
1c) Operating income is $46,000.
1d) Units sold = Total sales / sales price = $115,000 / $50 = 2,300 units
Chapter 7 Cost-Volume-Profit Analysis
(continued) E7-57B
Req. 2
2a.
Breakeven in units
=
Fixed expenses
Contribution margin per unit
=
$11,500
$25
=
460 units
2b.
Breakeven sales in dollars
=
Fixed expenses + Operating income
Contribution margin ratio
=
$11,500 + 0
0.50 (from req. 1)
=
$23,000
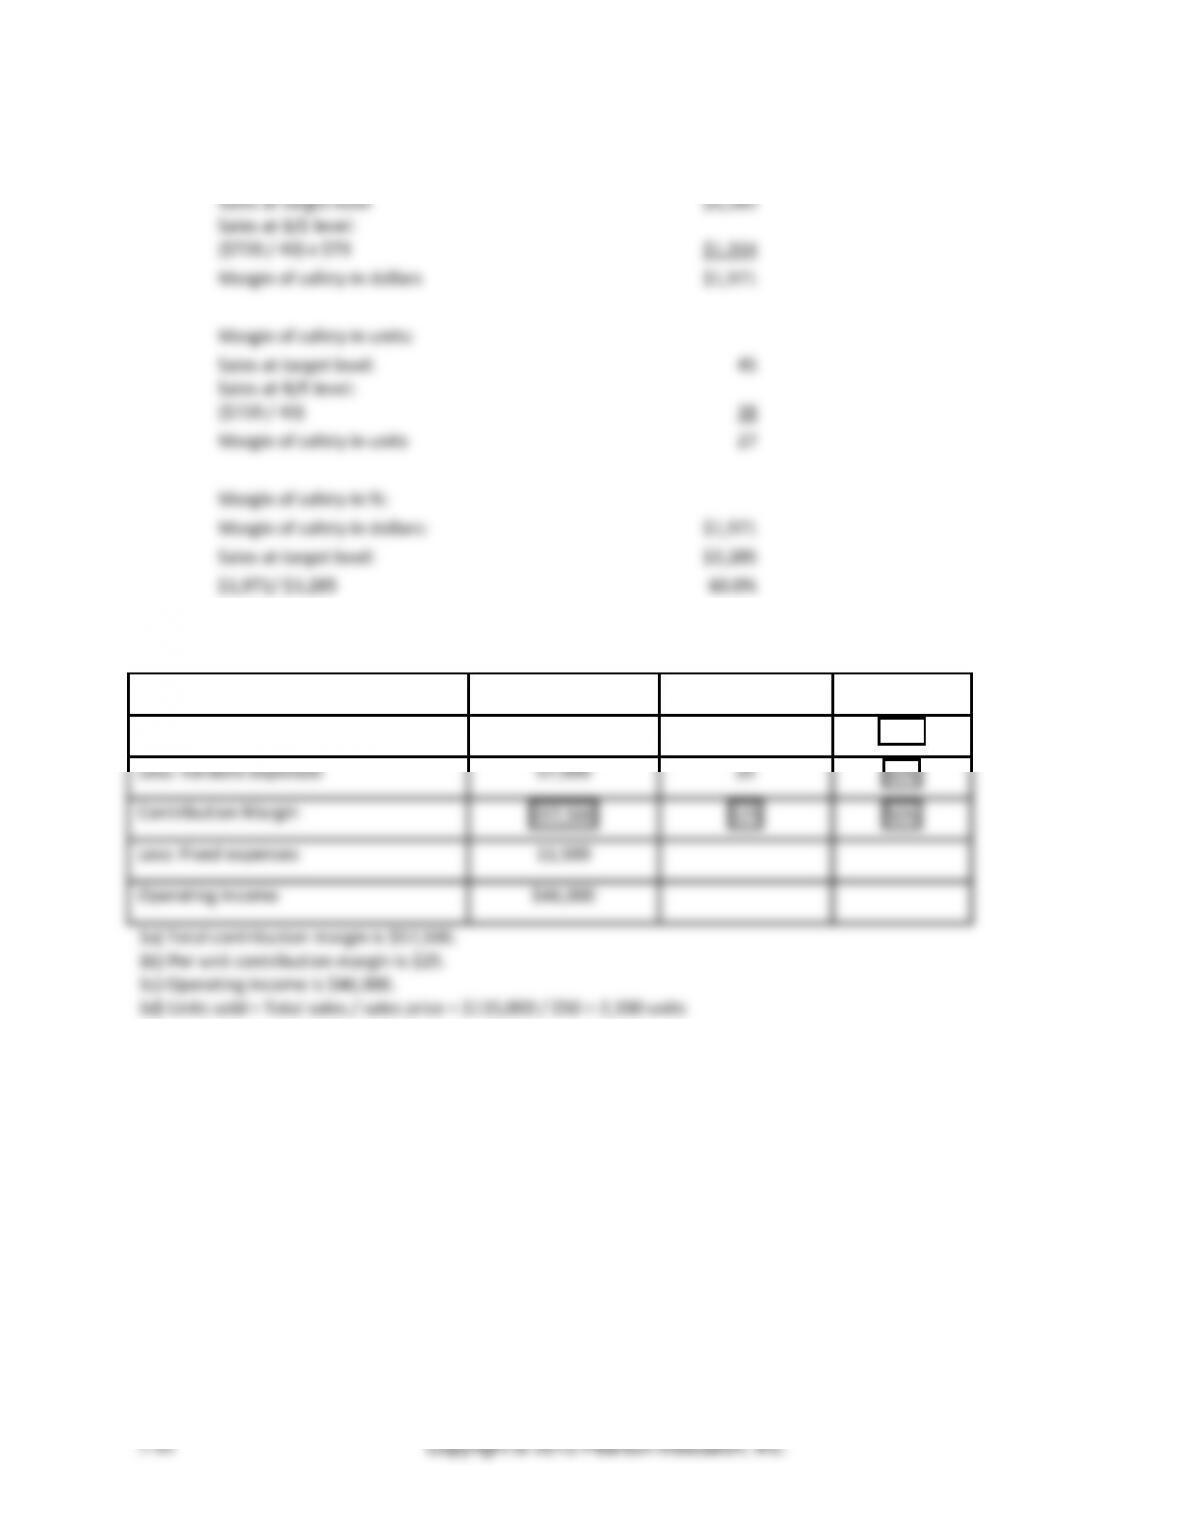
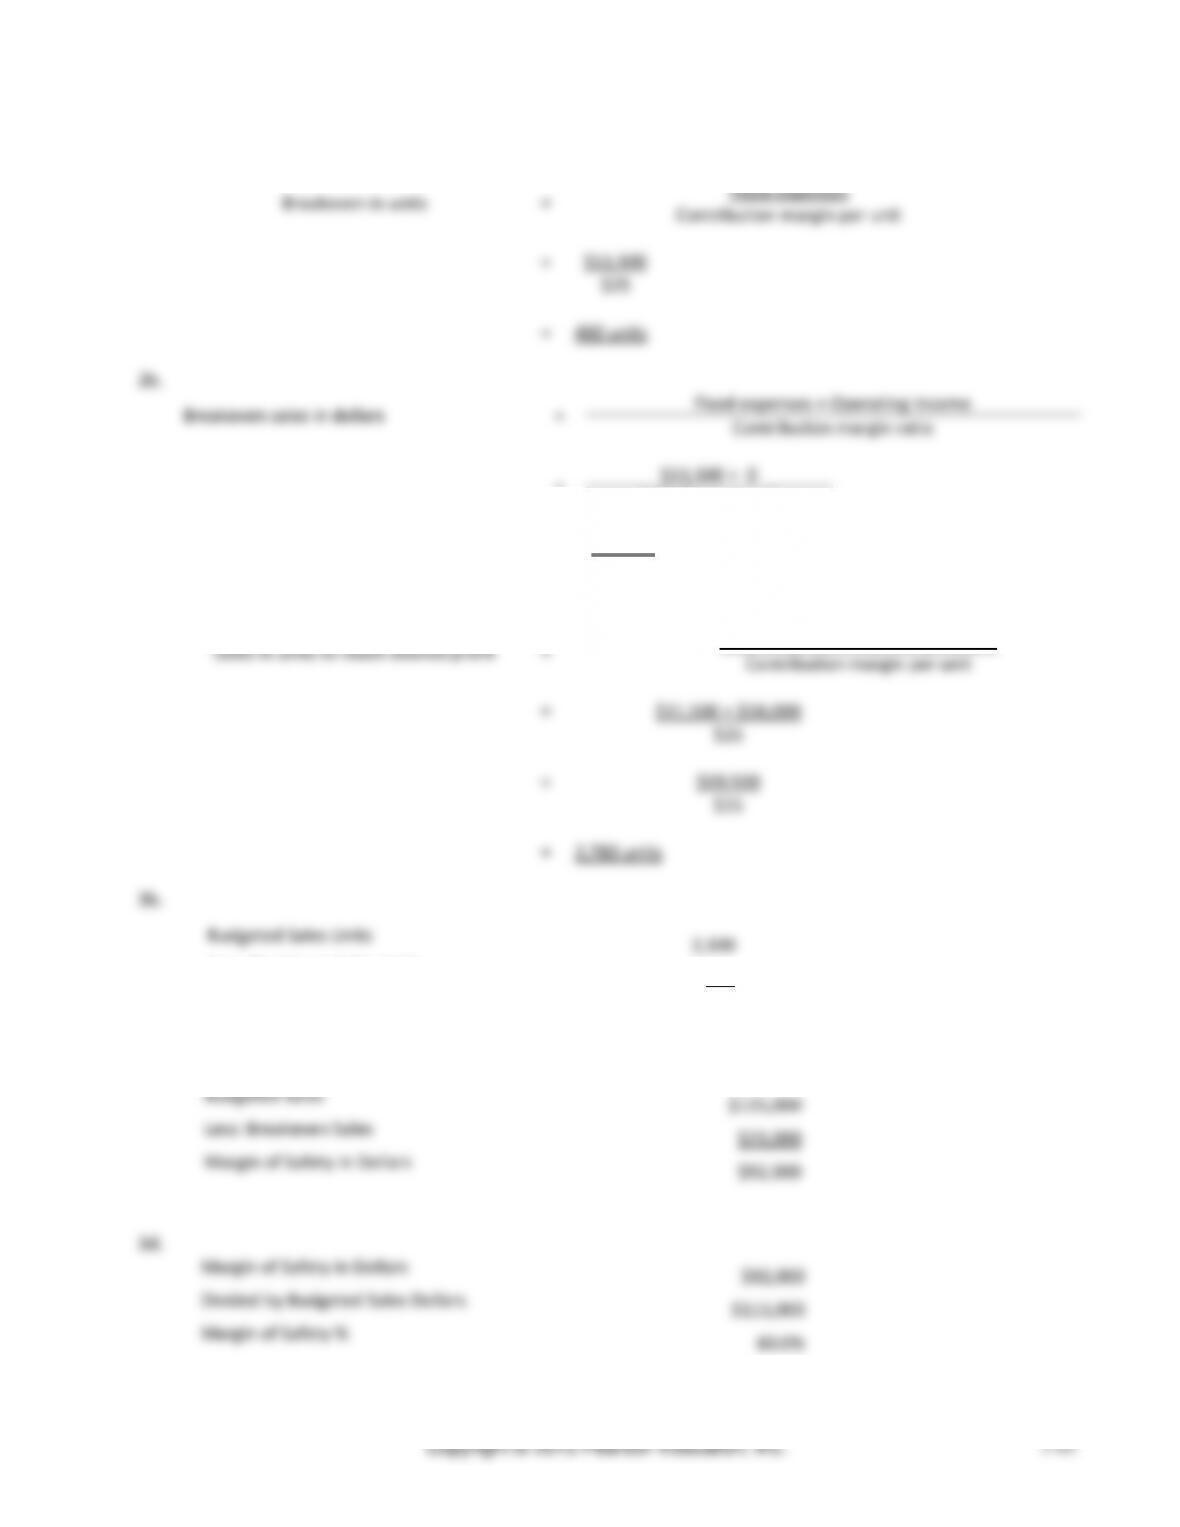
Req. 3
3a.
Sales in units to reach desired profit
=
Fixed expenses + Operating Income
Contribution margin per unit
=
$11,500 + $58,000
$25
=
$69,500
$25
=
2,780 units
3b.
3c.
Less: Breakeven Sales
Margin of Safety in Dollars
Margin of Safety in Dollars
$92,000
Divided by Budgeted Sales Dollars
$115,000
Margin of Safety %
80.0%
Budgeted Sales Units
2,300
Less: Breakeven Sales Units
460
Margin of Safety in Units
1,840
Budgeted Sales
$115,000
Managerial Accounting 4e Solutions Manual
Copyright © 2015 Pearson Education, Inc.
7-46
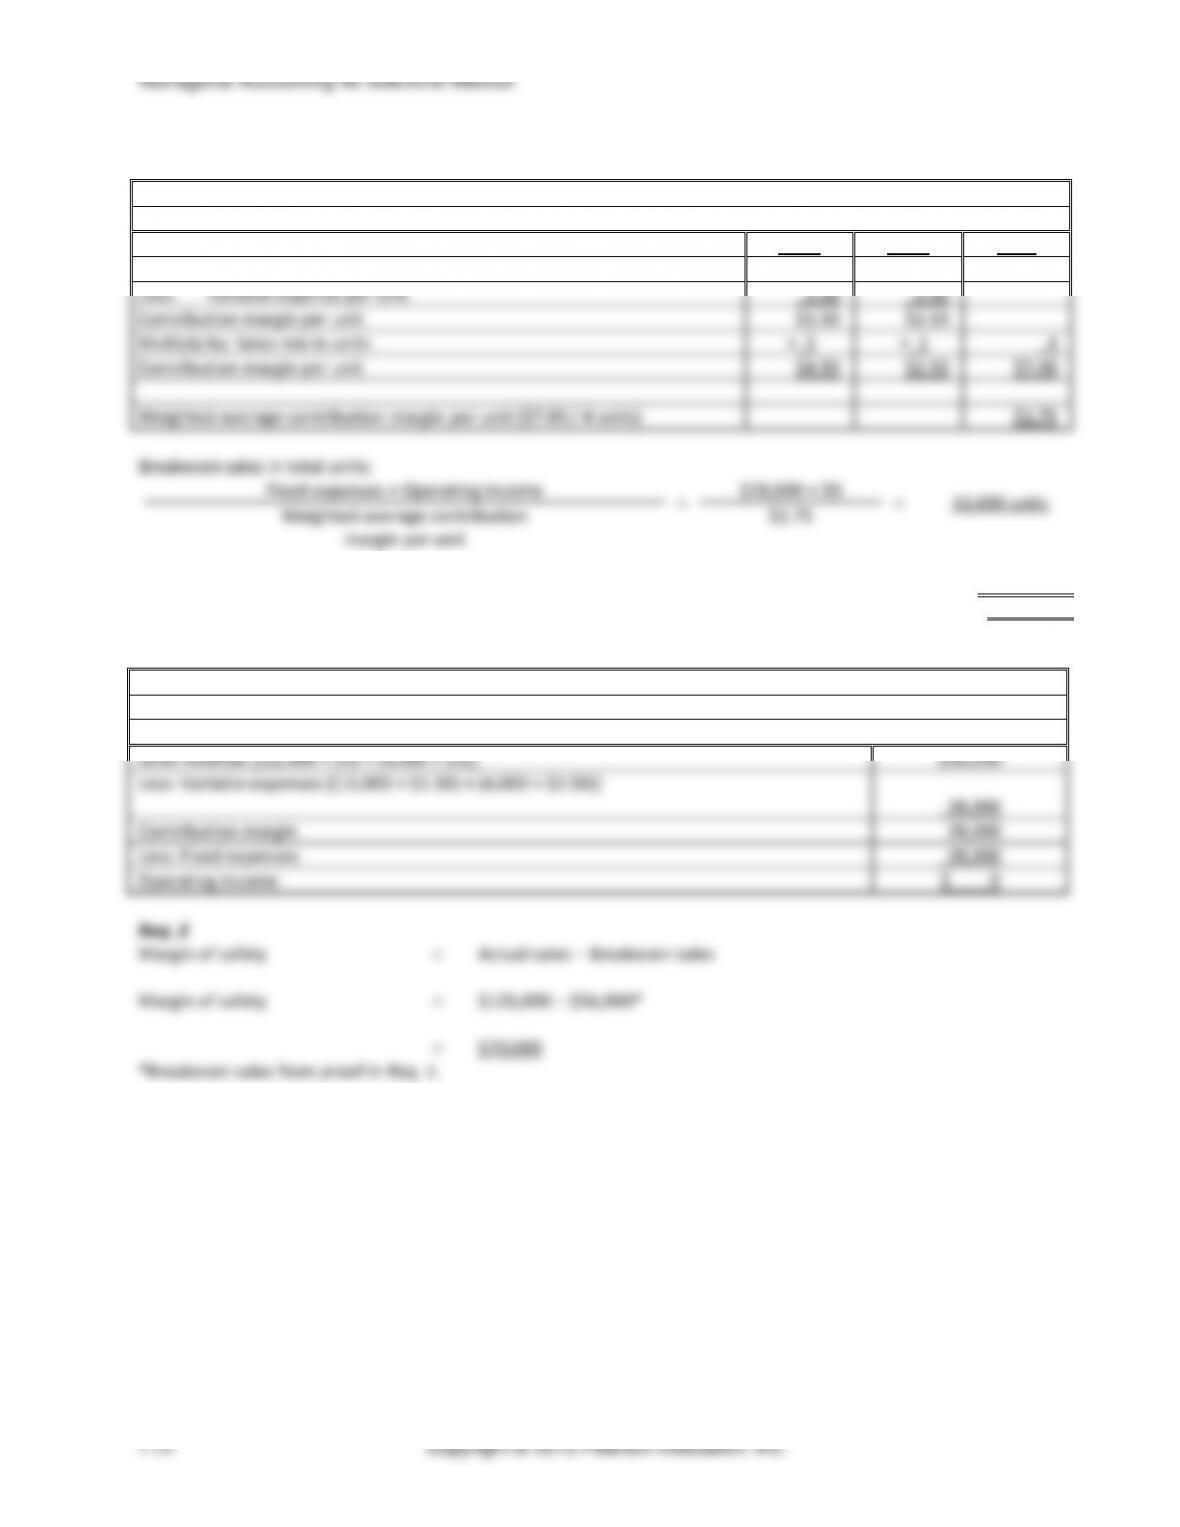
(20-25 min.) E7-58B
1.
Sales price per unit……..………………………….
$25.00
Less: Variable cost per unit ($8.40+$8+$3.70+$1.90)……………………………..
$22.00
Contribution margin per unit…………..……………
$ 3.00
Contribution margin ratio
=
$3.00
=
.12
$25.00
=
12%
Sales Revenue (100,000 × $25.00)…………
$ 2,500,000
Less: Variable exp. (100,000 × $22.00)
(2,200,000)
Contribution margin……………….………..
$ 300,000
2.
Sales volume (units)…………………………
130,000
Unit contribution margin……………………
x $25.00
Contribution margin…………………………
$390,000
Less: Fixed expenses ($121,800+$167,100)………………………
(288,900)
Operating income……………………………
$101,100
3.
Sales revenue…………………………………
$4,000,000
Contribution margin ratio…………………..
x 12%
Contribution margin…………………………
$480,000
Less: Fixed expenses ($121,800+$167,100)………………………
(288,900)
Operating income……………………………
$ 191,100
4.
B/E sales in units
=
$288,900
=
96,300
$3.00
units
B/E sales in dollars
=
$288,900
=
$2,407,500
12%
5.
$288,900 + $260,100
=
183,000 units
$3.00
Chapter 7 Cost-Volume-Profit Analysis
(continued) E7-58B
6.
Original contribution margin per unit………………
$3.00
Less: Increase in Direct labor cost per unit ($8.00 x
10%)………………………………….………..…….
$0.80
New contribution margin per unit…………………
$2.20
Original fixed expenses…………………………….
$288,900
Plus: Increase in fixed expenses……………….
23,500
New fixed expenses…………………………………
$312,400
New breakeven in units
=
$312,400
=
142,000
$2.20
Units
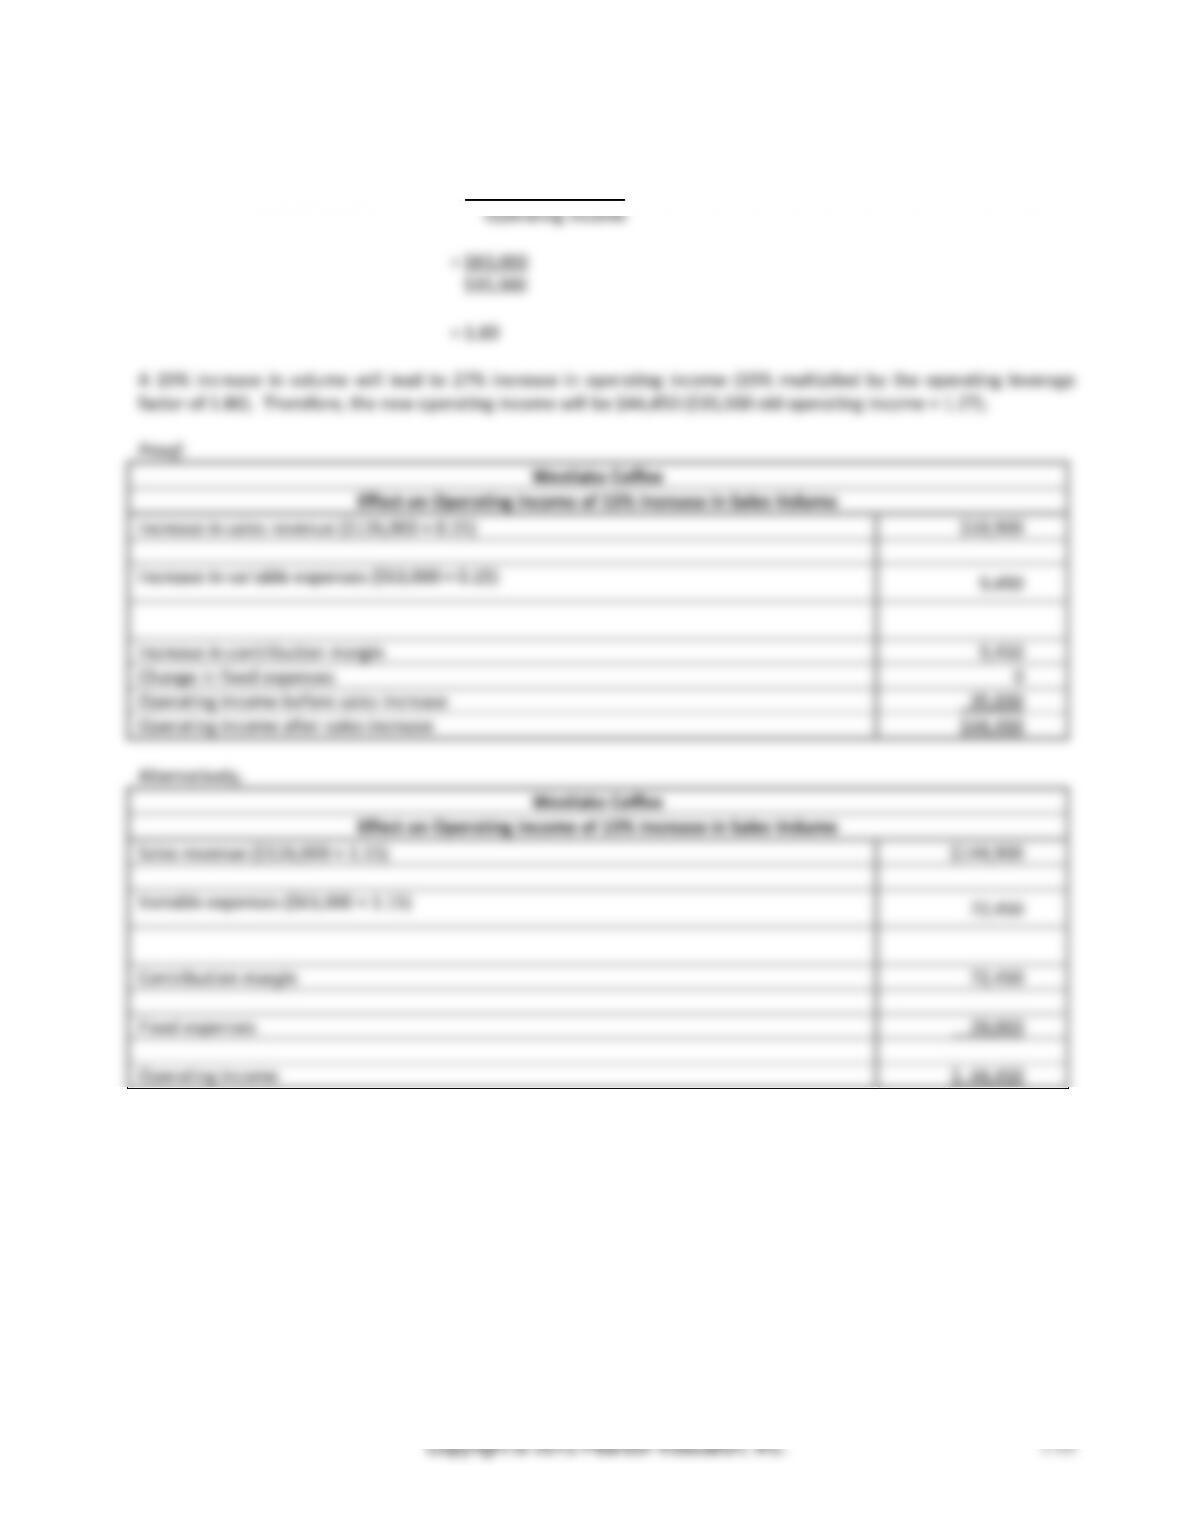
7.
Contribution margin (from part 1)…………………
$300,000
Less: Fixed expenses……………………………..
(288,900)
Operating income……………………………………
$11,100
Operating leverage factor
=
$300,000
=
27.03 (rounded)
$11,100
8.
Increase in volume……………………..
3%
× Operating leverage factor…………..
27.03
New fixed expenses……………………
81.1% (rounded)
9.
Margin of safety
=
Sales − Sales at breakeven
=
$2,500,000 − $2,407,500
(from part 1) (from part 4)
=
$92,500
Margin of safety as a percentage
=
92,500
2,500,000
=
.037
=
3.7%
10.
16 GB
32 GB
Total
Sales price……………..
$25
$50
Less: Variable cost…………..
22
27
Contribution margin….
$ 3
$23
Multiply by: Sales mix……………….
× 9
× 1
10
Contribution margin….
$27
$23
$50
Weighted-average contribution margin per unit
$5.00
Sales in units
=
$121,800 + $167,100 + $260,100
=
109,800 units
$5.00
Smaller 16 GB: 109,800 × 9/10…………………
98,820 units
Larger 32 GB: 109,800 × 1/10….………………
10,980 units
Copyright © 2015 Pearson Education, Inc.
7-48
(30-45 min.) P7-59A
Req. 1
Cost-Volume-Profit Analysis
Companies Q, R, S, T
COMPANY
Q
R
S
T
Target sales
$625,000
$445,000
$236,000
$780,000
Less: Variable expenses
125,000
178,000
118,000
156,000
Less: Fixed expenses
370,000
159,000
94,000
493,000
Operating income
$130,000
$ 108,000
$ 24,000
$131,000
Units sold
80,000
106,800
12,500
16,000
Contribution margin per unit
$ 6.25
$ 2.50
$ 9.44
$ 39.00
Contribution margin ratio
0.80
0.60
0.50
0.80
Computations (top to bottom for each company)
Q: Sales − Variable expenses − Operating income = Fixed expenses
$625,000 − $125,000 − $370,000 = $130,000
Sales − Variable expenses = Contribution margin;
Chapter 7 Cost-Volume-Profit Analysis
(continued) P7-59A
T: Units sold × Unit contribution margin = Contribution margin;
Contribution margin + Variable expenses = Sales
16,000 × $39 = $624,000; $624,000 + $156,000 = $780,000
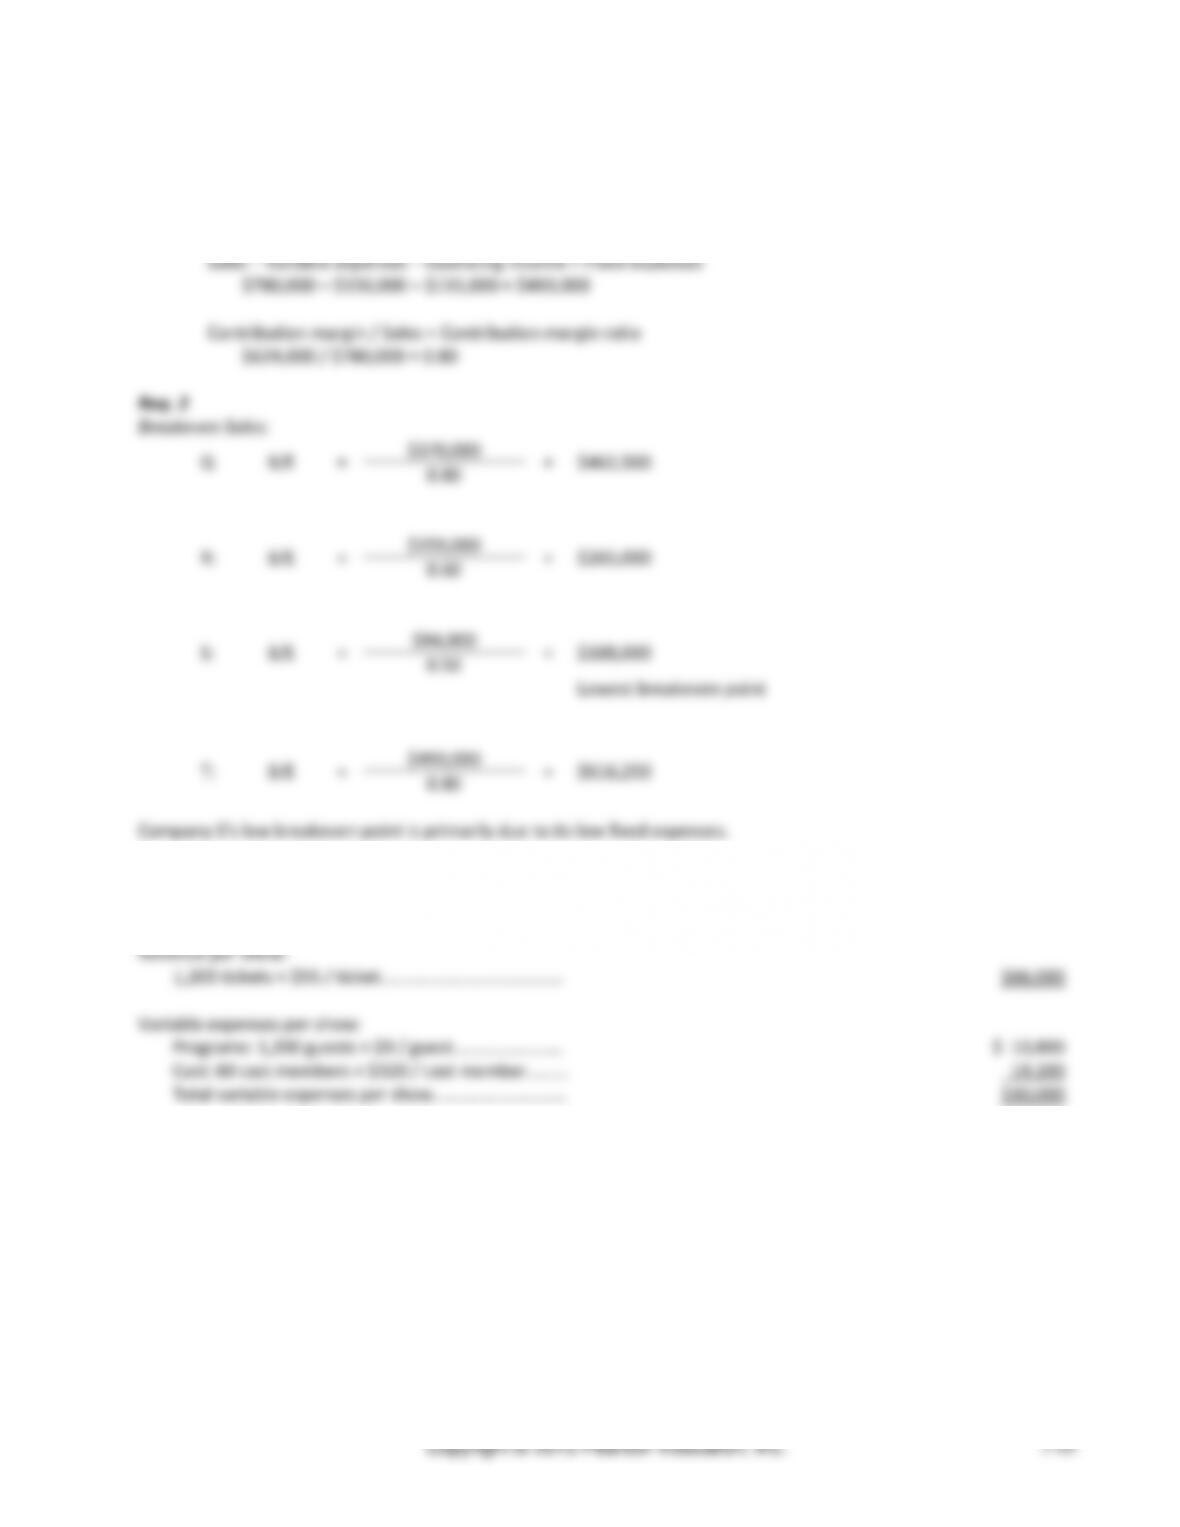
(30-45 min.) P7-60A
Req. 1
Revenue per show:
1,200 tickets × $55 / ticket…..……………….……………
$66,000
Variable expenses per show:
Programs: 1,200 guests × $9 / guest……….……….…
$ 10,800
Cast: 60 cast members × $320 / cast member………
19,200
Total variable expenses per show…………………..…..
$30,000
Managerial Accounting 4e Solutions Manual
(continued) P7-60
Sales revenue
−
Variable expenses
−
Fixed expenses
=
Operating income
Revenue
Number
Variable
Number
per
×
of
−
exp. per
×
of
−
Fixed expenses
=
Operating income
show
shows
show
shows
Number
Number
$66,000
×
of
−
$30,000
×
of
−
$969,000
=
$0
shows
shows
($66,000 – $30,000) × Number of shows
=
$1,224,000
$36,000 × Number of shows
=
$1,224,000
Number of shows
=
$1,224,000
$36,000
Breakeven number of shows
=
34 shows
Req. 3
Contribution margin
=
$66,000 − $30,000
=
$36,000
Target number of shows
=
Fixed expenses + Target operating income
Contribution margin per unit
Target number of shows
=
$1,224,000 + $3,888,000
$36,000
Target number of shows
=
$5,112,000
$36,000
Target number of shows
=
142 shows
Chapter 7 Cost-Volume-Profit Analysis
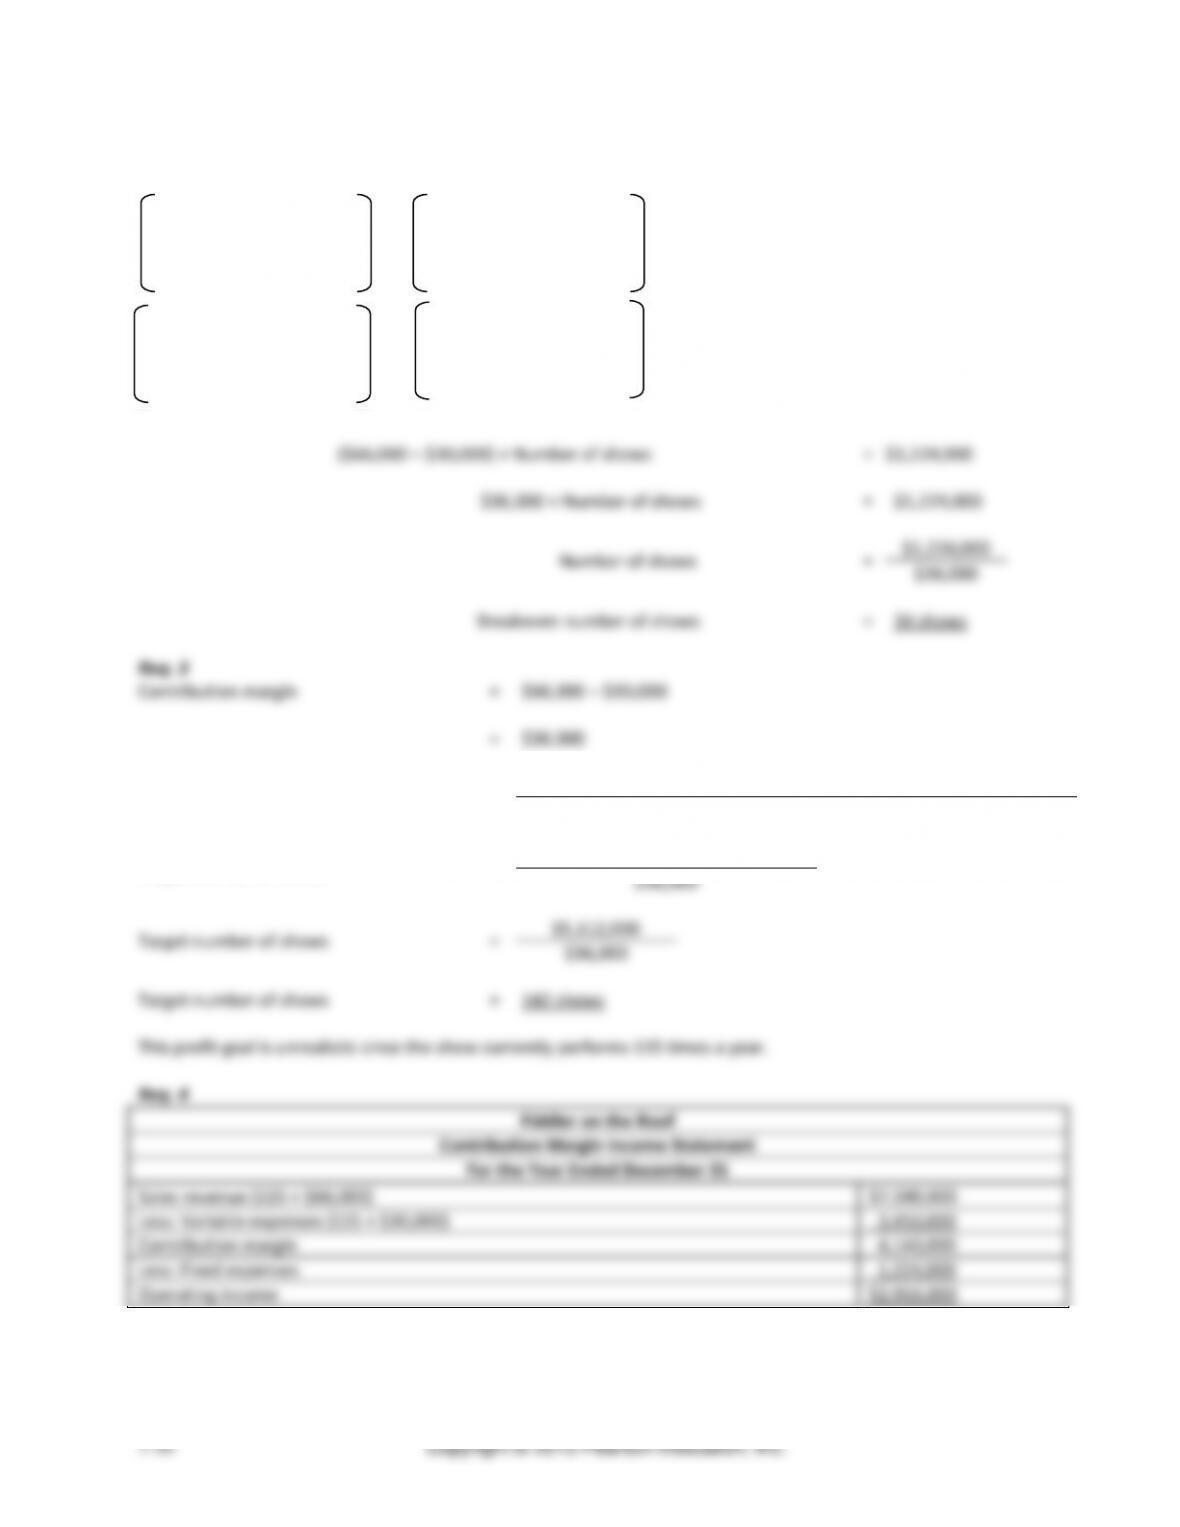
(30-45 min.) P7-61A
Managerial Accounting 4e Solutions Manual
(continued) P7-61A
Req. 4
Margin of safety
=
Sales − Sales at breakeven
Margin of safety
=
$7,425,000 − (109,500 cartons × $16.50 per carton)
Margin of safety
=
$7,425,000 − $1,806,750
Margin of safety
=
$5,618,250
Operating leverage factor
=
Contribution margin
Operating income
Operating leverage factor
=
$4,500,000
$3,405,000
Operating leverage factor
=
1.322 (rounded)
Req. 5
If volume increases 16%, then operating income will increase 21.15% (operating leverage factor of 1.322 multiplied by
16%).
Proof:
Original volume (cartons)…..……………………
450,000
Add: Increase in volume (16% × 450,000)…
72,000
New volume (cartons)…………………………
522,000
Multiplied by: Unit contribution margin………
$10.00
New total contribution margin………………
$5,220,000
Less: Fixed expenses……………………….
(1,095,000)
New operating income……………………….
$4,125,000
vs. Operating income before change in
volume……………………………………..
3,405,000
Increase in operating income……………….
$ 720,000
Percentage change ($720,000 / $3,405,000)
21.15% (rounded)
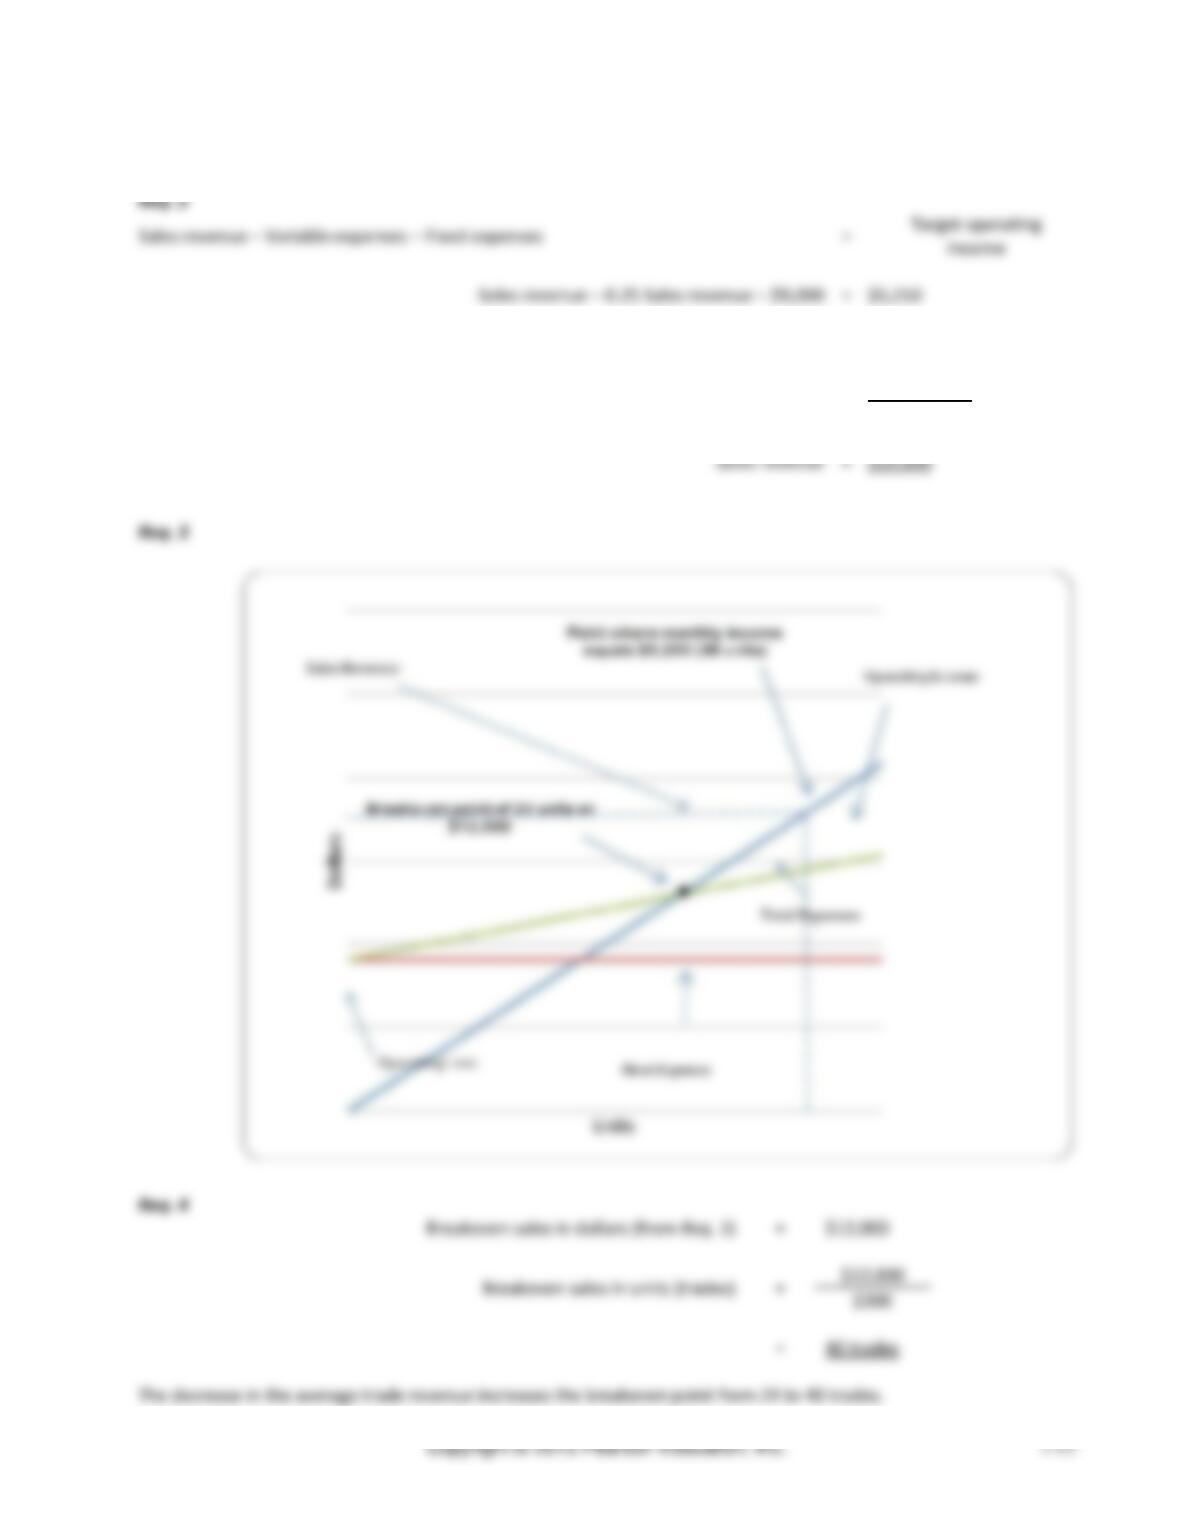
(30-45 min.) P7-62A
Req. 1
Contribution margin ratio
=
0.75 (computed as 1.00 − 0.12 − 0.04 − 0.03 − 0.06)
Monthly fixed expenses
=
$9,000 (computed as $2,700 + $280 + $250 + $600 + $650 +
$4,520)
Breakeven sales in dollars
=
Fixed expenses + Operating income
Contribution margin ratio
=
$9,000 + $0
0.75
=
$12,000
Breakeven sales in units
=
$12,000
(trades)
$500
=
24 trades
Chapter 7 Cost-Volume-Profit Analysis
(continued) P7-62A
Chapter 7 Cost-Volume-Profit Analysis
(continued) P7-63A
Req. 3
Operating leverage factor
= Contribution Margin