Chapter 7 Cost-Volume-Profit Analysis
Copyright © 2015 Pearson Education, Inc.
7-1
Chapter 7
Cost-Volume-Profit Analysis
Quick Check
Answers:
QC-1. d
QC-3. b
QC-5. a
QC-7. b
QC-9. c
QC-2. c
QC-4. c
QC-6. c
QC-8. b
QC-10. d
(5-10 min.) S7-1
a.
Sales price per passenger…………………….
$ 50
Less: Variable cost per passenger…………..
20
Contribution margin per passenger…………
$ 30
b.
Contribution margin per passenger…………
$30
Divided by sales price per passenger……….
÷ 50
Contribution margin ratio……………………..
60%
c.
Total contribution margin (11,000 × $30)……
$330,000
Less: Fixed expenses…………………………..
210,000
Operating income……………………………….
$120,000
d.
Total contribution margin
($490,000 × 60%) …………………………..
$294,000
Less: Fixed expenses…………………………..
210,000
Operating income……………………………….
$84,000
(5 min.) S7-2
The unit contribution margin tells managers how much income is earned on each unit of sales before considering fixed
Managerial Accounting 4e Solutions Manual
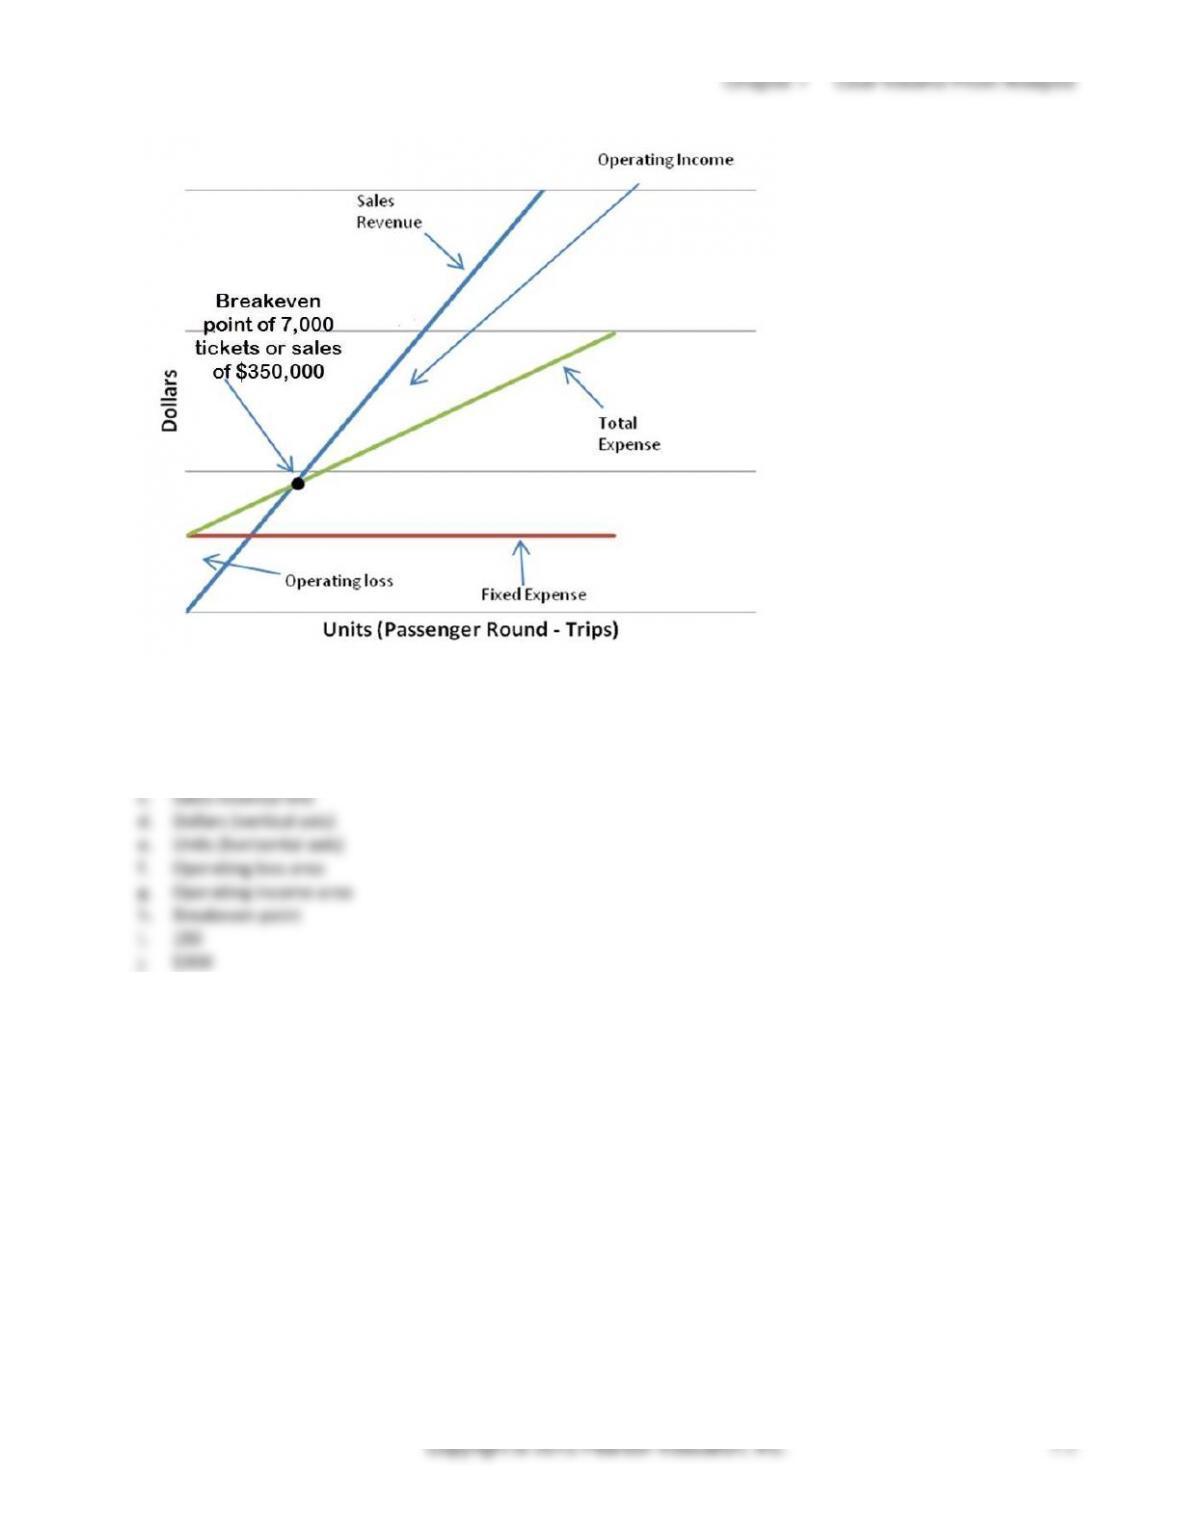
(5-10 min.) S7-3
Units sold
=
Fixed expenses + Operating income
(to break even)
Contribution margin per unit (passenger)
=
$210,000 + 0
$30*
=
7,000 passengers
*Contribution margin
=
$50 sales
−
$20 variable expense
per passenger
price
per passenger
(5 min.) S7-4
Sales in units
=
Fixed expenses + Operating income
Contribution margin per unit
=
$210,000 + $45,000
$30
=
8,500 dinner cruise tickets
Or, using the equation approach:
Sales revenue
−
Variable expenses
−
Fixed
=
Operating
expenses
income
Sale price Units
per unit × sold
−
Variable cost Units
−
Fixed
=
Operating
per unit × sold
expenses
income
[($50 × Units sold)
−
($20 × Units sold)]
−
$210,000
=
$45,000
[($50 − $20) × Units sold]
−
$210,000
=
$45,000
Units sold
=
8,500 tickets
To earn target income of $45,000, the cruiseline must sell 8,500 dinner cruise tickets.
Chapter 7 Cost-Volume-Profit Analysis
(continued) S7-7
Req. 2
If the variable cost decreases to $10, then the new unit contribution margin is $40 ($50 − $10). The new breakeven
point in units is:
=
Fixed expenses + Operating income
Sales in units
Contribution margin per unit
=
$210,000 + $0
$40
=
5,250 dinner cruise passengers
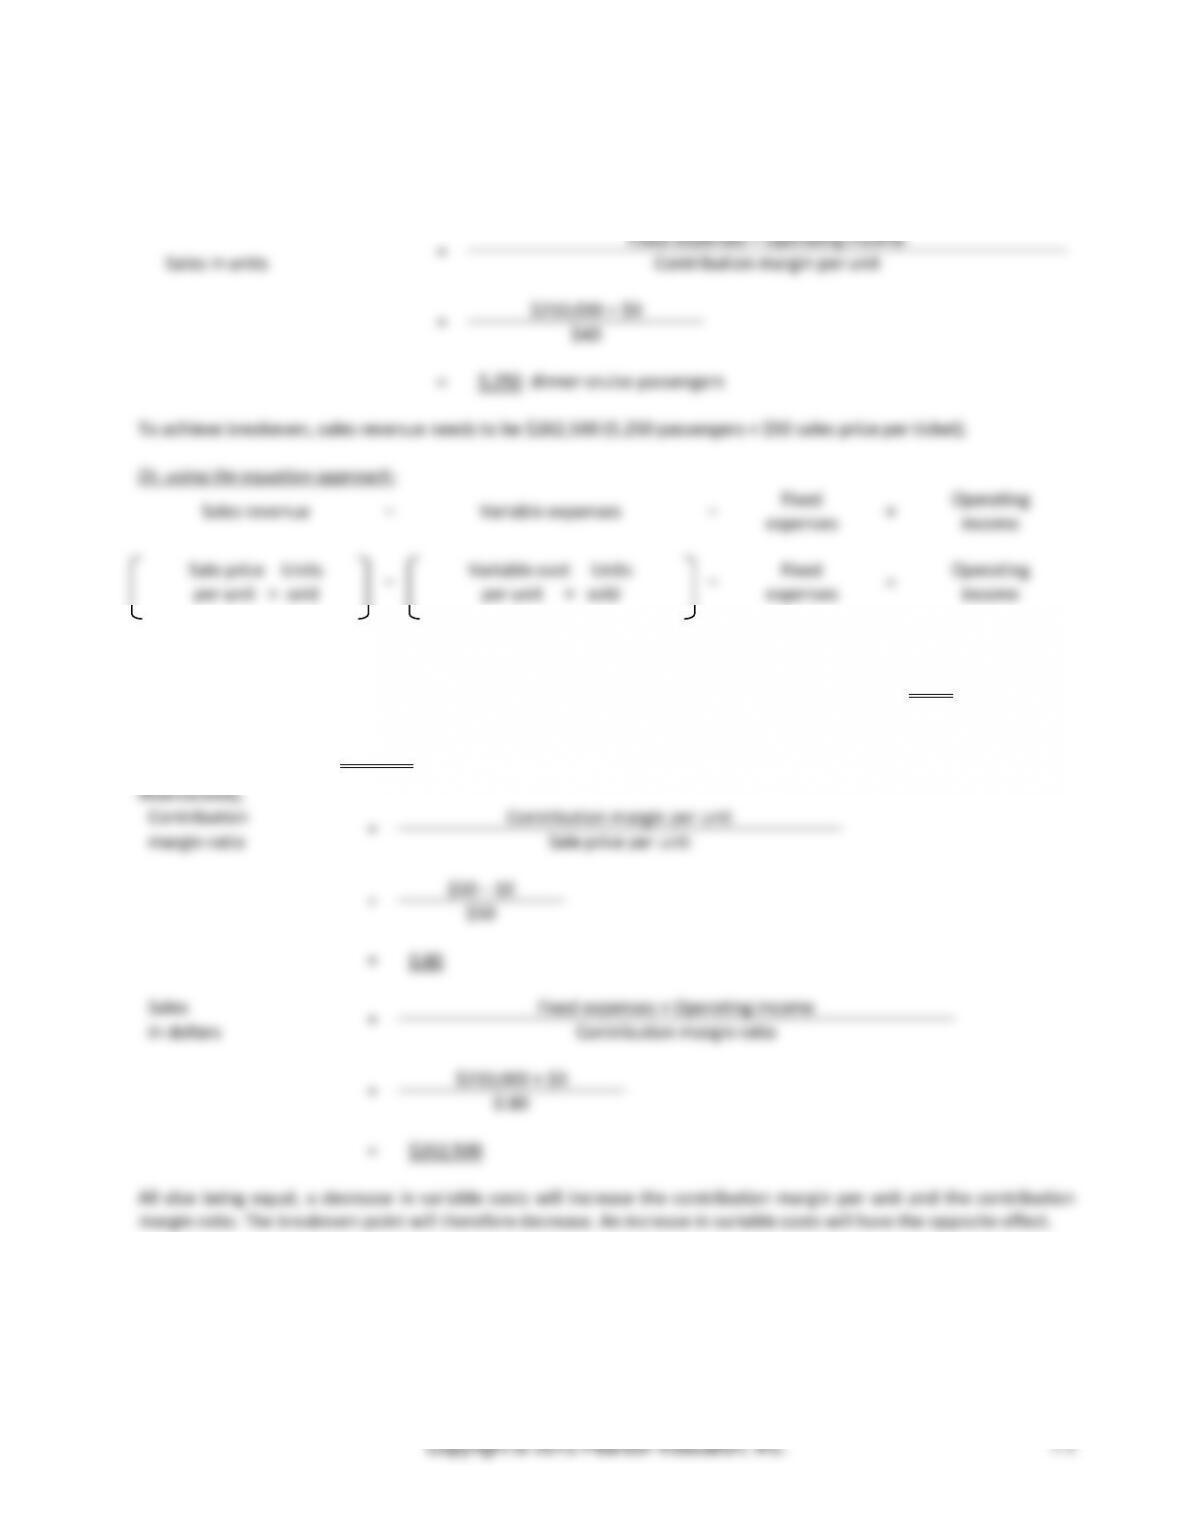
To achieve breakeven, sales revenue needs to be $262,500 (5,250 passengers × $50 sales price per ticket).
Or, using the equation approach:
Sales revenue
−
Variable expenses
−
Fixed
=
Operating
expenses
income
Sale price Units
per unit × sold
−
Variable cost Units
−
Fixed
=
Operating
per unit × sold
expenses
income
($50 × Units sold)
−
($10 × Units sold)
−
$210,000
=
$0
[($50 − $10) × Units sold]
−
$210,000
=
$0
Units sold
=
5,250 passengers
5,250 passengers × $50 = $262,500
Contribution
=
Contribution margin per unit
margin ratio
Sale price per unit
=
$50 − 10
$50
=
0.80
Sales
=
Fixed expenses + Operating income
in dollars
Contribution margin ratio
=
$210,000 + $0
0.80
=
$262,500
All else being equal, a decrease in variable costs will increase the contribution margin per unit and the contribution
margin ratio. The breakeven point will therefore decrease. An increase in variable costs will have the opposite effect.
Managerial Accounting 4e Solutions Manual
(5-10 min.) S7-8
Req. 1
The decline in fixed costs does not affect the $30 unit contribution margin calculated in S7-1. The new breakeven point
in units is:
=
Fixed expenses + Operating income
Sales in units
Contribution margin per unit
=
$180,000 + $0
$30
=
6,000 dinner cruise passengers
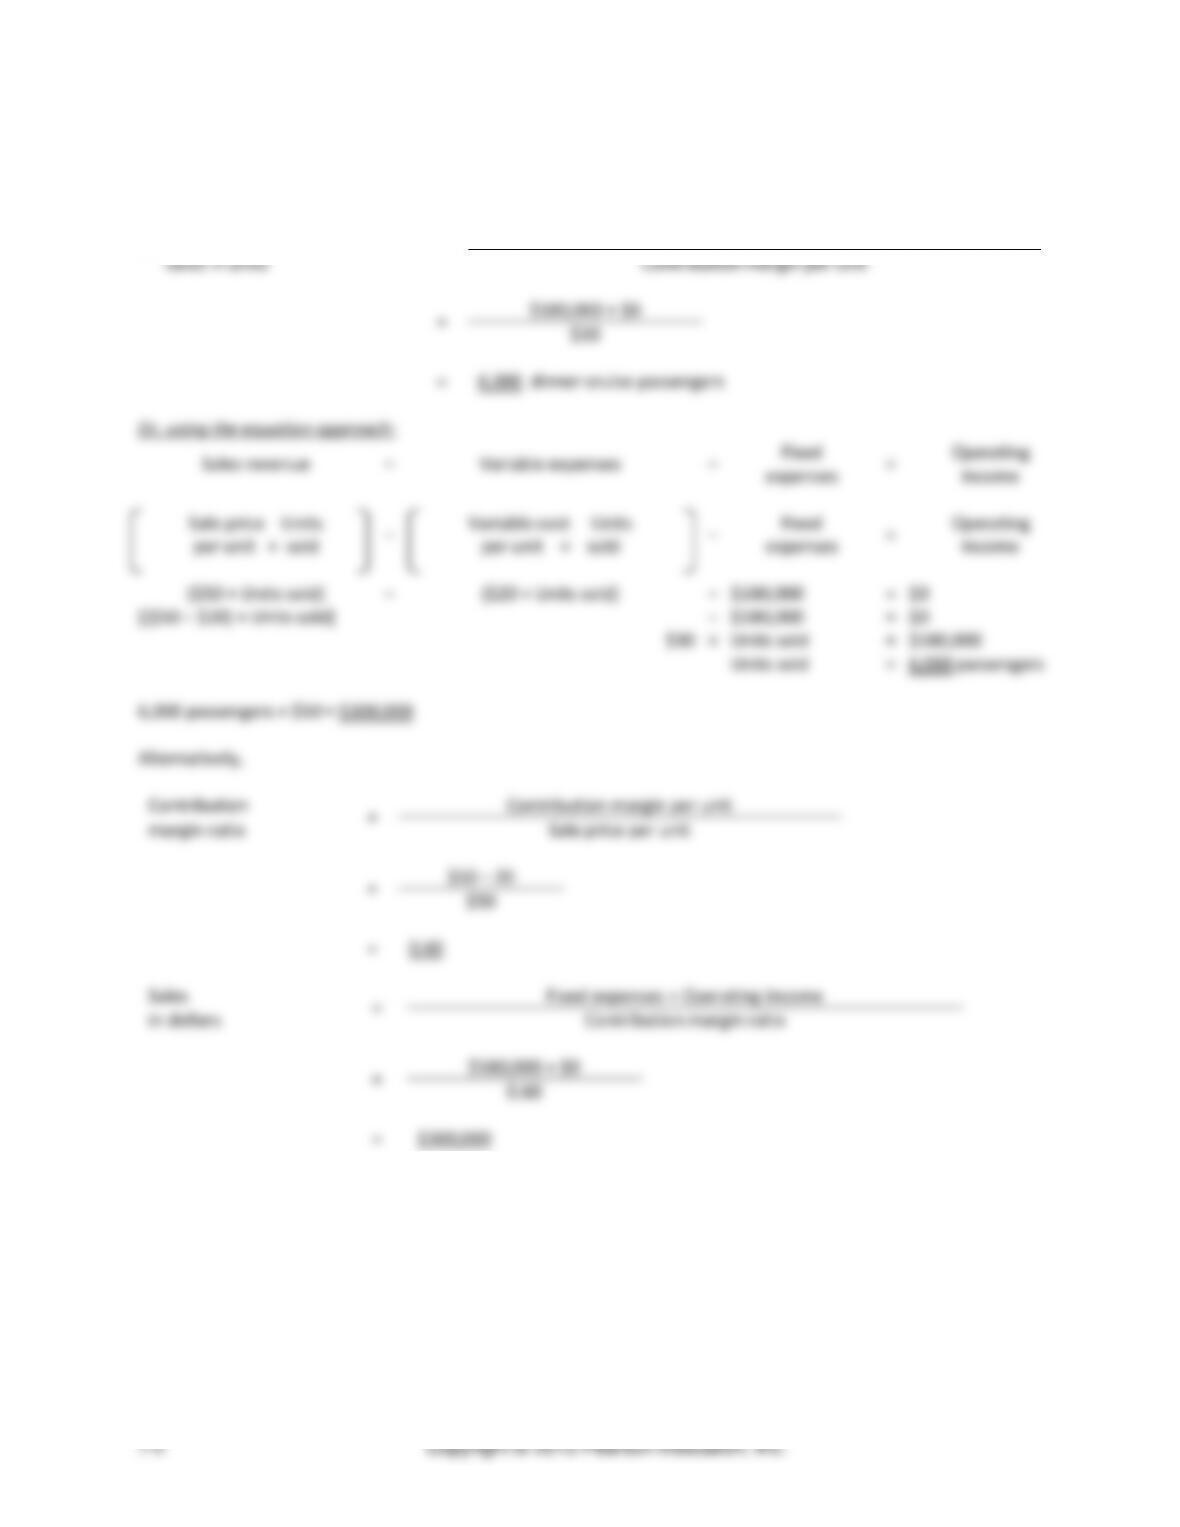
Or, using the equation approach:
Sales revenue
−
Variable expenses
−
Fixed
=
Operating
expenses
income
Sale price Units
per unit × sold
−
Variable cost Units
−
Fixed
=
Operating
per unit × sold
expenses
income
($50 × Units sold)
−
($20 × Units sold)
−
$180,000
=
$0
[($50 − $20) × Units sold]
−
$180,000
=
$0
$30
×
Units sold
=
$180,000
Units sold
=
6,000 passengers
6,000 passengers × $50 = $300,000
Alternatively,
Contribution
=
Contribution margin per unit
margin ratio
Sale price per unit
=
$50 − 20
$50
=
0.60
Sales
=
Fixed expenses + Operating income
in dollars
Contribution margin ratio
=
$180,000 + $0
0.60
=
$300,000
Chapter 7 Cost-Volume-Profit Analysis
(continued) S7-8
(5-10 min.) S7-9
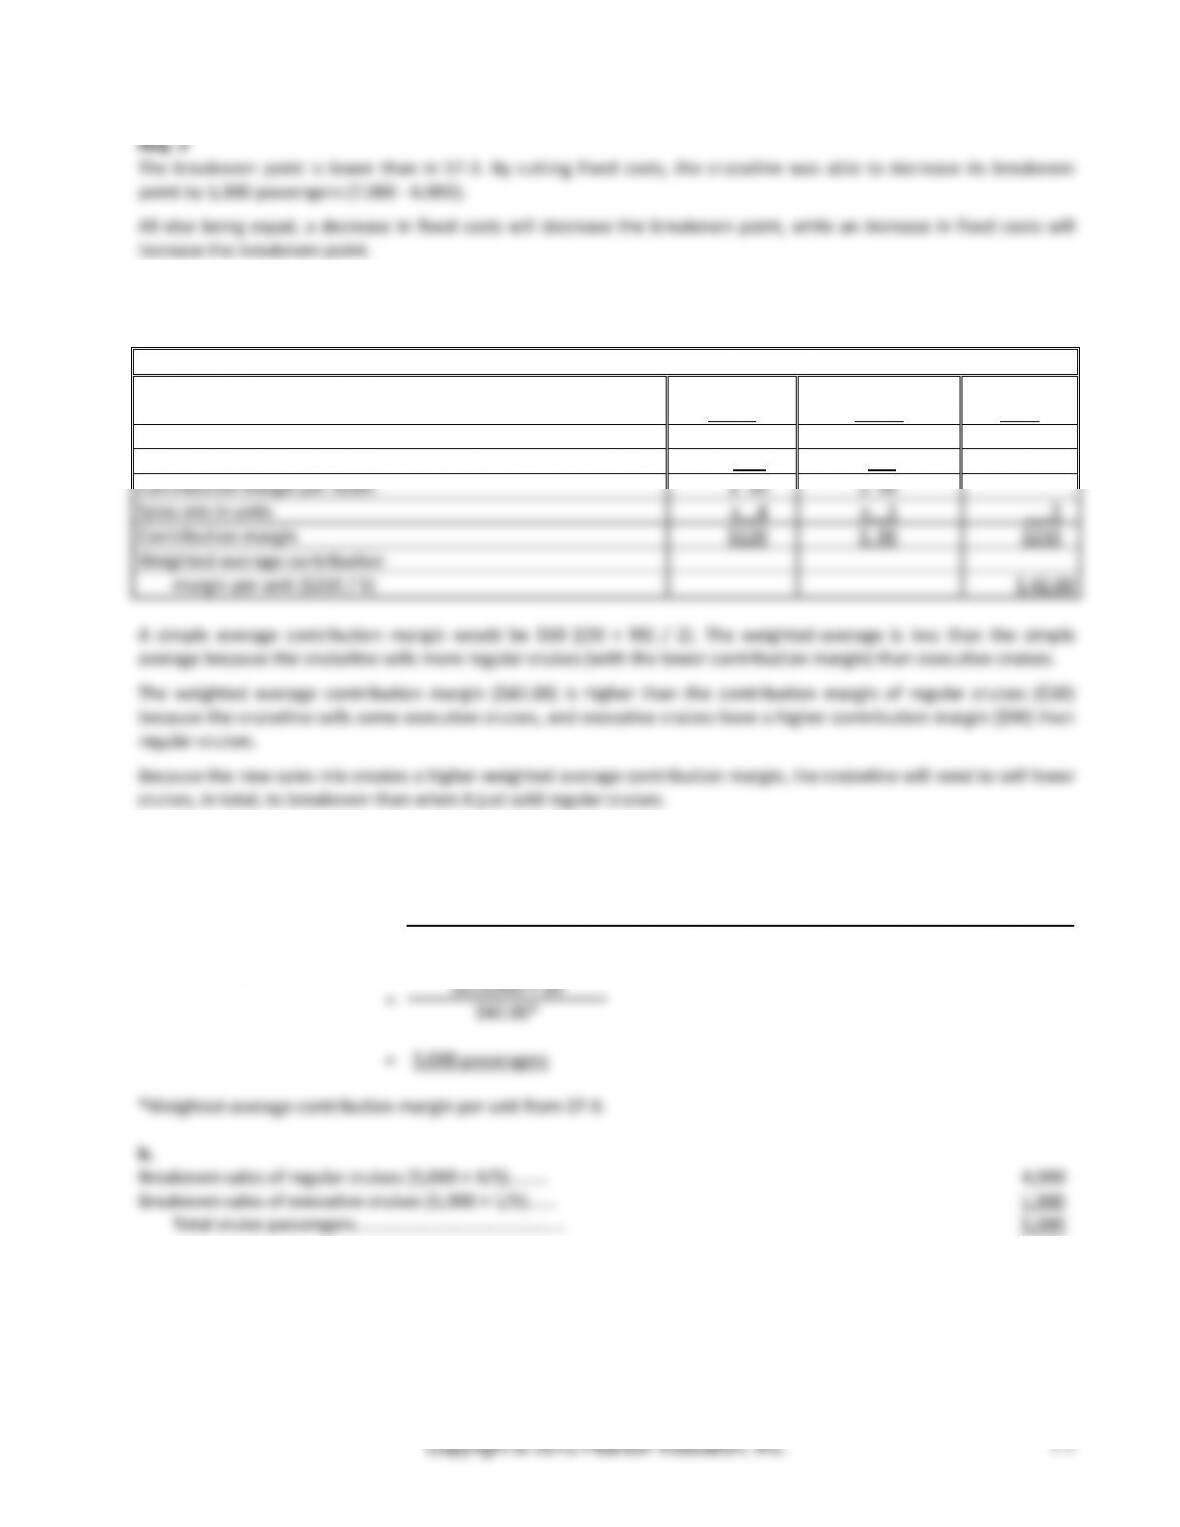
Weighted-Average Contribution Margin per Unit
Regular
Executive
Cruise
Cruise
Total
Sale price per ticket
$ 50
$130
Less: Variable expense per ticket
20
40
Contribution margin per ticket
$ 30
$ 90
Sales mix in units
× 4
× 1
5
Contribution margin
$120
$ 90
$210
Weighted-average contribution
margin per unit ($210 / 5)
$ 42.00
A simple average contribution margin would be $60 [(30 + 90) / 2]. The weighted-average is less than the simple
average because the cruiseline sells more regular cruises (with the lower contribution margin) than executive cruises.
The weighted average contribution margin ($42.00) is higher than the contribution margin of regular cruises ($30)
because the cruiseline sells some executive cruises, and executive cruises have a higher contribution margin ($90) than
regular cruises.
Because the new sales mix creates a higher weighted average contribution margin, the cruiseline will need to sell fewer
cruises, in total, to breakeven than when it just sold regular cruises.
(5-10 min.) S7-10
a.
Sales
=
Fixed expenses + Operating income
in total tickets
Weighted-average contribution margin per unit
=
$210,000 + $0
$42.00*
=
5,000 passengers
Chapter 7 Cost-Volume-Profit Analysis
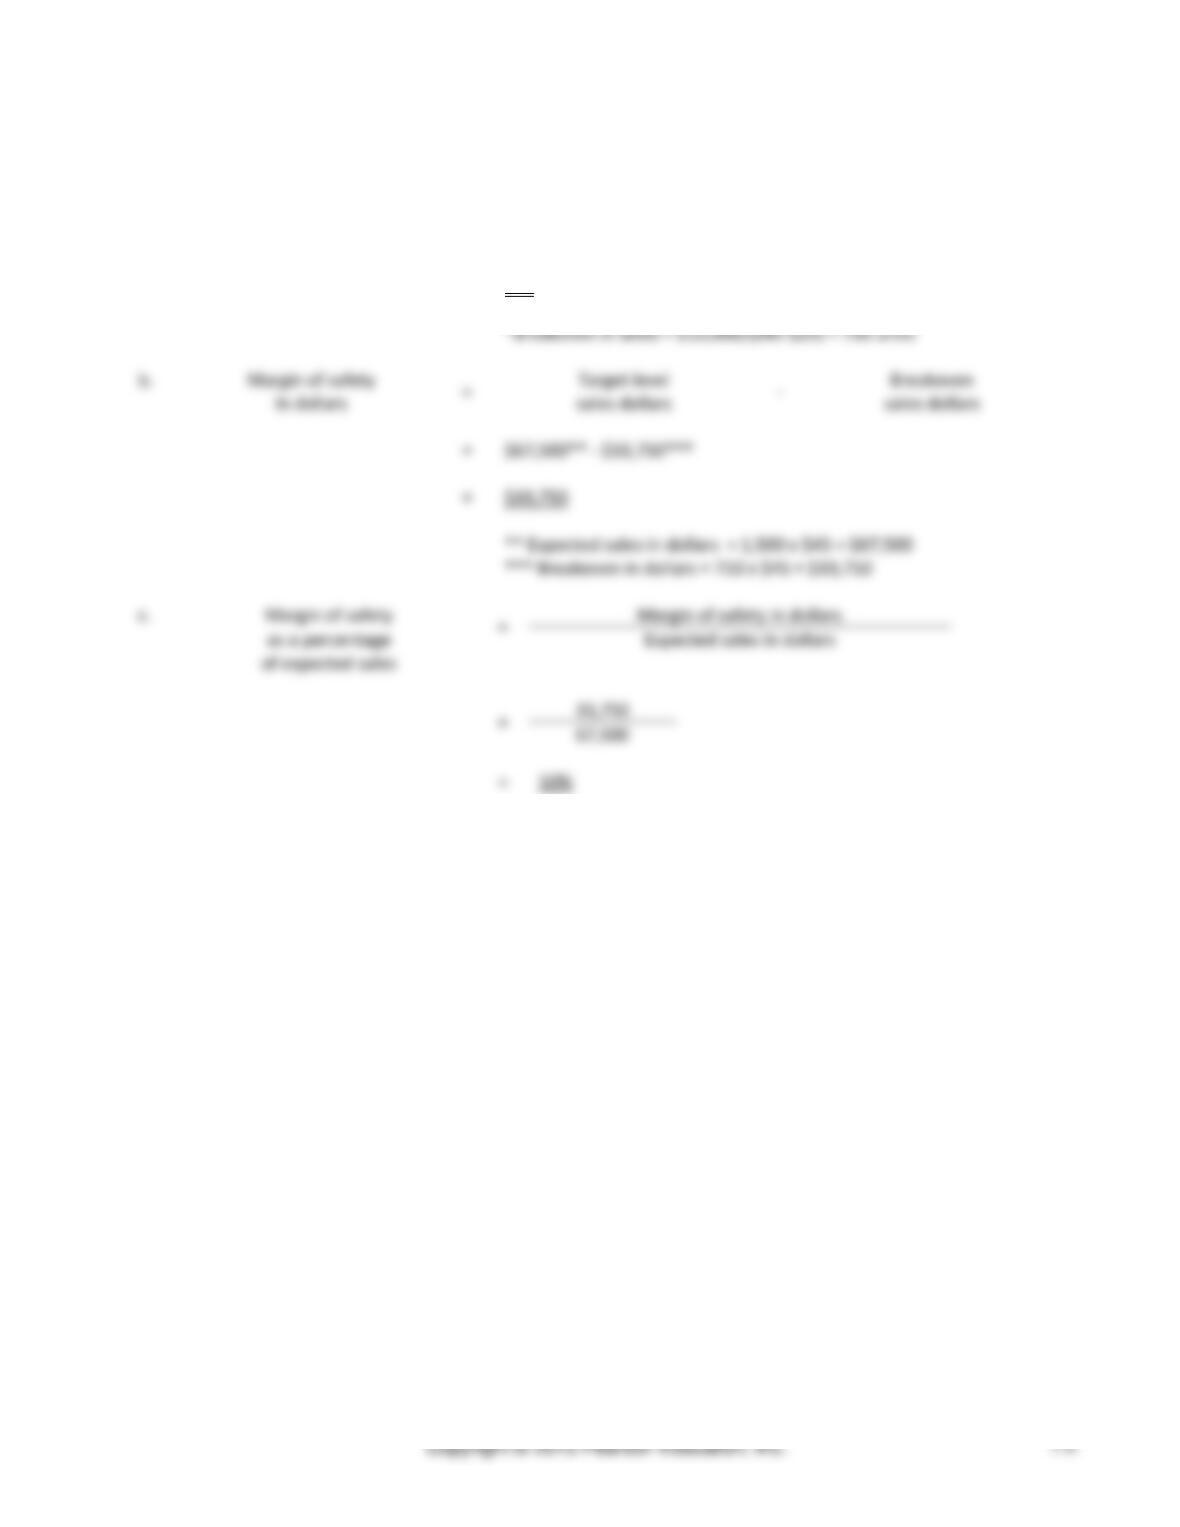
(5-10 min.) S7-13
a.
Margin of safety
=
Expected sales
−
Breakeven sales
in units
in units
in units
=
1,500 – 750*
=
750 posters
*Breakeven in units = $15,000/($45-$25) = 750 units
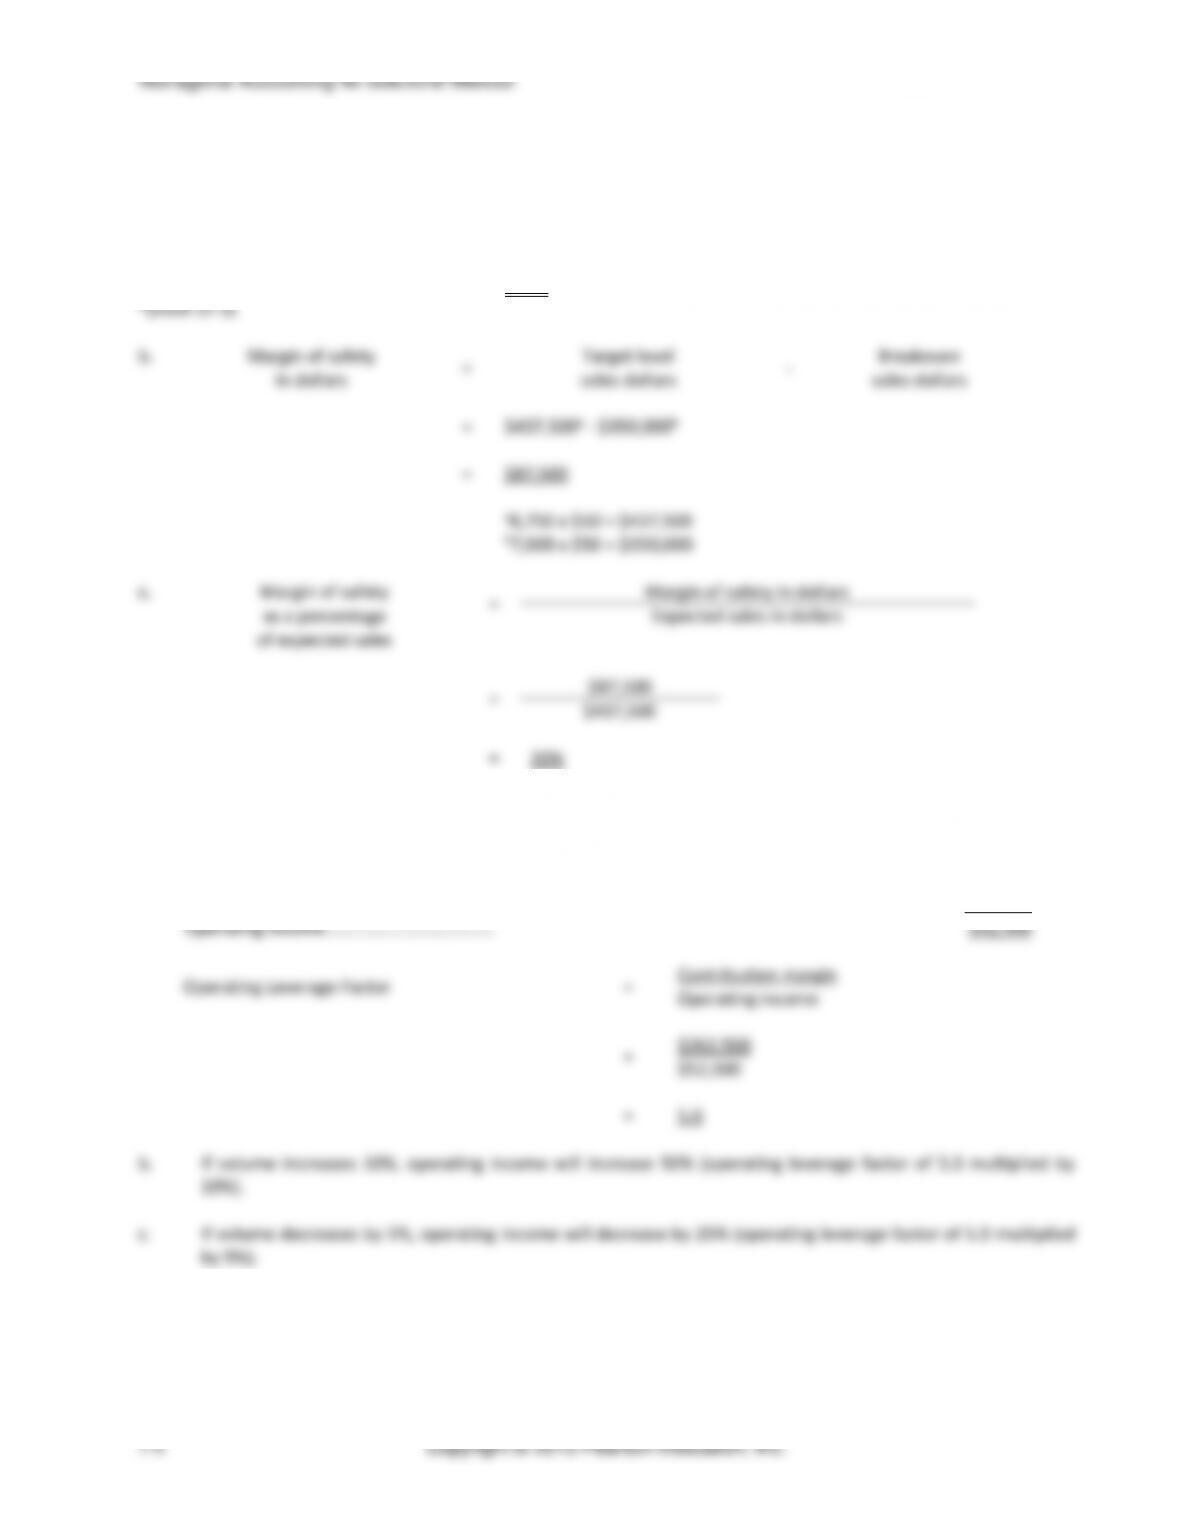
b.
Margin of safety
=
Target level
–
Breakeven
in dollars
sales dollars
sales dollars
=
$67,500** – $33,750***
=
$33,750
** Expected sales in dollars = 1,500 x $45 = $67,500
*** Breakeven in dollars = 750 x $45 = $33,750
c.
Margin of safety
=
Margin of safety in dollars
as a percentage
Expected sales in dollars
of expected sales
=
33,750
67,500
=
50%
Chapter 7 Cost-Volume-Profit Analysis
(5-10 min.) S7-15
Req. 1
Product: Cupcakes
Selling price per unit
$ 6.00
Less: Variable cost per unit
$ 4.00
CM
$ 2.00
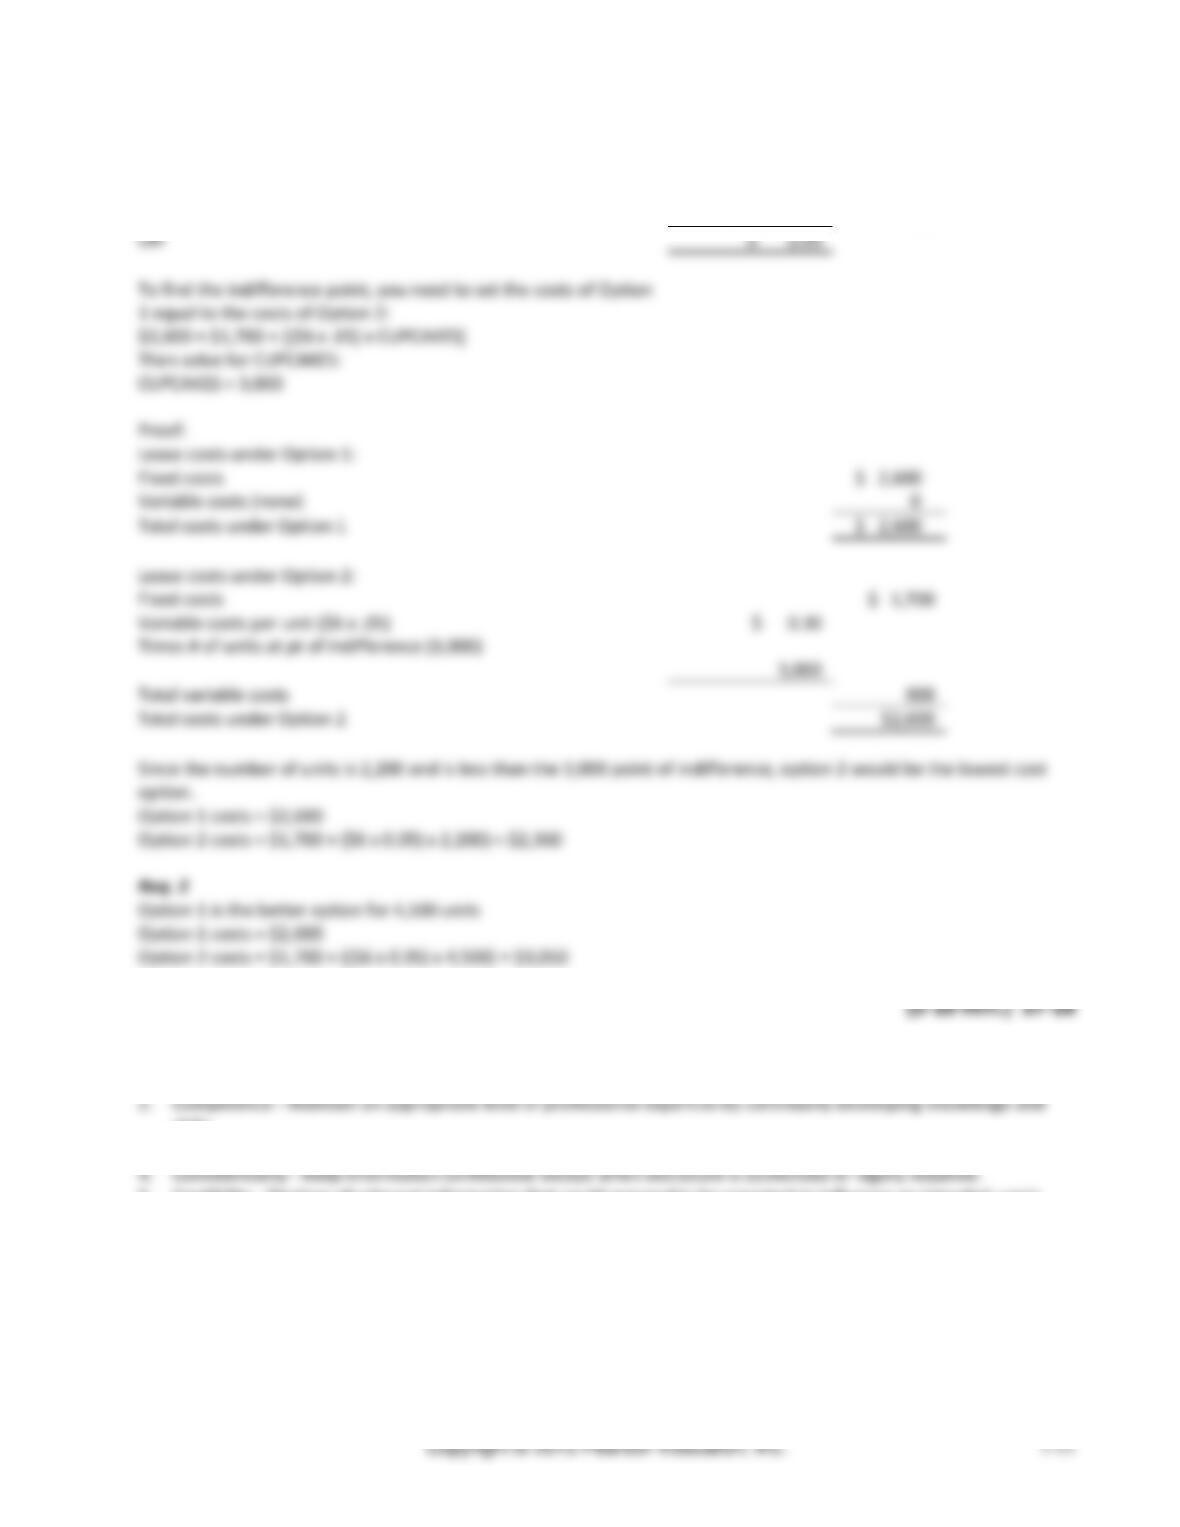
To find the indifference point, you need to set the costs of Option
1 equal to the costs of Option 2:
$2,600 = $1,700 + [($6 x .05) x CUPCAKES]
Then solve for CUPCAKES:
CUPCAKES = 3,000
Proof:
Lease costs under Option 1:
Fixed costs
$ 2,600
Variable costs (none)
0
Total costs under Option 1
$ 2,600
Lease costs under Option 2:
Fixed costs
$ 1,700
Variable costs per unit ($6 x .05)
$ 0.30
Times # of units at pt of indifference (3,000)
3,000
Total variable costs
900
Total costs under Option 2
$2,600
1. Integrity – Mitigate actual conflicts of interest, regularly communicate with business associates to avoid apparent
conflicts of interest. Advise all parties of any potential conflicts.
skills.
3. Competence – Perform professional duties in accordance with relevant laws, regulations, and technical standards.
5. Credibility – Disclose all relevant information that could reasonably be expected to influence an intended user’s
understanding of the reports, analyses, or recommendations.
Copyright © 2015 Pearson Education, Inc.
7-12
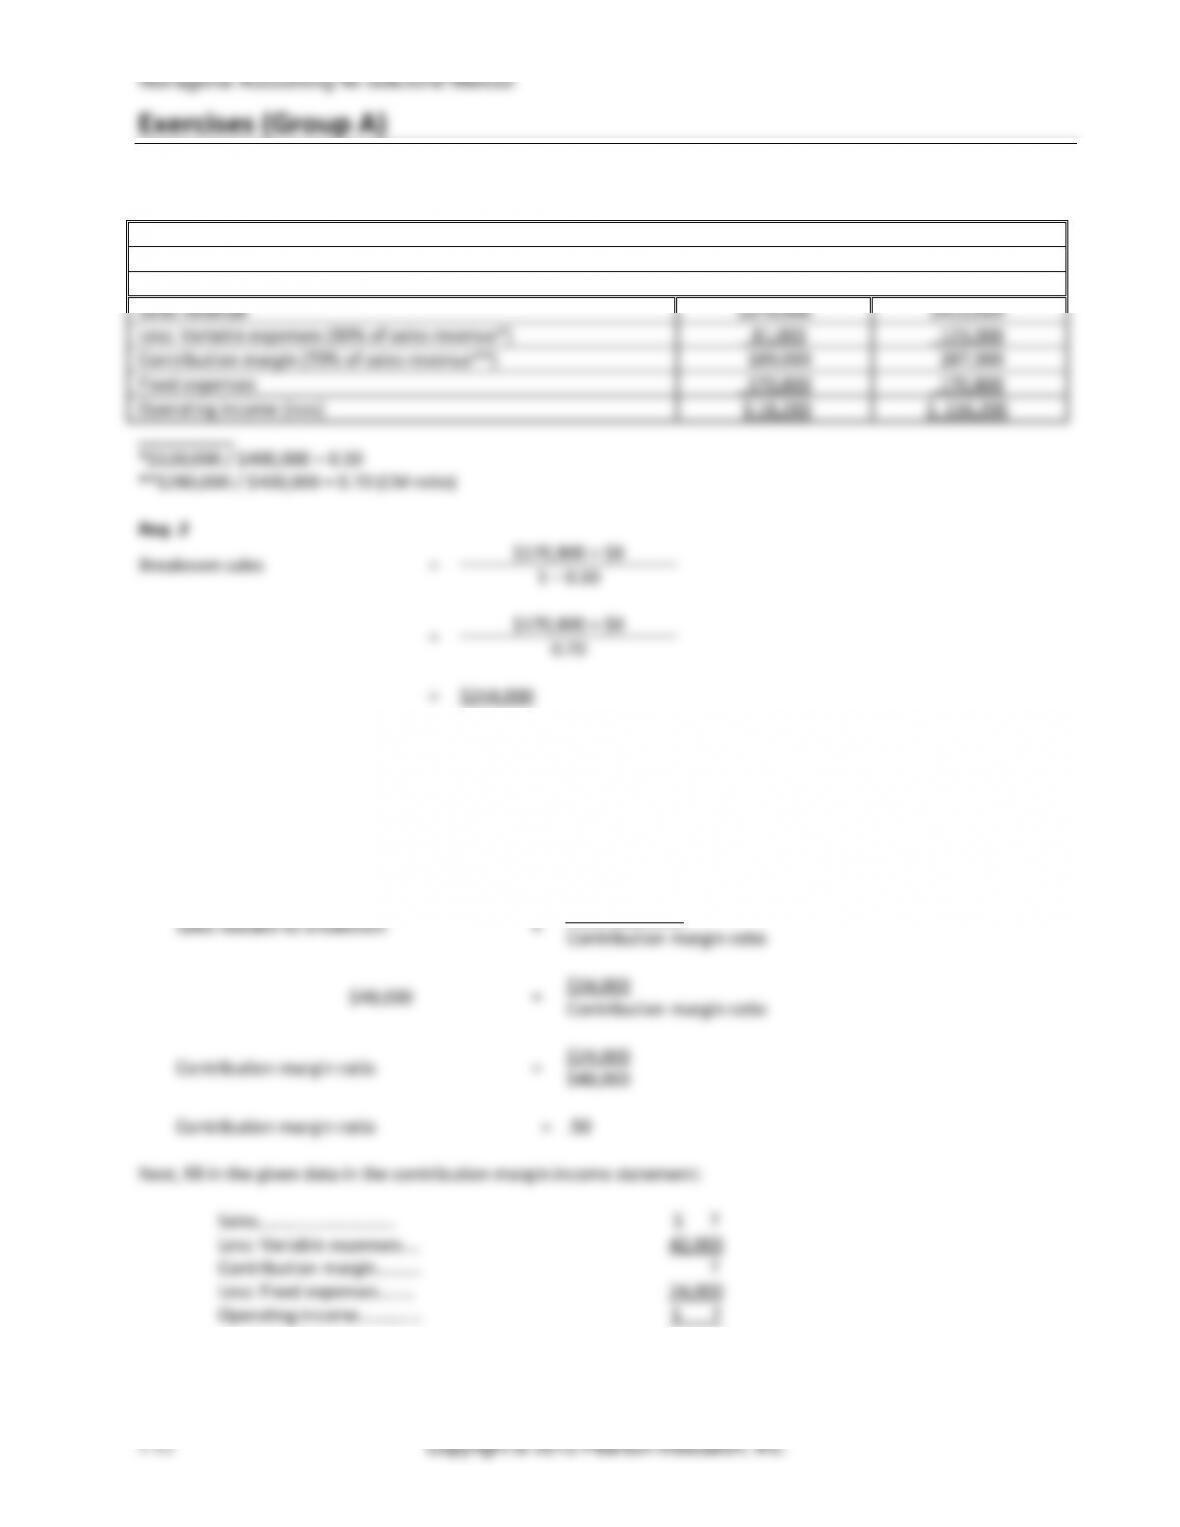
(15 min.) E7-17A
Req. 1
Global Travel
Contribution Margin Income Statements
Sales revenue
$270,000
$410,000
Less: Variable expenses (30% of sales revenue*)
81,000
123,000
Contribution margin (70% of sales revenue**)
189,000
287,000
Fixed expenses
170,800
170,800
Operating income (loss)
$ 18,200
$ 116,200
__________
*$120,000 / $400,000 = 0.30
**$280,000 / $400,000 = 0.70 (CM ratio)
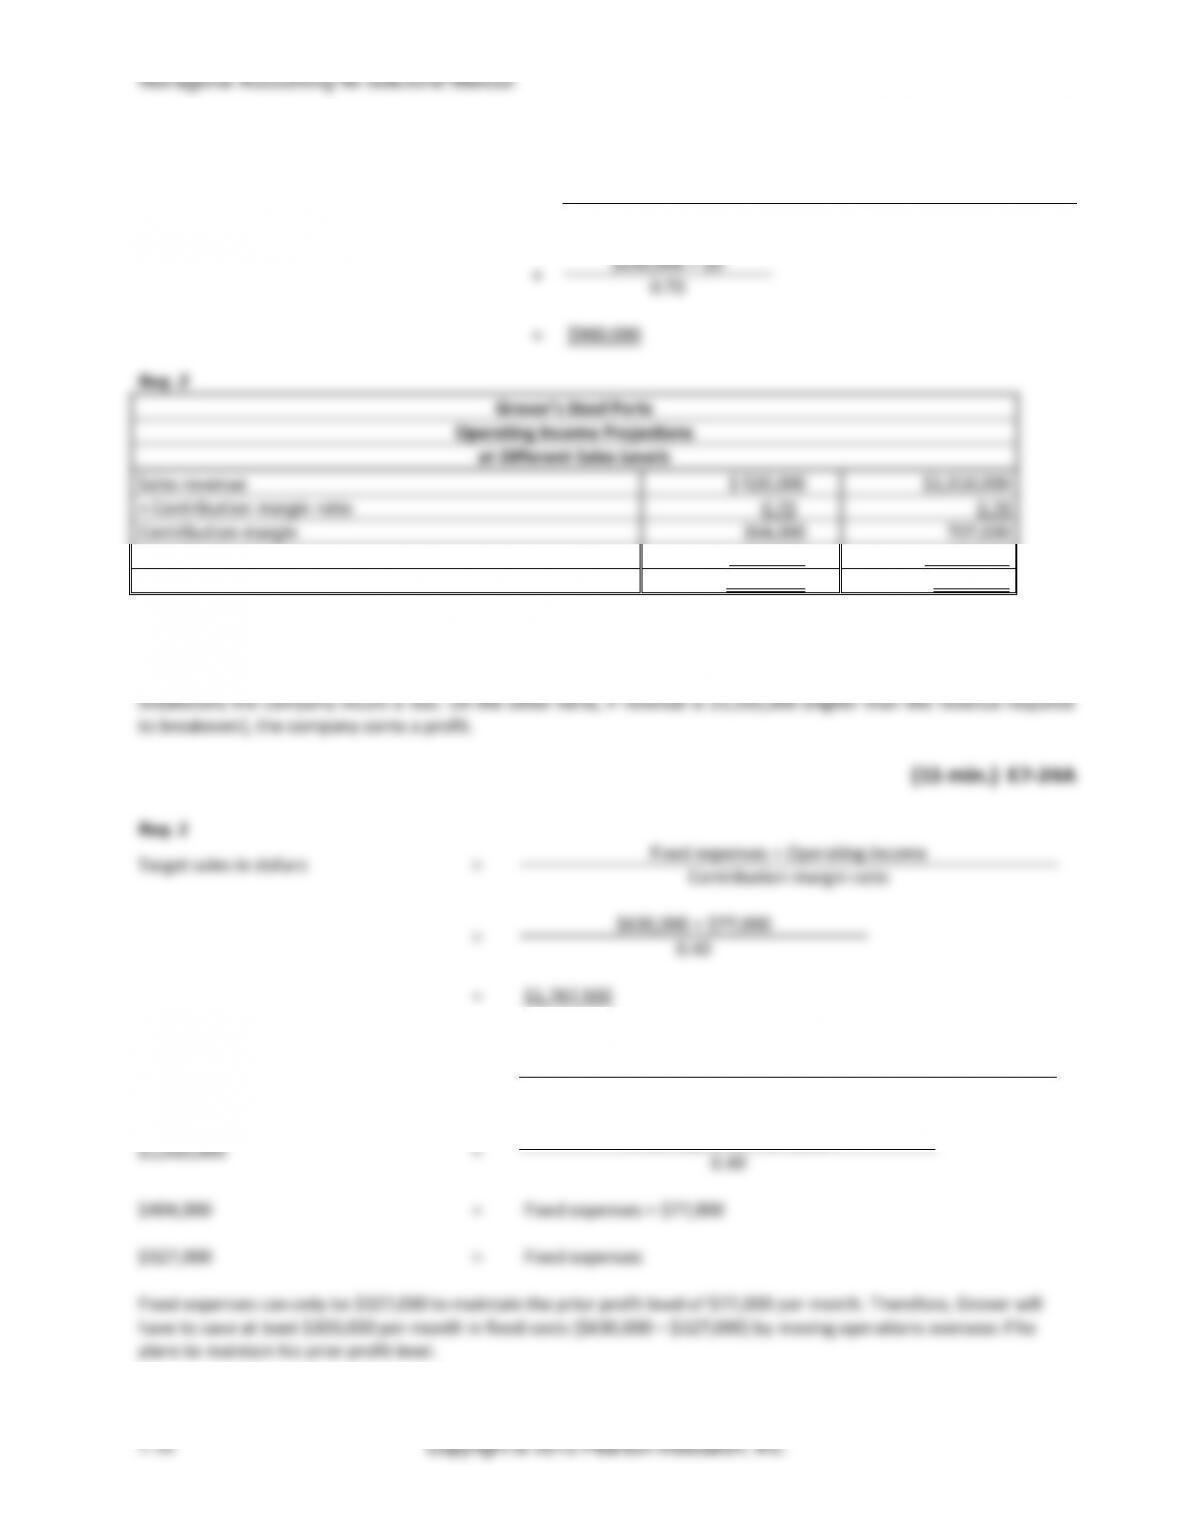
Req. 2
Breakeven sales
=
$170,800 + $0
1 − 0.30
=
$170,800 + $0
0.70
=
$244,000
(10-15 min.) E7-18A
This problem involves working backwards through the shortcut contribution margin formula and then working
backwards through the contribution margin income statement to find the missing data.
First, fill in the given data in the short cut contribution margin formula, and solve for the contribution margin ratio:
Sales needed to breakeven
=
Fixed expenses
Contribution margin ratio
$48,000
=
$24,000
Contribution margin ratio
Contribution margin ratio
=
$24,000
$48,000
Contribution margin ratio
=
.50
Next, fill in the given data in the contribution margin income statement:
Sales………………………….
$ ?
Less: Variable expenses….
42,000
Contribution margin……….
?
Less: Fixed expenses……..
24,000
Operating income…………..
$ ?
Chapter 7 Cost-Volume-Profit Analysis
(continued) E7-18A
Because the contribution margin ratio is 50% of sales revenue, the variable expenses must be 50% of sales revenue.
Therefore:
Variable expenses
=
50% × Sales revenue
$ 42,000
=
50% × Sales revenue
$ 84,000
=
Sales revenue
Sales − $42,000
=
50% Sales
Sales − 50% Sales
=
$42,000
50% Sales
=
$42,000
Sales
=
$42,000
50%
Sales
=
$84,000
Sales……………………………….
$ 84,000
Less: Variable expenses……….
42,000
Contribution margin…………….
$ 42,000
Less: Fixed expenses…………..
24,000
Operating income……………….
$ 18,000
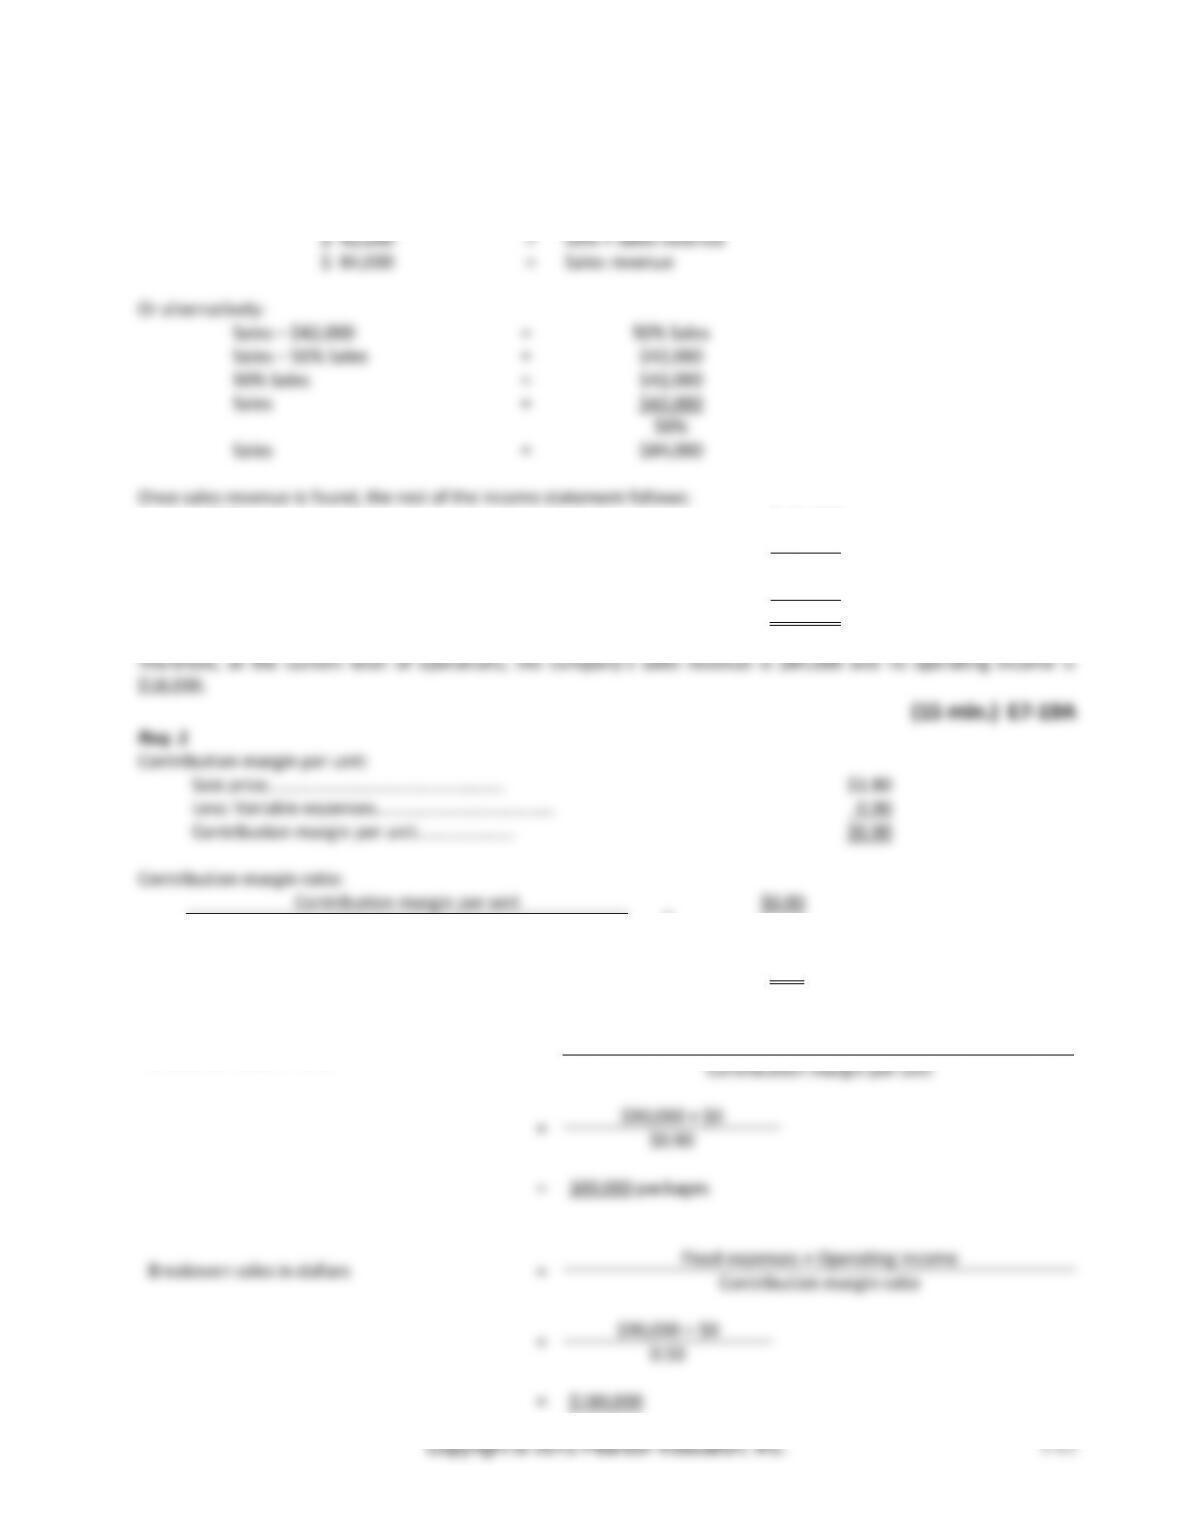
Sale price………………….………..……………..
$1.80
Less: Variable expenses………………….………..….
0.90
Contribution margin per unit…………..……
$0.90
Contribution margin ratio:
Contribution margin per unit
=
$0.90
Sale price per unit
$1.80
=
0.50
Req. 2
Breakeven sales in units
=
Fixed expenses + Operating income
Contribution margin per unit
=
$90,000 + $0
$0.90
=
100,000 packages
Breakeven sales in dollars
=
Fixed expenses + Operating income
Contribution margin ratio
=
$90,000 + $0
0.50
=
$180,000
Managerial Accounting 4e Solutions Manual
(continued) E7-19A
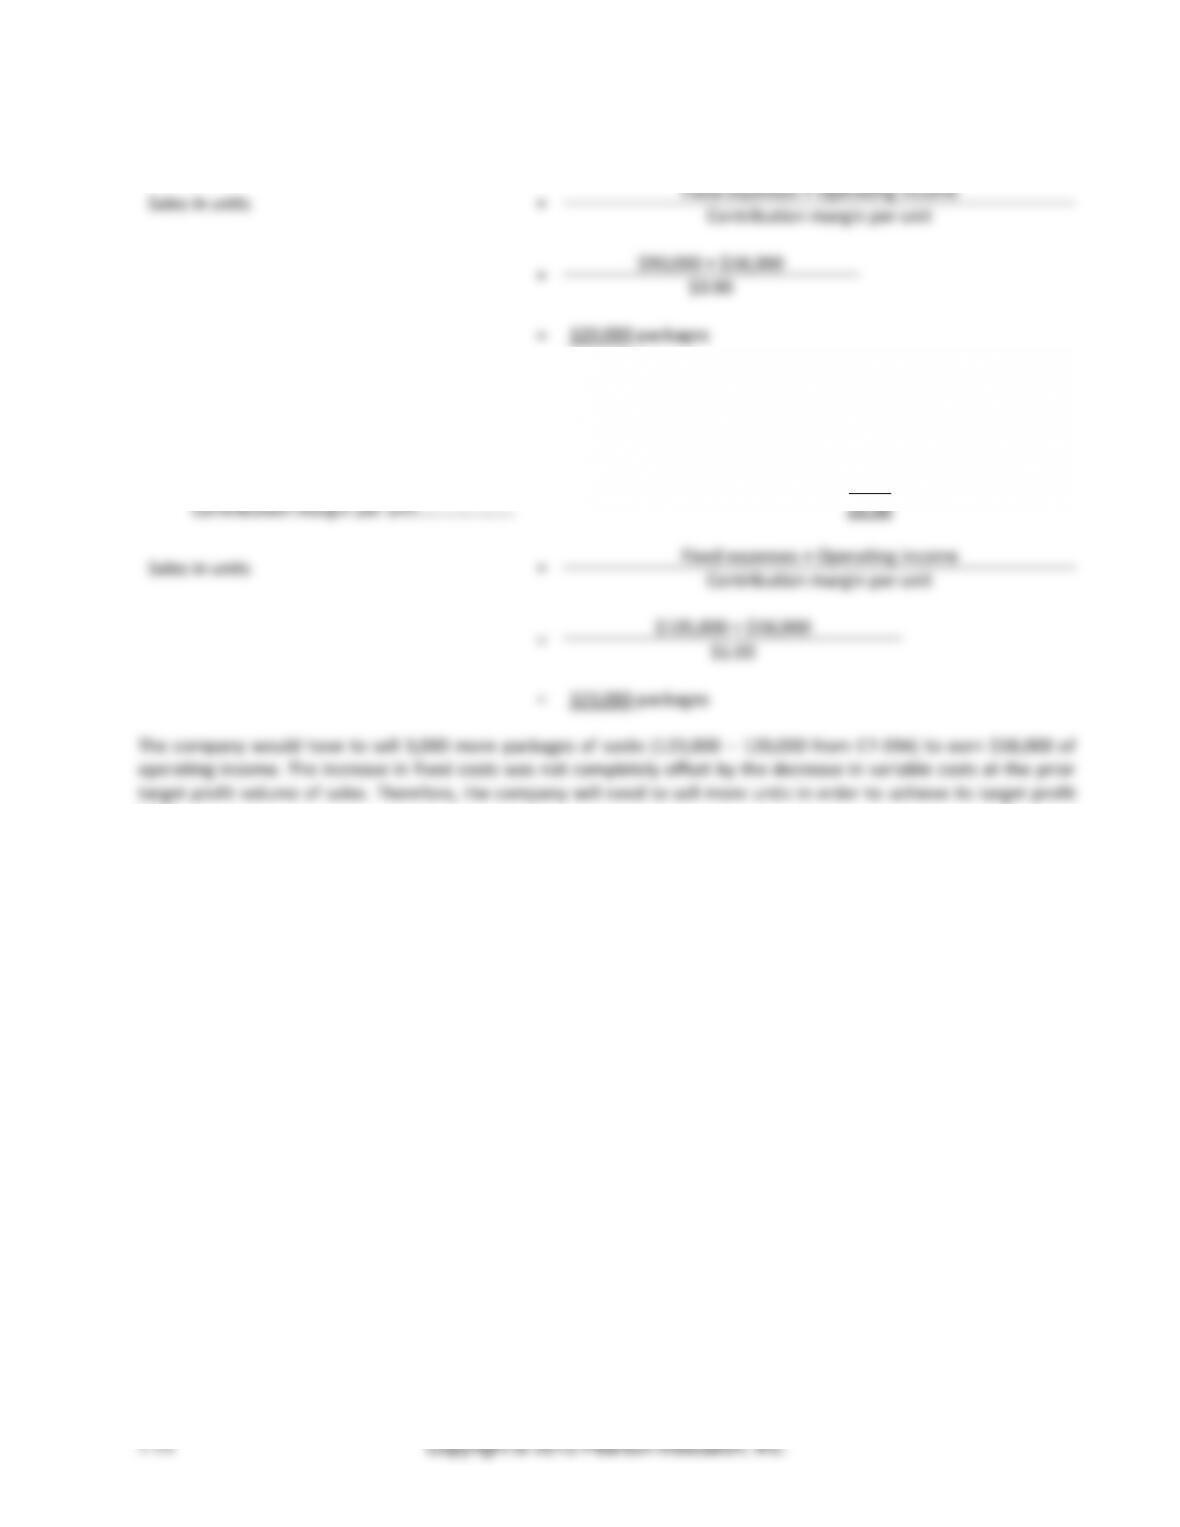
Req. 3
Sales in units
=
Fixed expenses + Operating income
Contribution margin per unit
=
$90,000 + $18,000
$0.90
=
120,000 packages
(5-10 min.) E7-20A
New contribution margin per unit:
Sales price……………………………...…………..
$1.80
Less: Variable expenses………………….………..….
0.80
Contribution margin per unit…..……………
$1.00
Sales in units
=
Fixed expenses + Operating income
Contribution margin per unit
=
$1.00
=
123,000 packages
level.
Chapter 7 Cost-Volume-Profit Analysis
(10-15 min.) E7-21A
Req. 1
Contribution
=
Contribution margin per unit
margin ratio
Sales price per unit
=
$5.25 − $2.10
$5.25
=
0.60
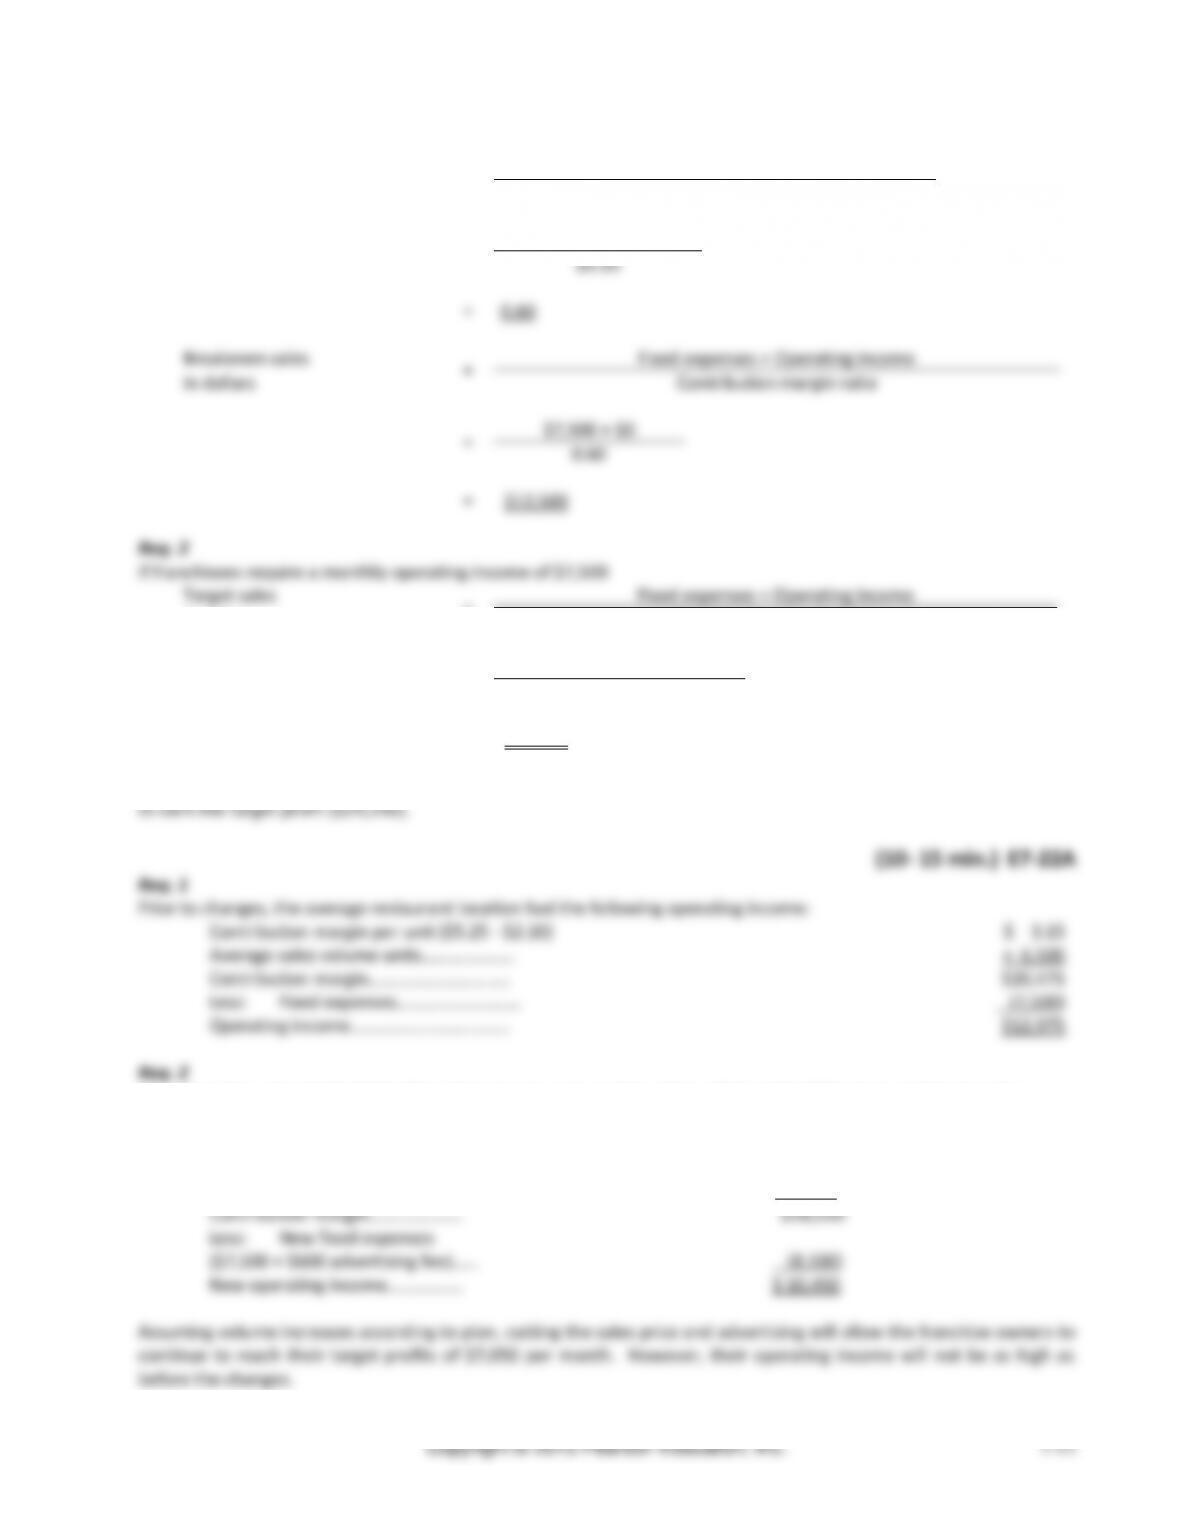
Breakeven sales
=
Fixed expenses + Operating income
in dollars
Contribution margin ratio
=
$7,500 + $0
0.60
=
$12,500
Target sales
=
Fixed expenses + Operating income
in dollars
Contribution margin ratio
=
$7,500 + $7,050
0.60
=
$24,250
Yes, the franchising concept is a good idea. Most locations are expected to sell more ($25,000) than the sales required
Contribution margin per unit ($5.25 – $2.10)
$ 3.15
Average sales volume units…………………
× 6,500
Contribution margin…………………………..
$20,475
Less: Fixed expenses……………………….
(7,500)
Operating income………………………………
$12,975
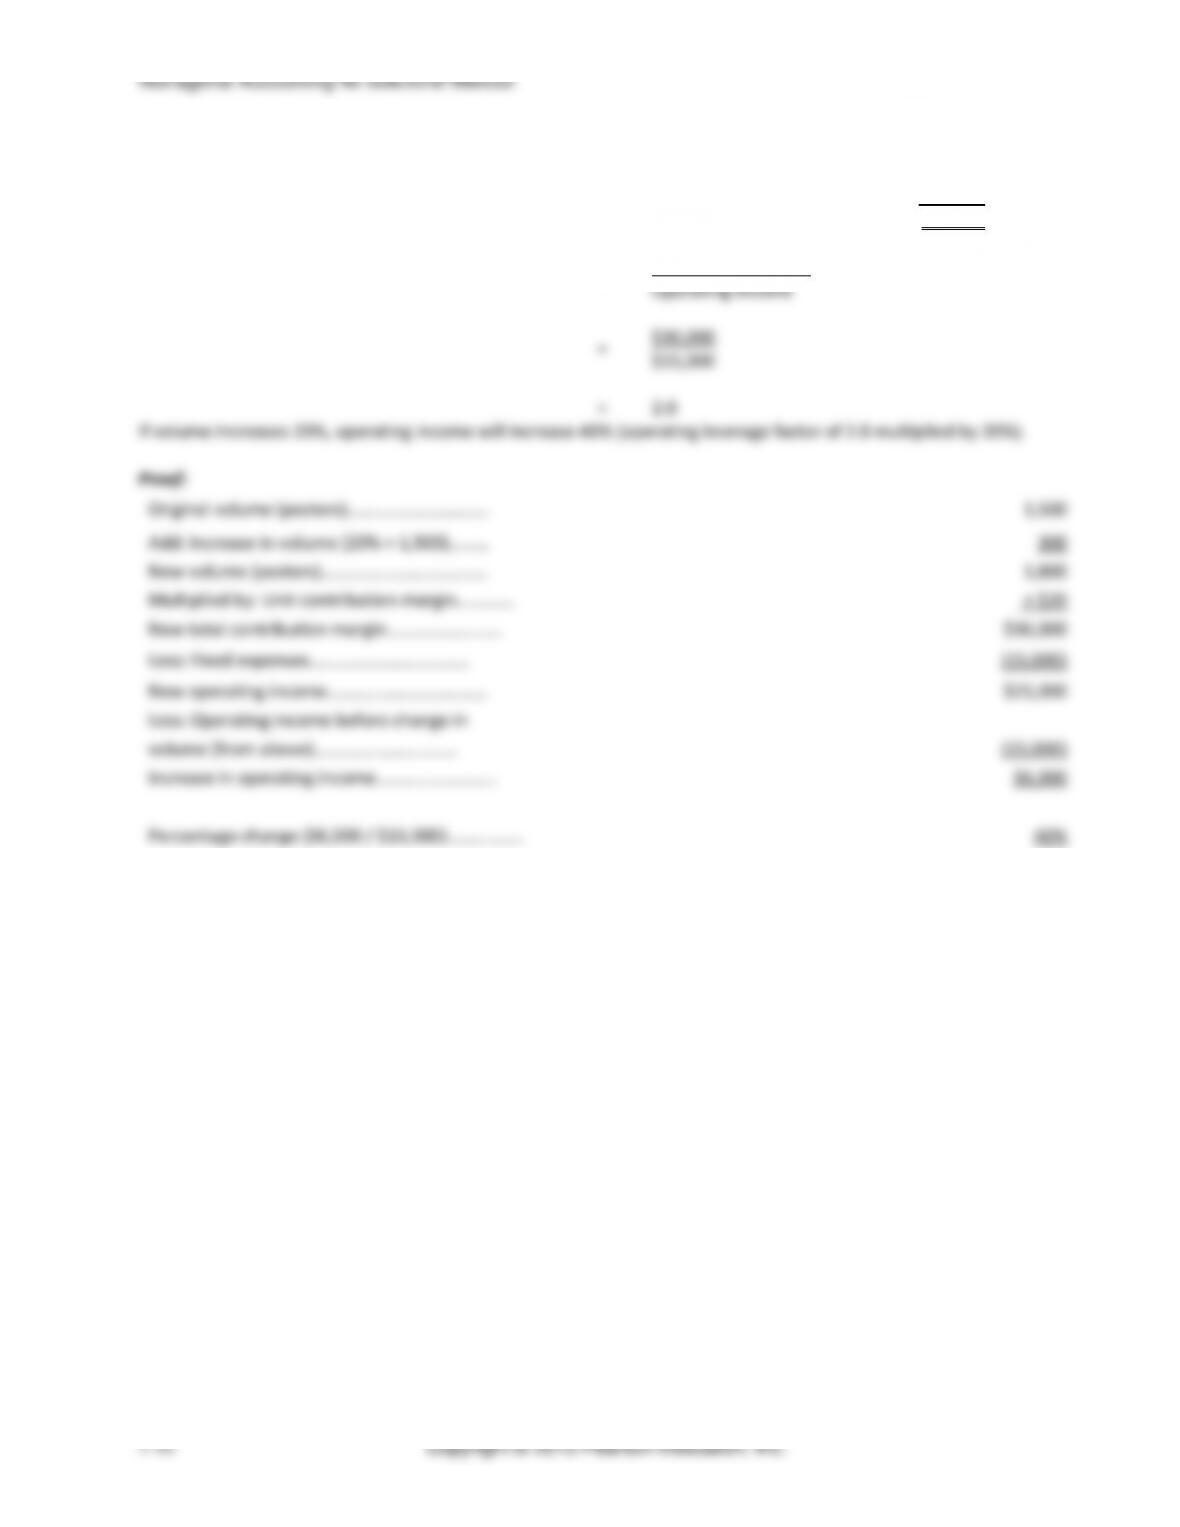
Req. 2
After the price cut and advertising fees, the average restaurant location will have the following operating income:
New contribution margin per unit ($4.75 sales price – $2.10
variable cost…………………………………….
$ 2.65
New sales volume (units)………….
× 7,000
Contribution margin…………………
$18,550
Less: New fixed expenses
($7,500 + $600 advertising fee)……
(8,100)
New operating income……………..
$ 10,450
Assuming volume increases according to plan, cutting the sales price and advertising will allow the franchise owners to
continue to reach their target profits of $7,050 per month. However, their operating income will not be as high as
before the changes.
Chapter 7 Cost-Volume-Profit Analysis
(15-20 min.) E7-25A
Req. 1
(Fixed expenses + Operating income) / CM per unit = Breakeven in units
($240,000 + $0) / ($2,400 – $1,000 – $200) = 200 units
(Fixed expenses + Operating income) / CM ratio = Breakeven in sales dollars
Chapter 7 Cost-Volume-Profit Analysis
(15-20 min.) E7-28A
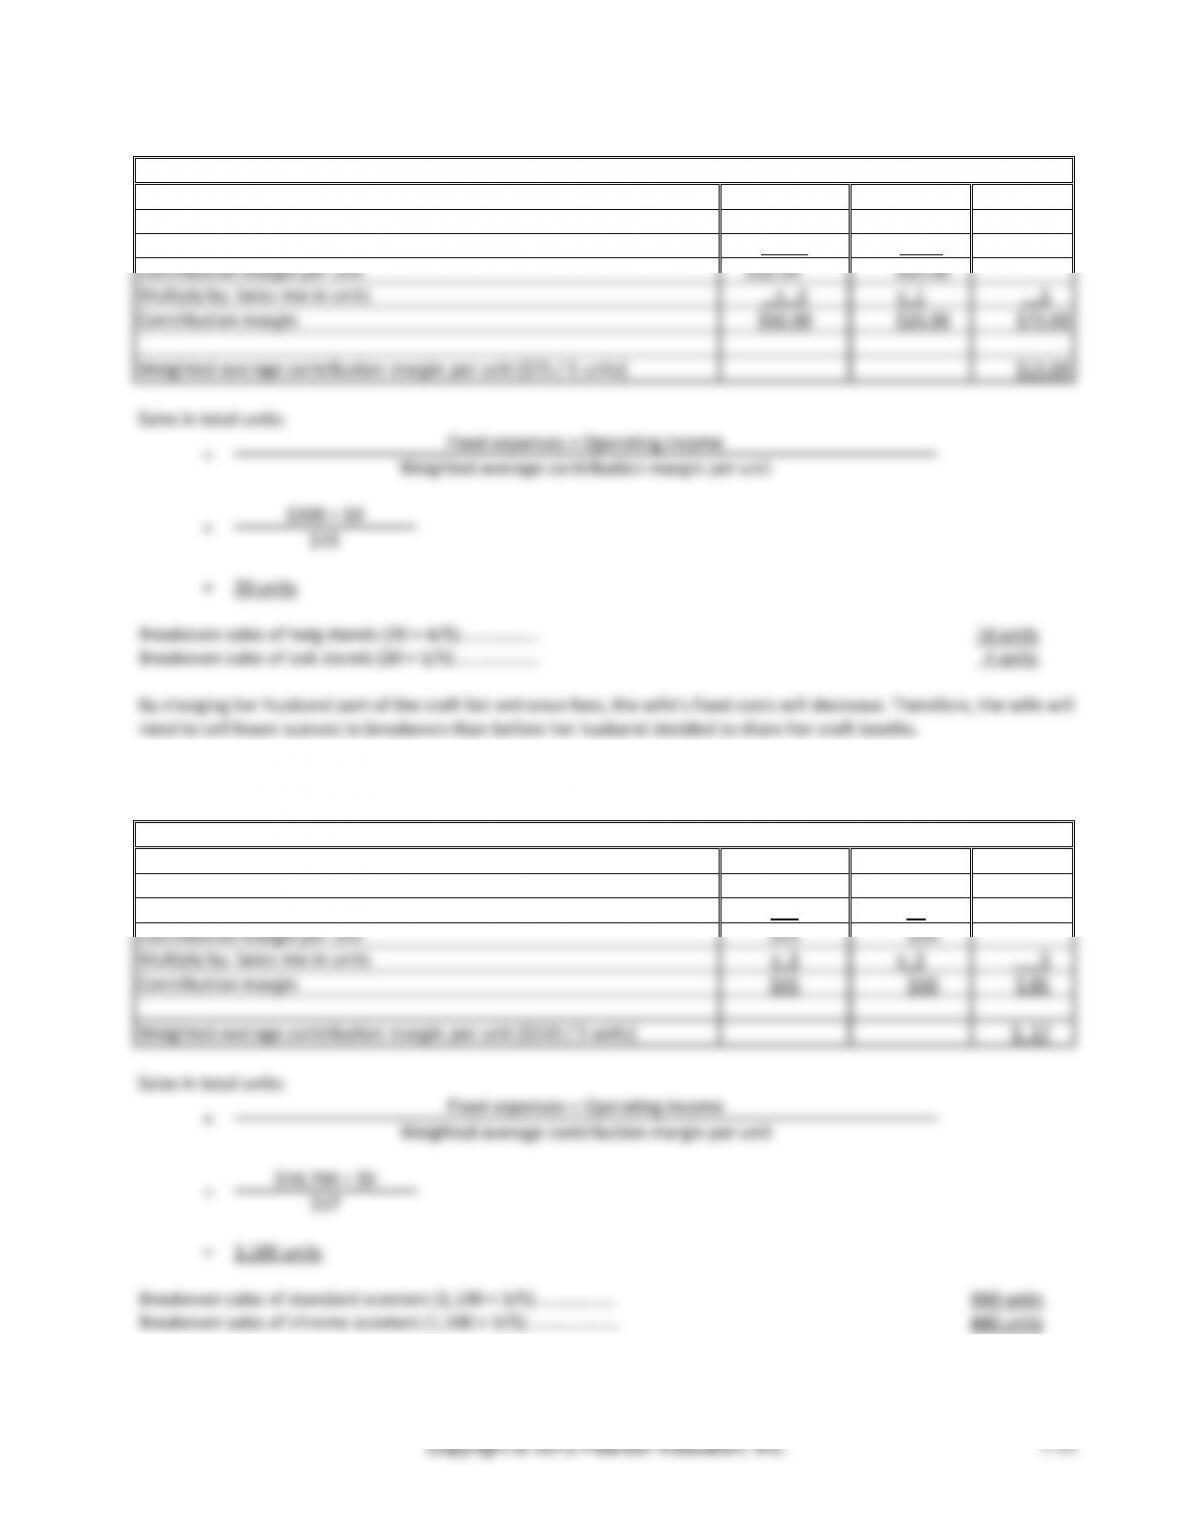
Weighted-Average Contribution Margin per Unit
Twig
Oak
Total
Sale price per unit
$15.00
$35.00
Less: Variable cost per unit
2.50
10.00
Contribution margin per unit
$12.50
$25.00
Multiply by: Sales mix in units
× 4
× 1
5
Contribution margin
$50.00
$25.00
$75.00
Weighted-average contribution margin per unit ($75 / 5 units)
$15.00
Fixed expenses + Operating income
Weighted-average contribution margin per unit
=
$15
=
20 units
Breakeven sales of twig stands (20 × 4/5)………………
Breakeven sales of oak stands (20 × 1/5).………………
(15-20 min.) E7-29A
Weighted-Average Contribution Margin per Unit
Standard
Chrome
Total
Sales price per unit
$60
$75
Less: Variable cost per unit
45
55
Contribution margin per unit
$15
$20
Multiply by: Sales mix in units
× 3
× 2
5
Contribution margin
$45
$40
$ 85
Weighted-average contribution margin per unit ($110 / 5 units)
$ 17
Sales in total units:
=
Fixed expenses + Operating income
Weighted-average contribution margin per unit
=
$18,700 + $0
$17
=
1,100 units
Breakeven sales of standard scooters (1,100 × 3/5)………………
660 units
Breakeven sales of chrome scooters (1,100 × 2/5).………………..
440 units
Managerial Accounting 4e Solutions Manual
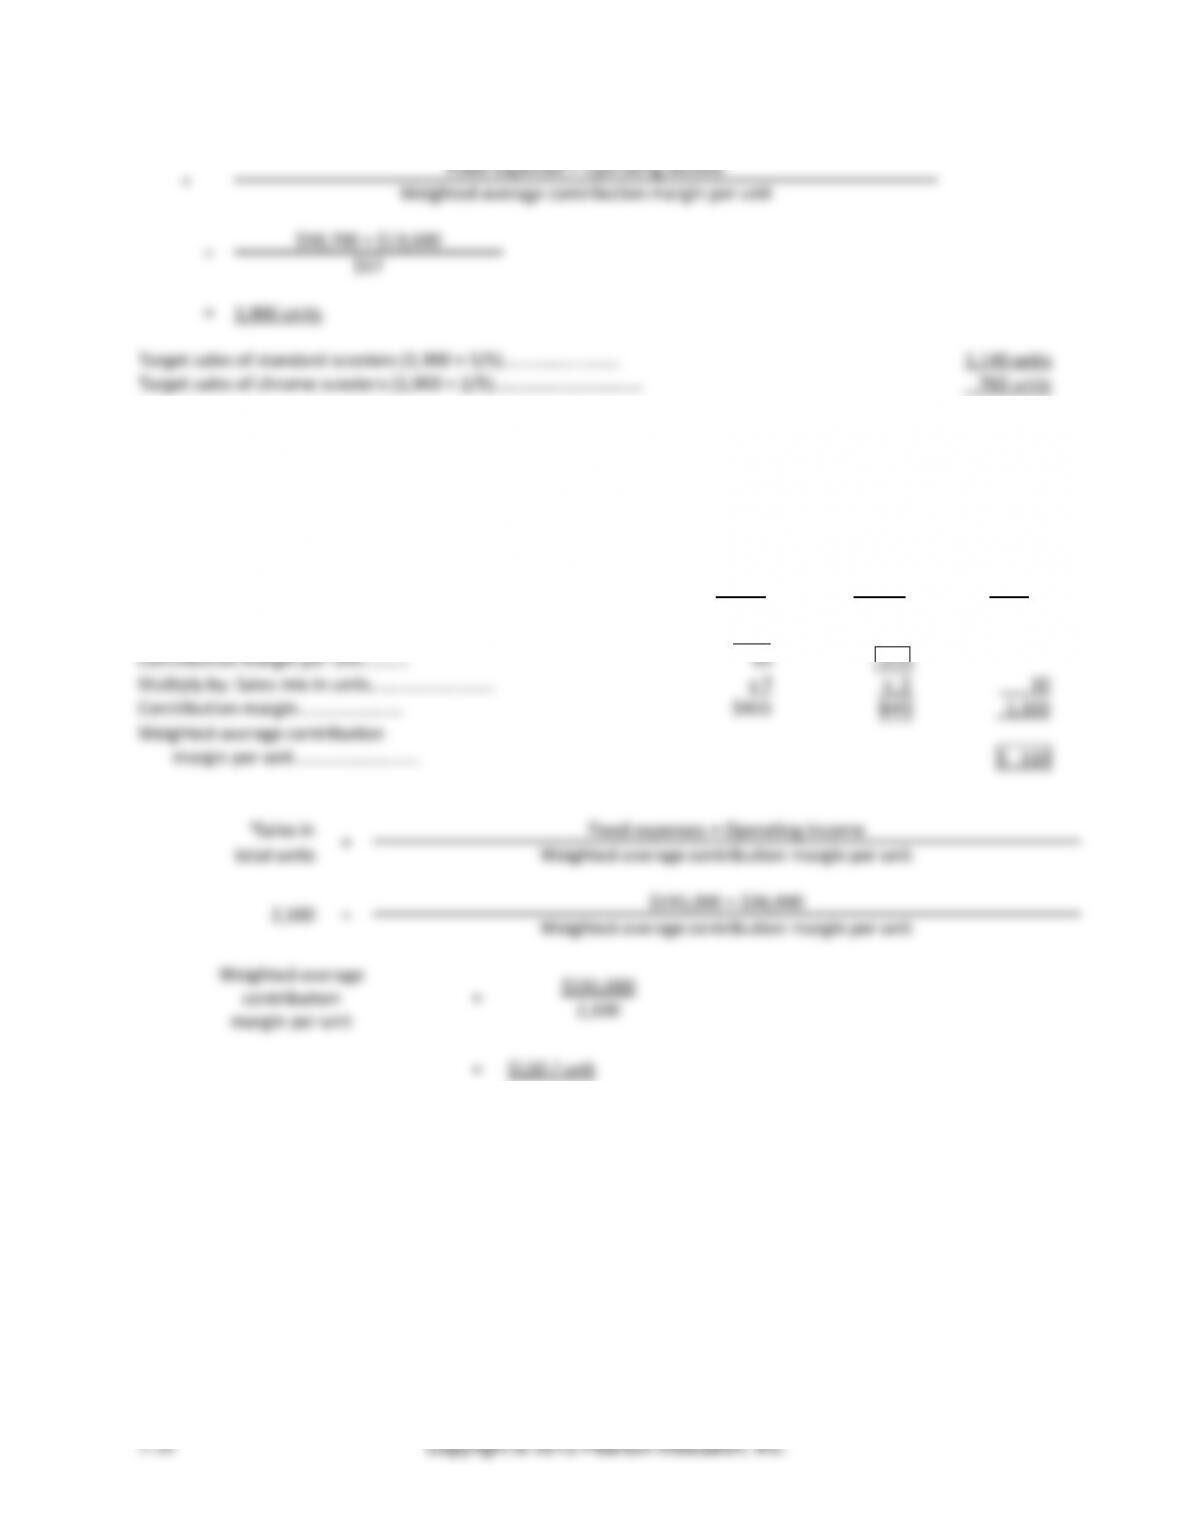
(continued) E7-29A
Sales in total units:
=
Fixed expenses + Operating income
Weighted-average contribution margin per unit
=
$18,700 + $13,600
$17
=
1,900 units
Target sales of standard scooters (1,900 × 3/5)……..………………
1,140 units
Target sales of chrome scooters (1,900 × 2/5)………...……………….
760 units
(20-30 min.) E7-30A
This is a challenging exercise that requires students to work backwards. Use the weighted-average contribution margin
per unit chart, in conjunction with the shortcut formula, to work backwards to find the contribution margin of the
Classic.
Digital
Classic
Total
Sales price per unit……..……..………..
$225
Less: Variable expense per unit. ($125 + $35)
160
Contribution margin per unit..……..
65
215
Multiply by: Sales mix in units……….……………..
x 7
× 3
10
Contribution margin……….………….
$455
645
1,100
Weighted-average contribution
margin per unit……….……………..
$ 110
aSales in
=
Fixed expenses + Operating income
total units
Weighted-average contribution margin per unit
2,100
=
$195,000 + $36,000
Weighted-average contribution margin per unit
Weighted-average
=
$231,000
2,100
contribution
margin per unit
=
$110 / unit