Copyright © 2015 Pearson Education, Inc.
14–19
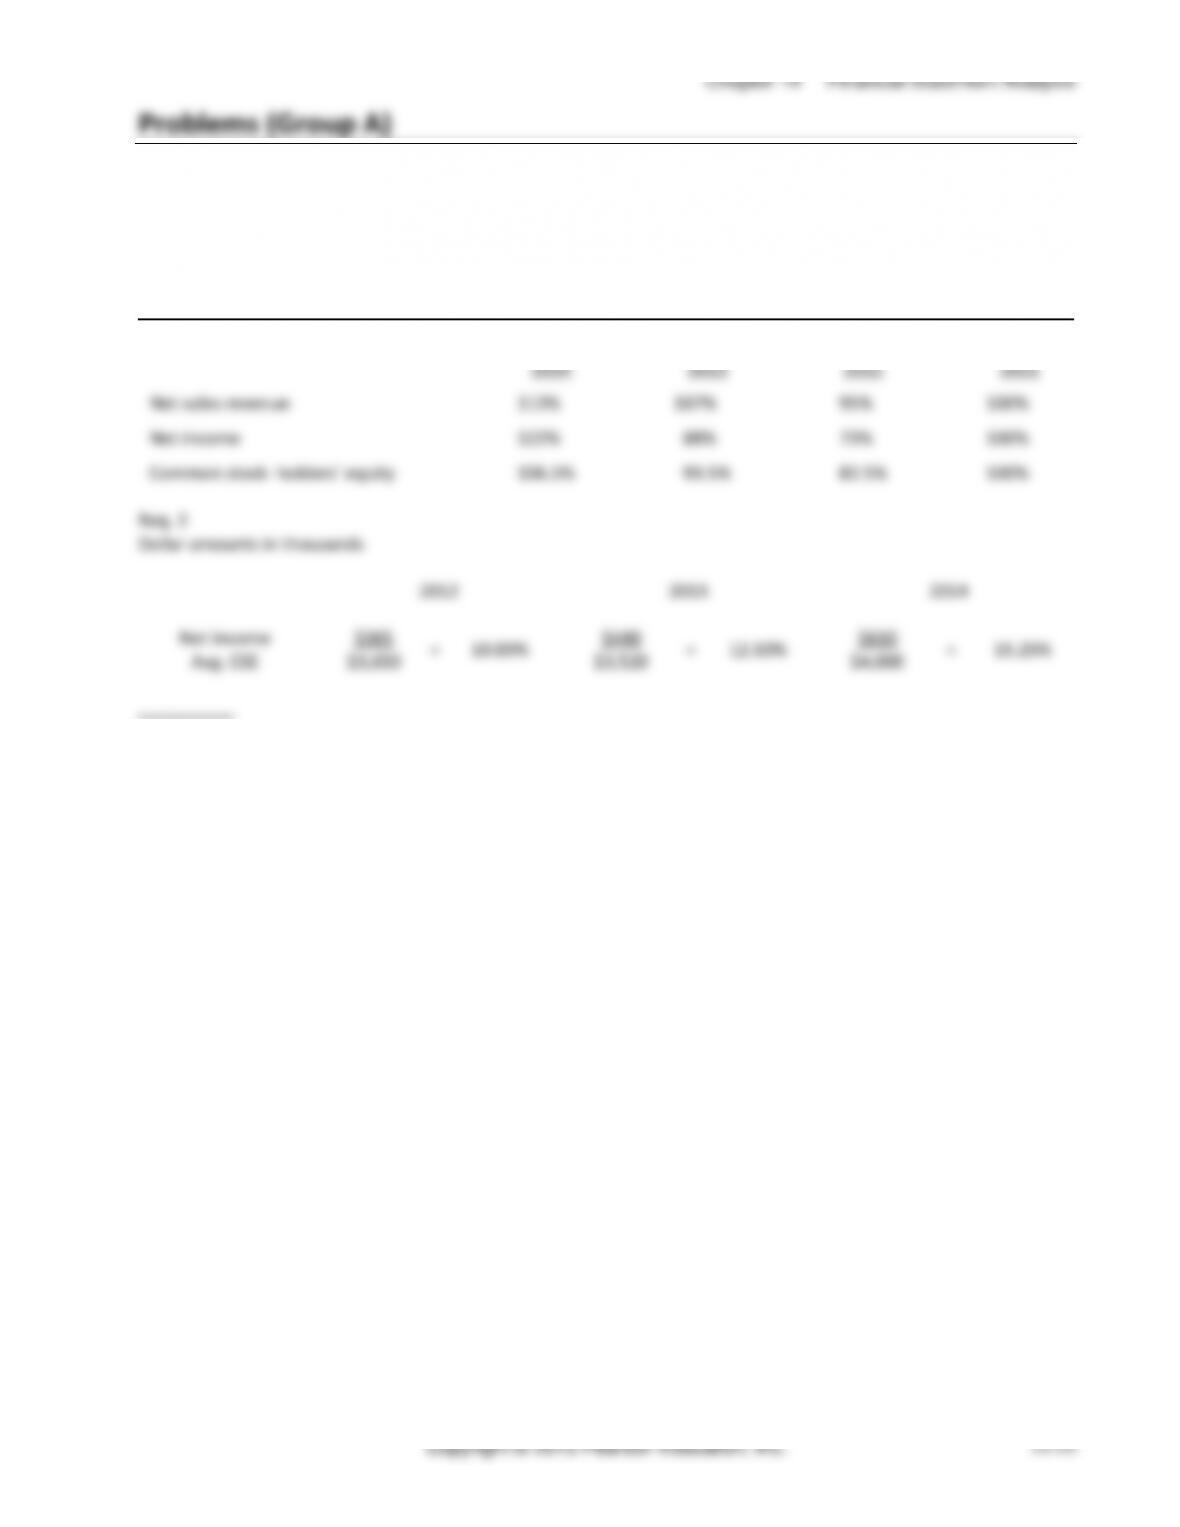
(20-30 min.) P14-33A
Req. 1
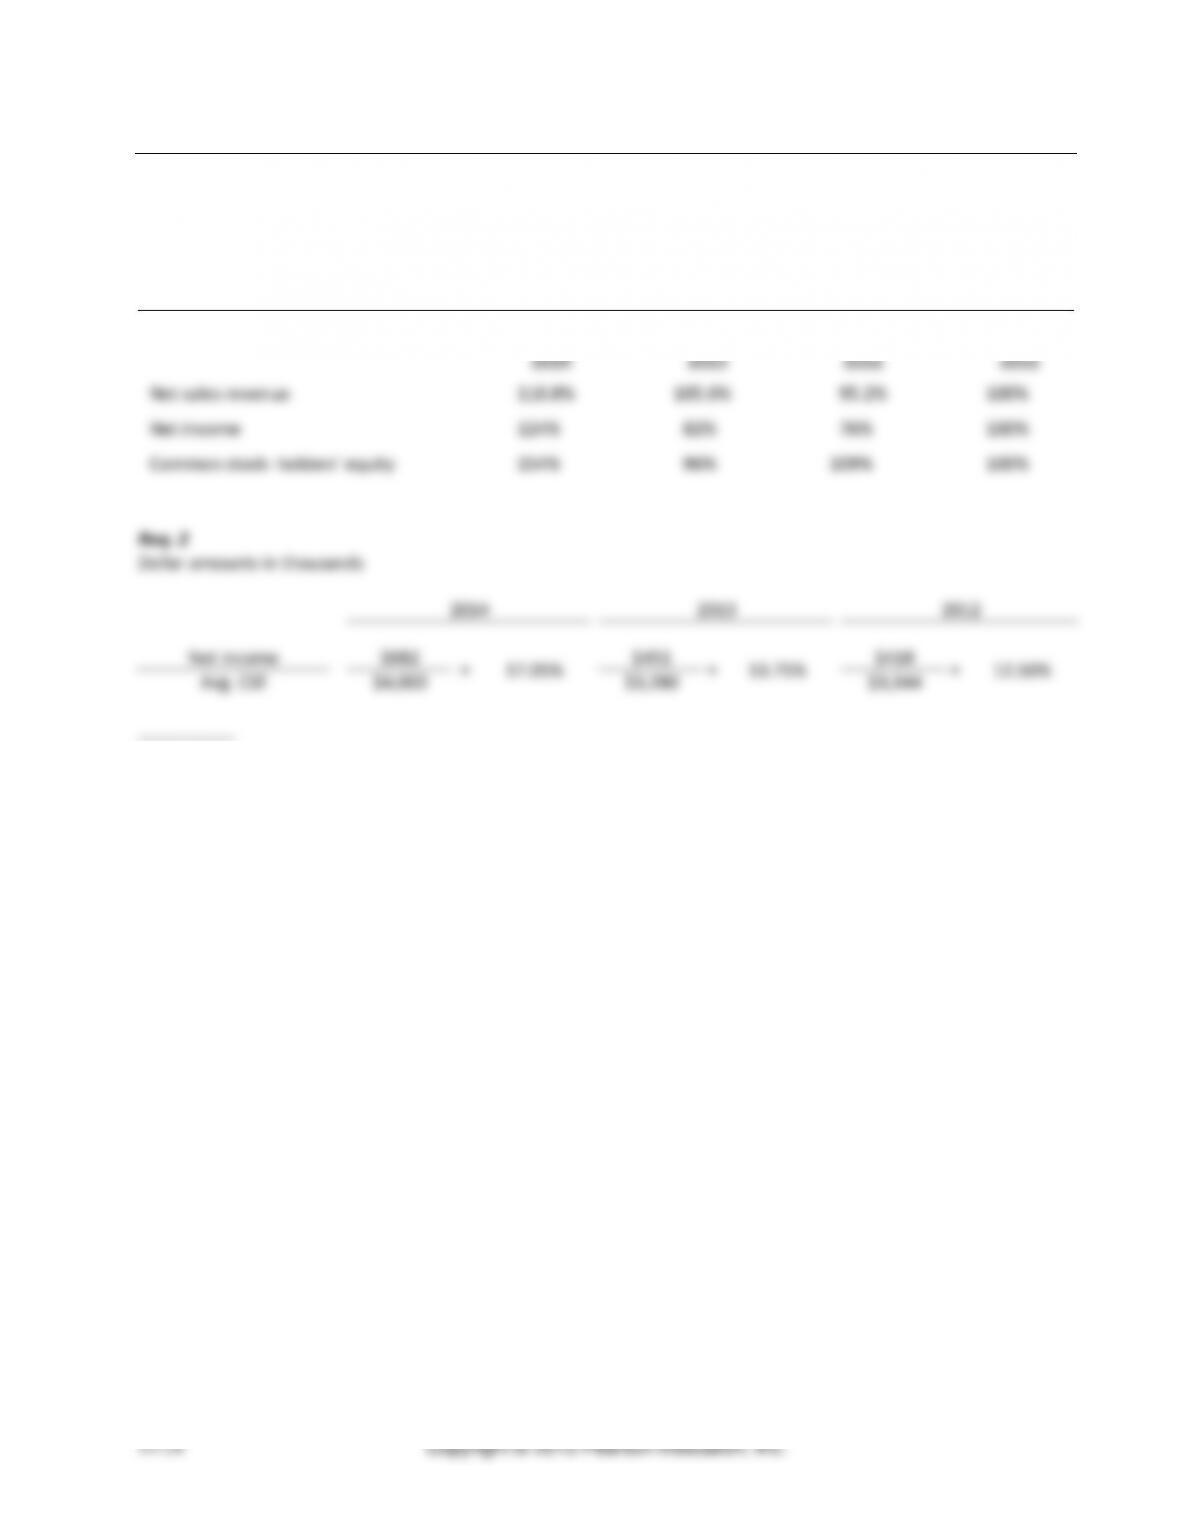
Mirabel Optical Corporation
Trend Percentages
2014
2013
2012
2011
Net sales revenue
113%
107%
95%
100%
Net income
122%
88%
73%
100%
Common stock– holders’ equity
106.5%
93.5%
82.5%
100%
Req. 2
Dollar amounts in thousands
2012
2013
2014
Net income
$365
=
10.00%
$440
=
12.50%
$610
=
15.25%
Avg. CSE
$3,650
$3,520
$4,000
__________
Managerial Accounting 4e Solutions Manual
(20-30 min.) P14-34A
Req. 1
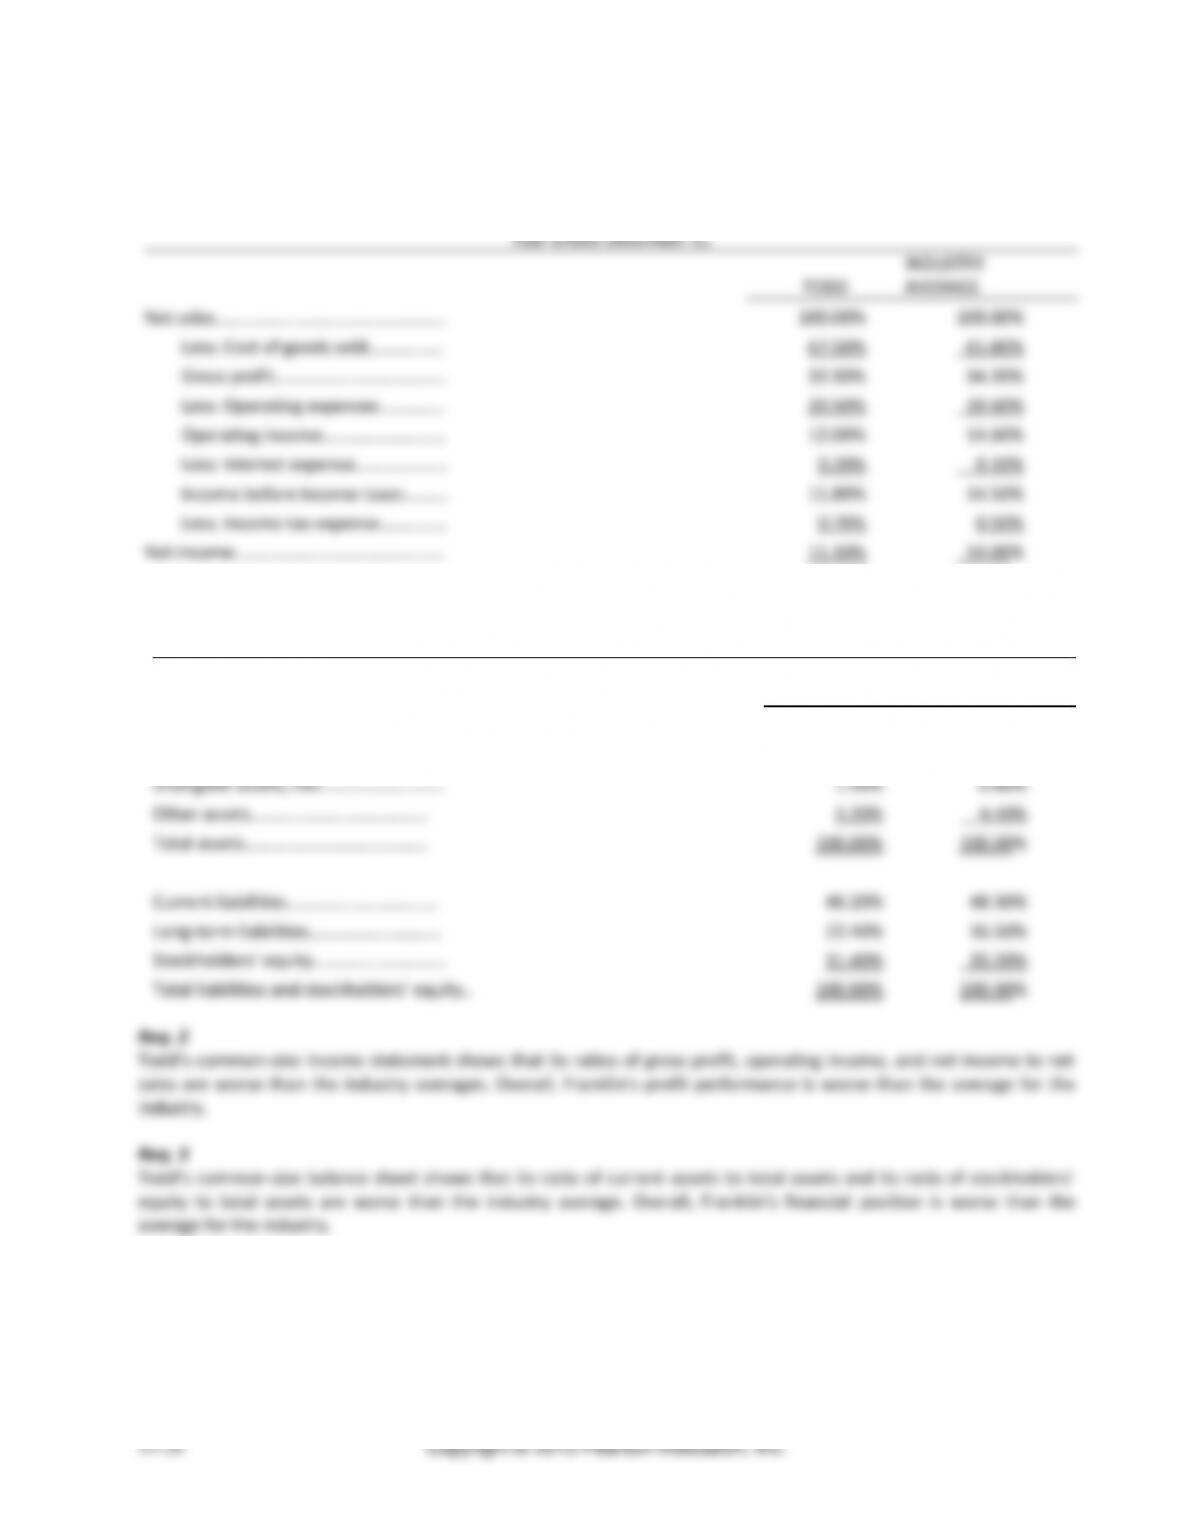
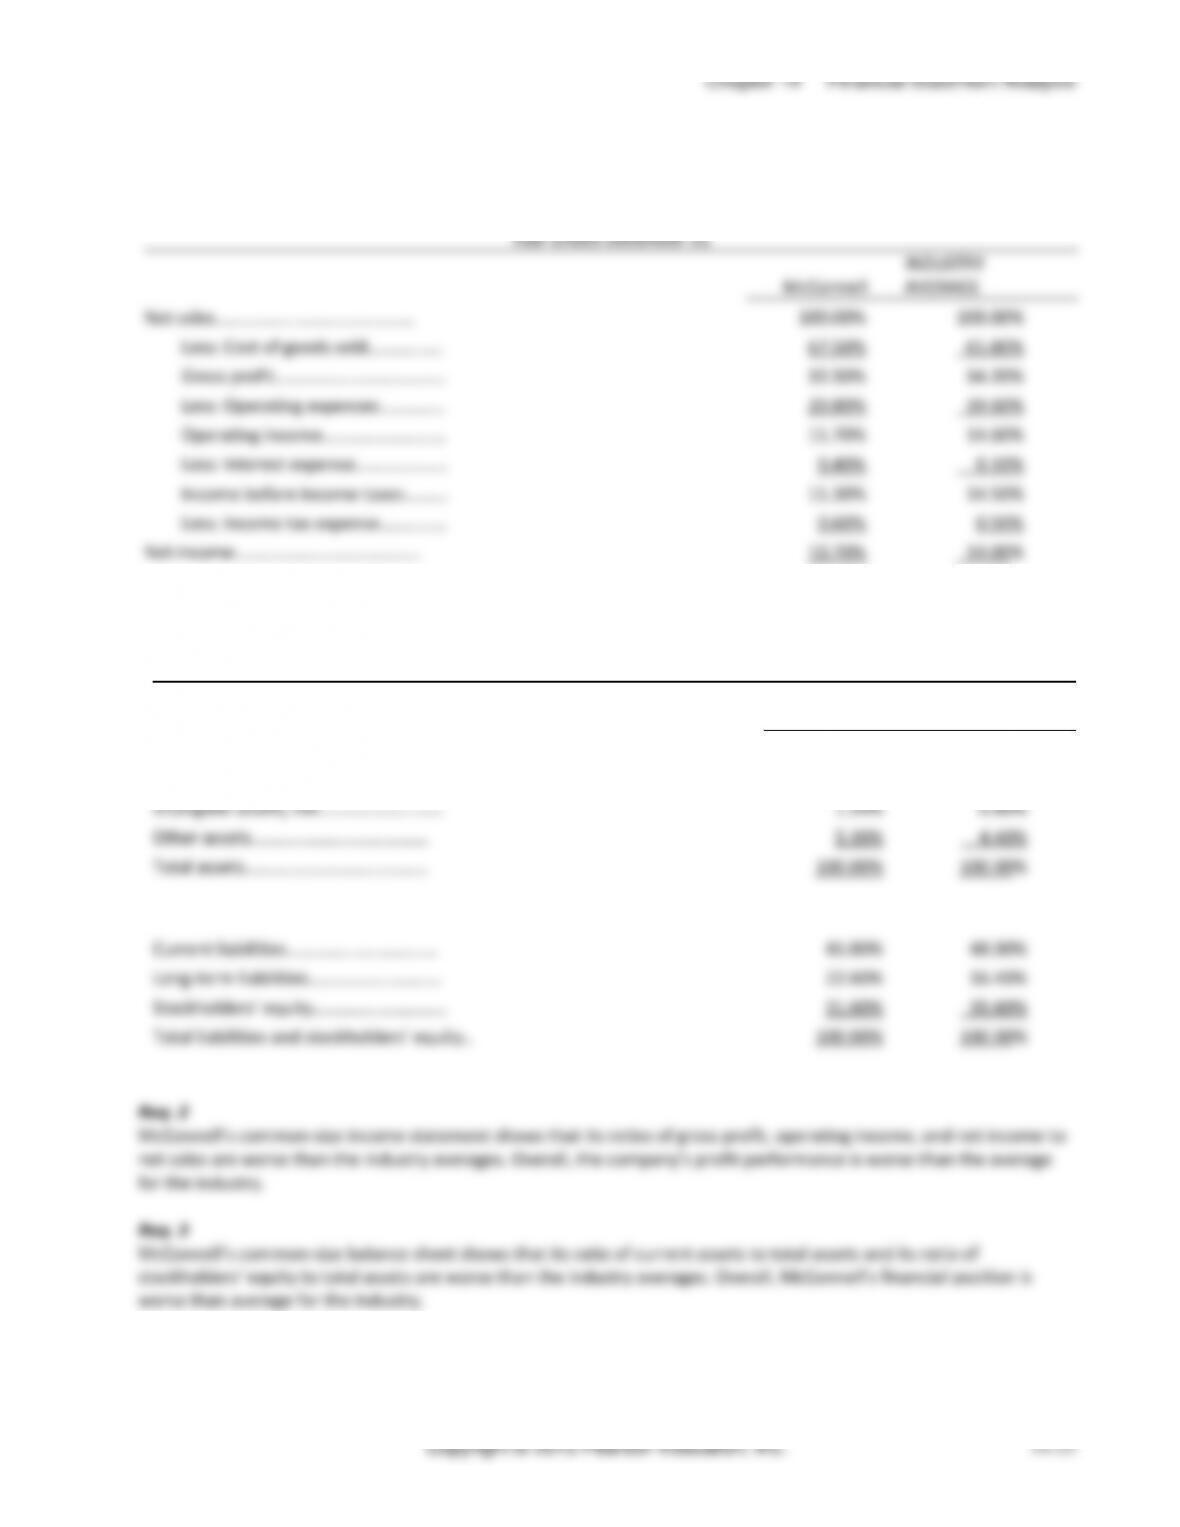
Todd Department Stores, Inc.
Common-Size Income Statement Compared
to Industry Average
Year Ended December 31
TODD
INDUSTRY
AVERAGE
Net sales…………………………………………….
100.00%
100.00%
Less: Cost of goods sold……………..
67.50%
65.80%
Gross profit…………………………………
32.50%
34.20%
Less: Operating expenses……………
20.50%
19.60%
Operating income……………………….
12.00%
14.60%
Less: Interest expense…………………
0.20%
0.10%
Income before income taxes……….
11.80%
14.50%
Less: Income tax expense……………
0.70%
0.50%
Net income………………………………………..
11.10%
14.00%
Todd Department Stores, Inc.
Common-Size Balance Sheet Compared to Industry Average
As of December 31
TODD
INDUSTRY
AVERAGE
Current assets……………………………….
67.70%
70.90%
Fixed assets, net…………………………….
25.60%
24.10%
Intangible assets, net……………………….
1.50%
0.60%
Other assets………………………………….
5.20%
4.40%
Total assets…………………………………..
100.00%
100.00%
Current liabilities…………………………….
46.20%
48.30%
Long-term liabilities…………………………
22.40%
16.50%
Stockholders’ equity…………………………
31.40%
35.20%
Total liabilities and stockholders’ equity..
100.00%
100.00%
Req. 2
Todd’s common-size income statement shows that its ratios of gross profit, operating income, and net income to net
sales are worse than the industry averages. Overall, Franklin’s profit performance is worse than the average for the
industry.
Req. 3
Todd’s common–size balance sheet shows that its ratio of current assets to total assets and its ratio of stockholders’
equity to total assets are worse than the industry average. Overall, Franklin’s financial position is worse than the
average for the industry.
Managerial Accounting 4e Solutions Manual
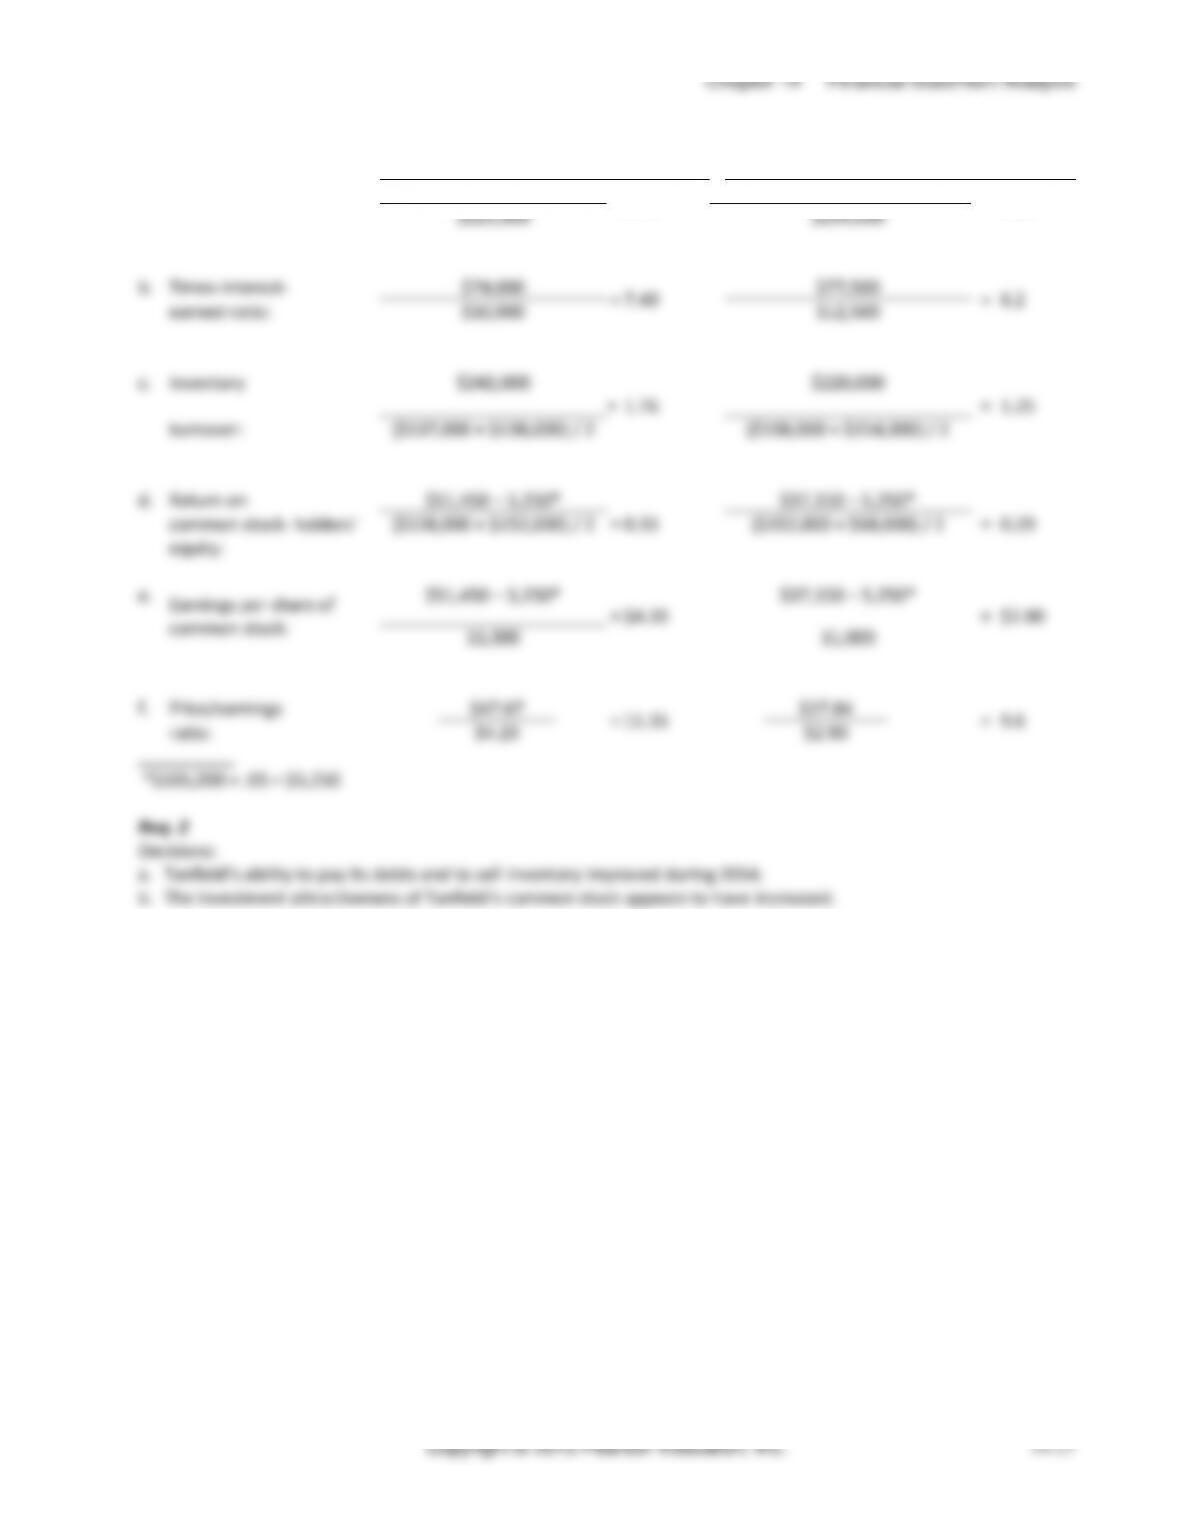
(40-50 min.) P14-36A
Req. 1
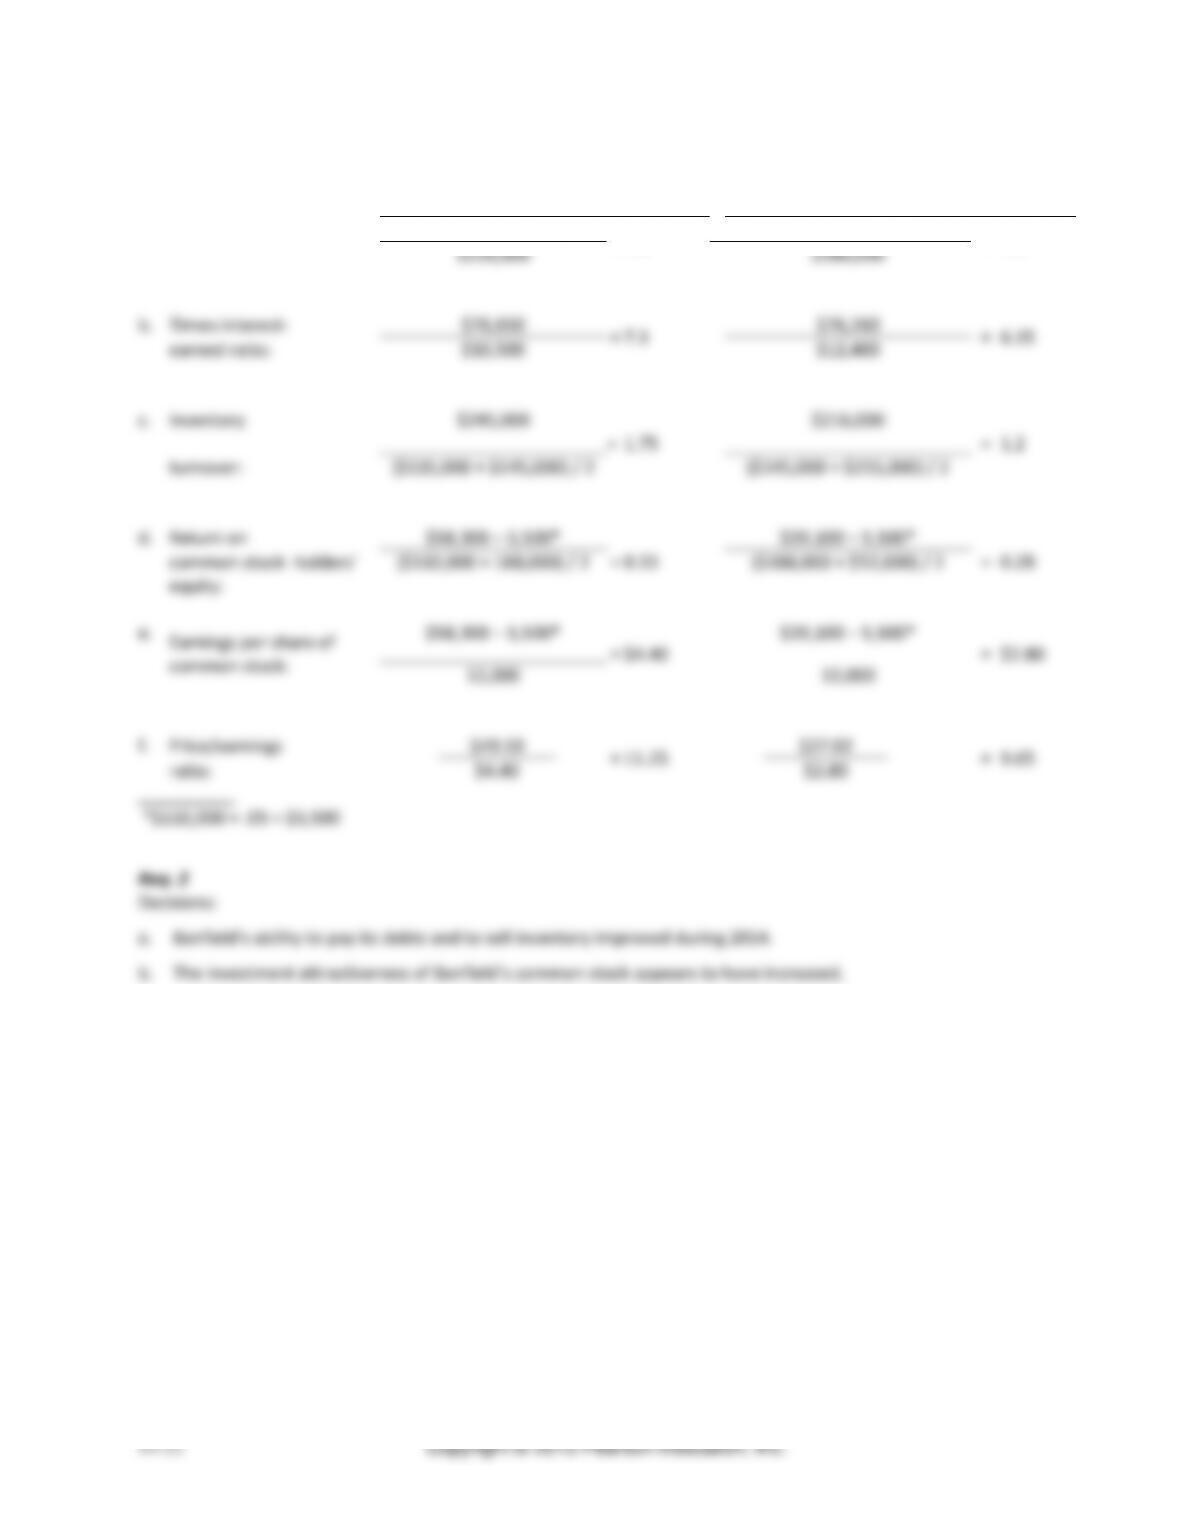
2014
2013
a.
Current ratio:
$352,000
=
1.6
$390,000
=
1.5
$220,000
$260,000
b.
Times-interest-
$76,650
=
7.3
$76,260
=
6.15
earned ratio:
$10,500
$12,400
c.
Inventory
$245,000
=
1.75
$216,000
=
1.2
turnover:
($135,000 + $145,000) / 2
($145,000 + $215,000) / 2
d.
Return on
$58,300 − 5,500*
=
0.33
$39,100 − 5,500*
=
0.28
common stock- holders’
equity:
($132,000 + 188,000) / 2
($188,000 + $52,000) / 2
e.
Earnings per share of
common stock:
$58,300 − 5,500*
=
$4.40
$39,100 − 5,500*
=
$2.80
12,000
12,000
f.
Price/earnings
$49.50
=
11.25
$27.02
=
9.65
ratio:
$4.40
$2.80
__________
*$110,000 × .05 = $5,500
Req. 2
Decisions:
a. Banfield’s ability to pay its debts and to sell inventory improved during 2014.
b. The investment attractiveness of Banfield’s common stock appears to have increased.
Managerial Accounting 4e Solutions Manual
Problems (Group B)
(20-30 min.) P14-38B
Req. 1
Eyesight Vision Corporation
Trend Percentages
2014
2013
2012
2011
Net sales revenue
110.8%
105.6%
95.2%
100%
Net income
124%
82%
76%
100%
Common stock– holders’ equity
154%
96%
109%
100%
Req. 2
Dollar amounts in thousands
2014
2013
2012
Net income
$682
=
17.05%
$451
=
13.75%
$418
=
12.50%
Avg. CSE
$4,000
$3,280
$3,344
__________
Managerial Accounting 4e Solutions Manual
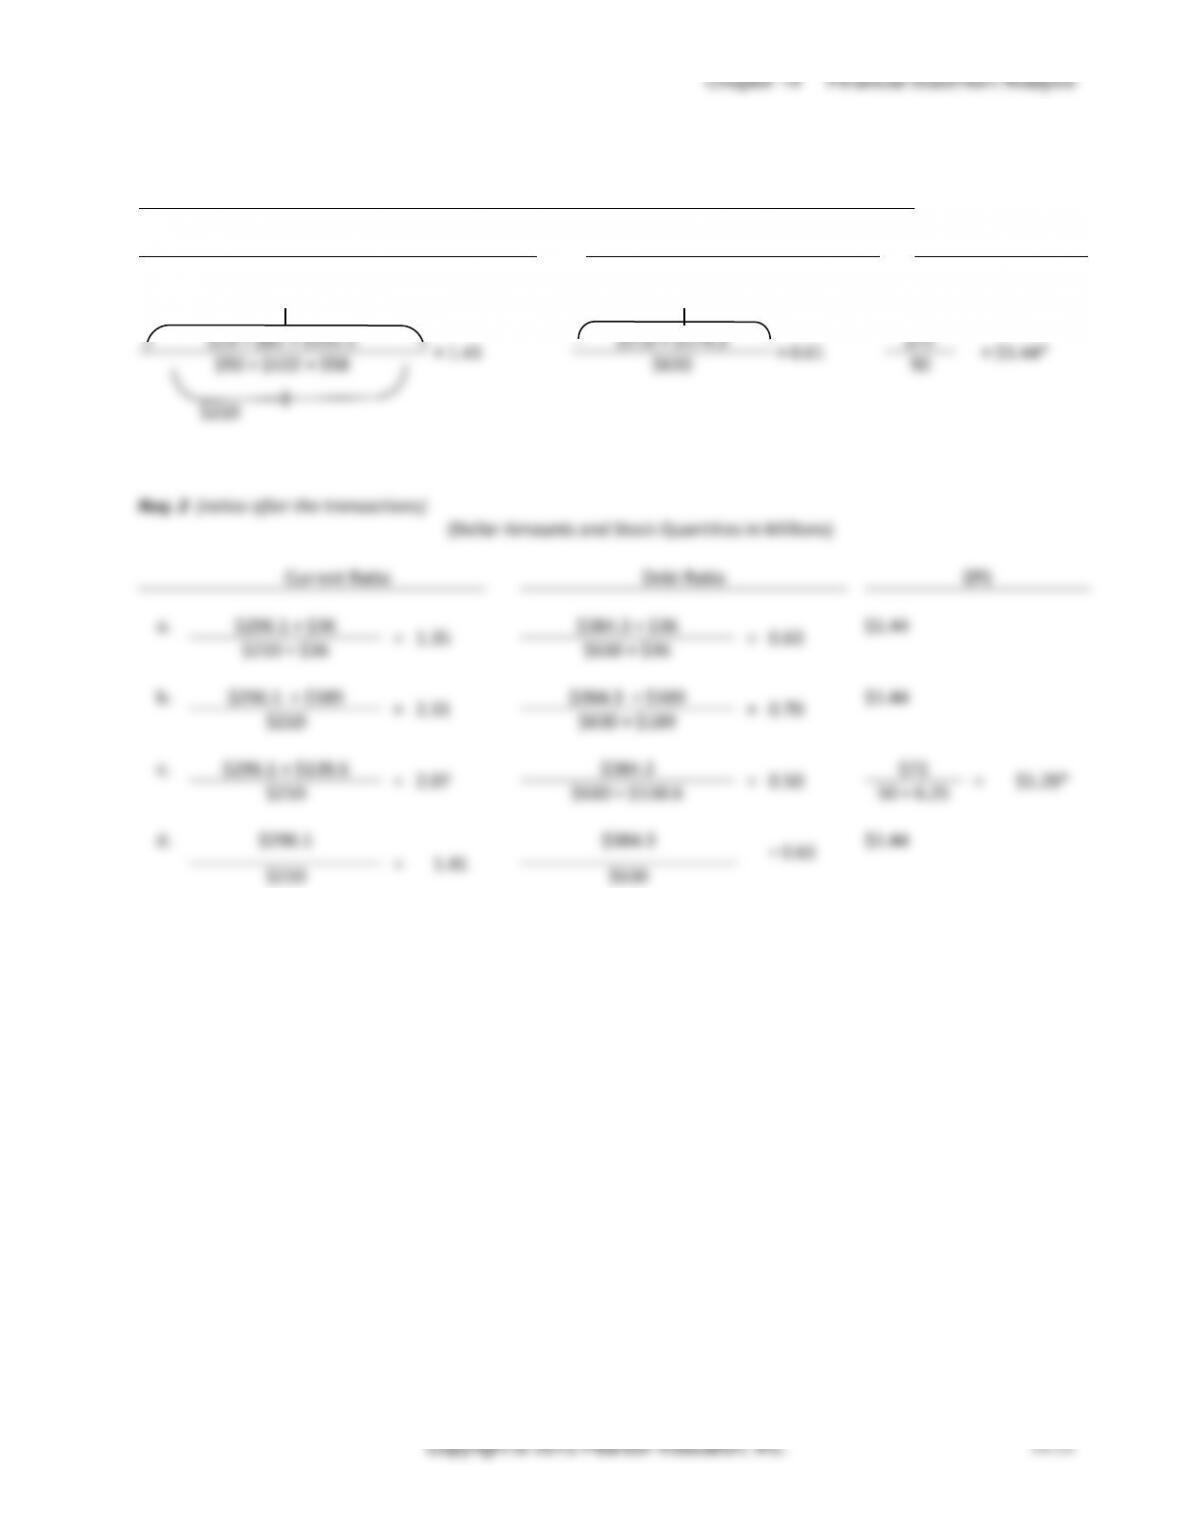
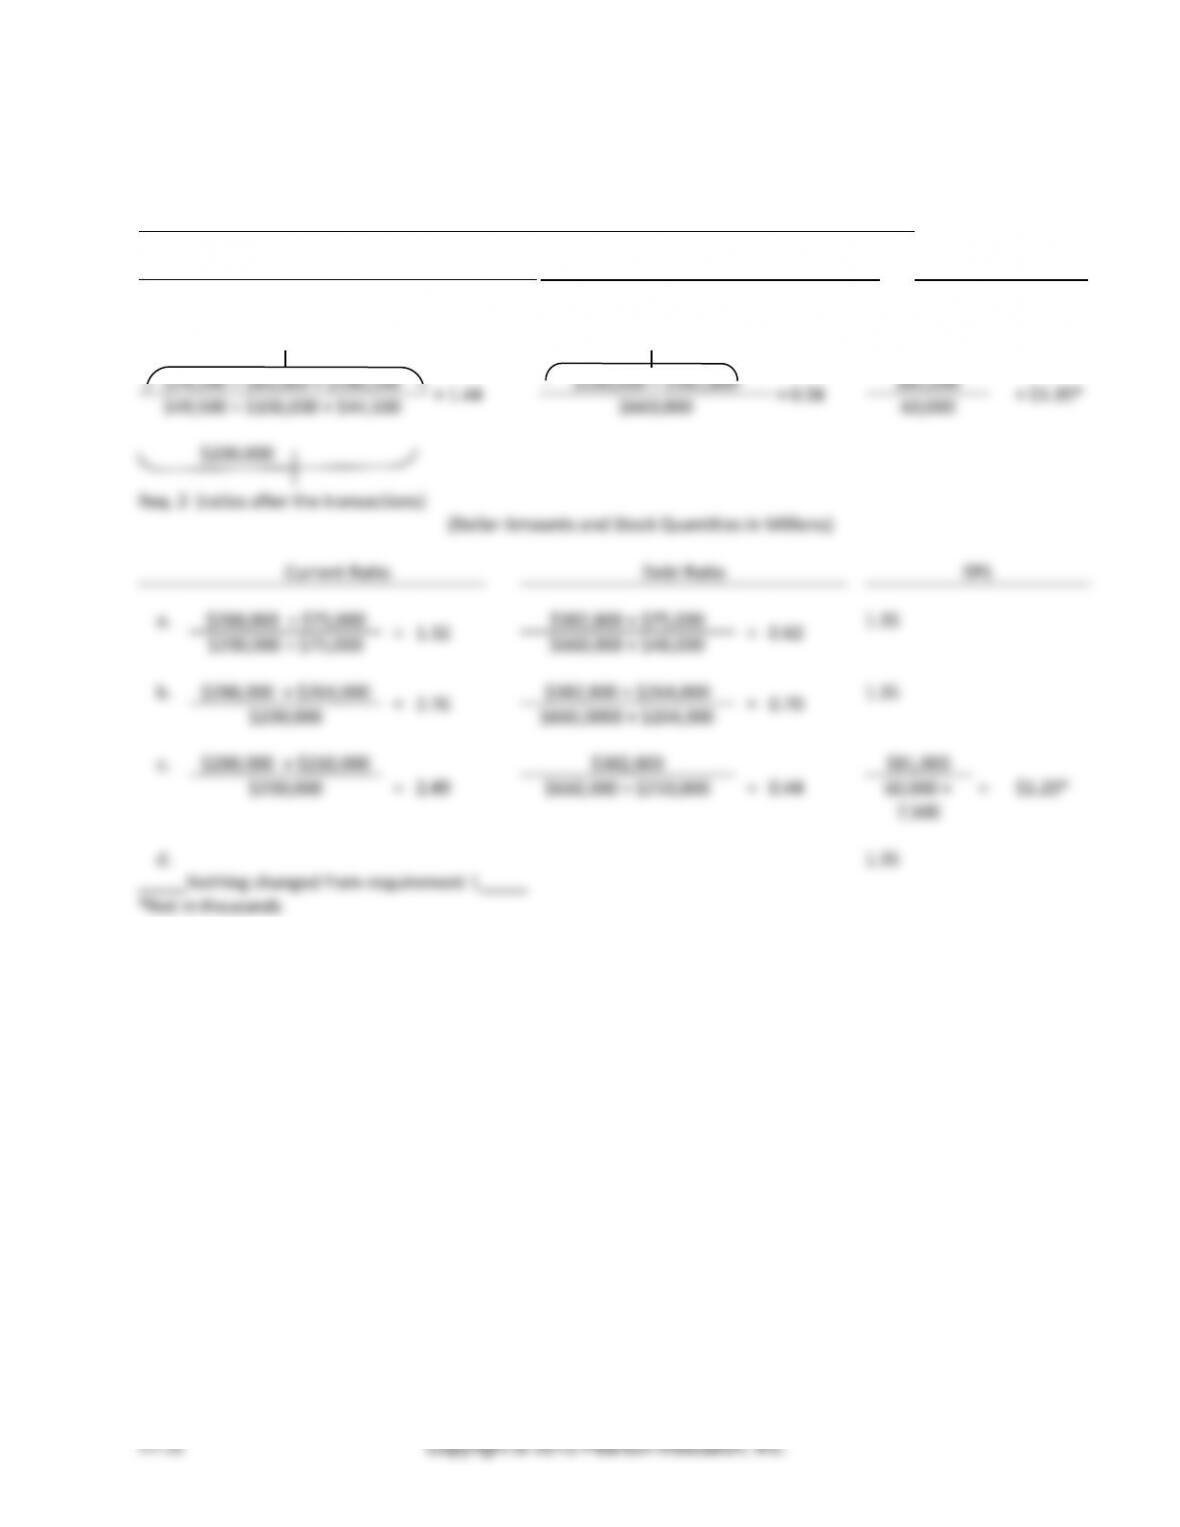
(30-40 min.) P14-40B
Req. 1 (ratios before the transactions)
(Dollar Amounts and Stock Quantities in Millions)
Current Ratio
Debt Ratio
Earnings per Share
$288,000
$382,800
$24,500 + $83,000 + $180,500
= 1.44
$200,000 + $182,800
= 0.58
$81,000
= $1.35*
$49,500 + $106,000 + $44,500
$660,000
60,000
$200,000
(Dollar Amounts and Stock Quantities in Millions)
Current Ratio
Debt Ratio
EPS
a.
$288,000 + $75,000
=
1.32
$382,800 + $75,000
=
0.62
1.35
$200,000 + $75,000
$660,000 + $48,000
b.
$288,000 + $264,000
=
2.76
$382,800 + $264,000
=
0.70
1.35
$200,000
$660,0000 + $264,000
c.
$288,000 + $210,000
=
2.49
$382,800
=
0.44
$81,000
=
$1.20*
$200,000
$660,000 + $210,000
60,000 +
7,500
d.
1.35
Managerial Accounting 4e Solutions Manual
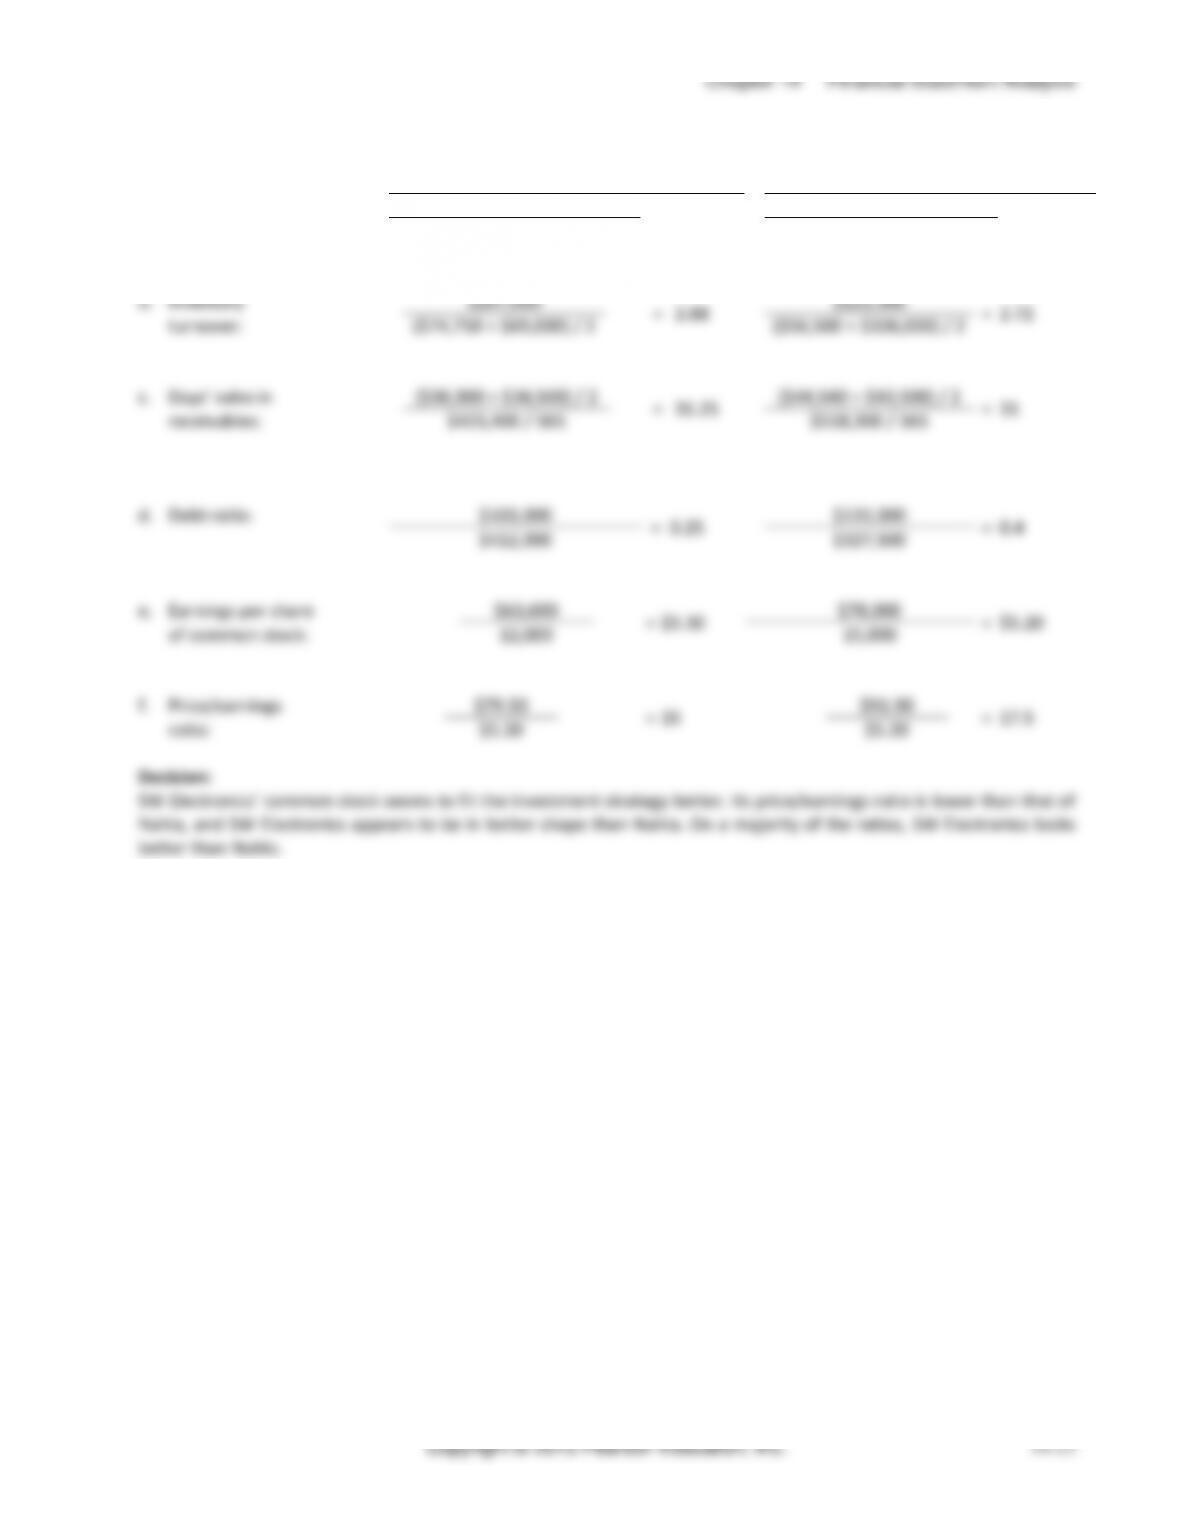
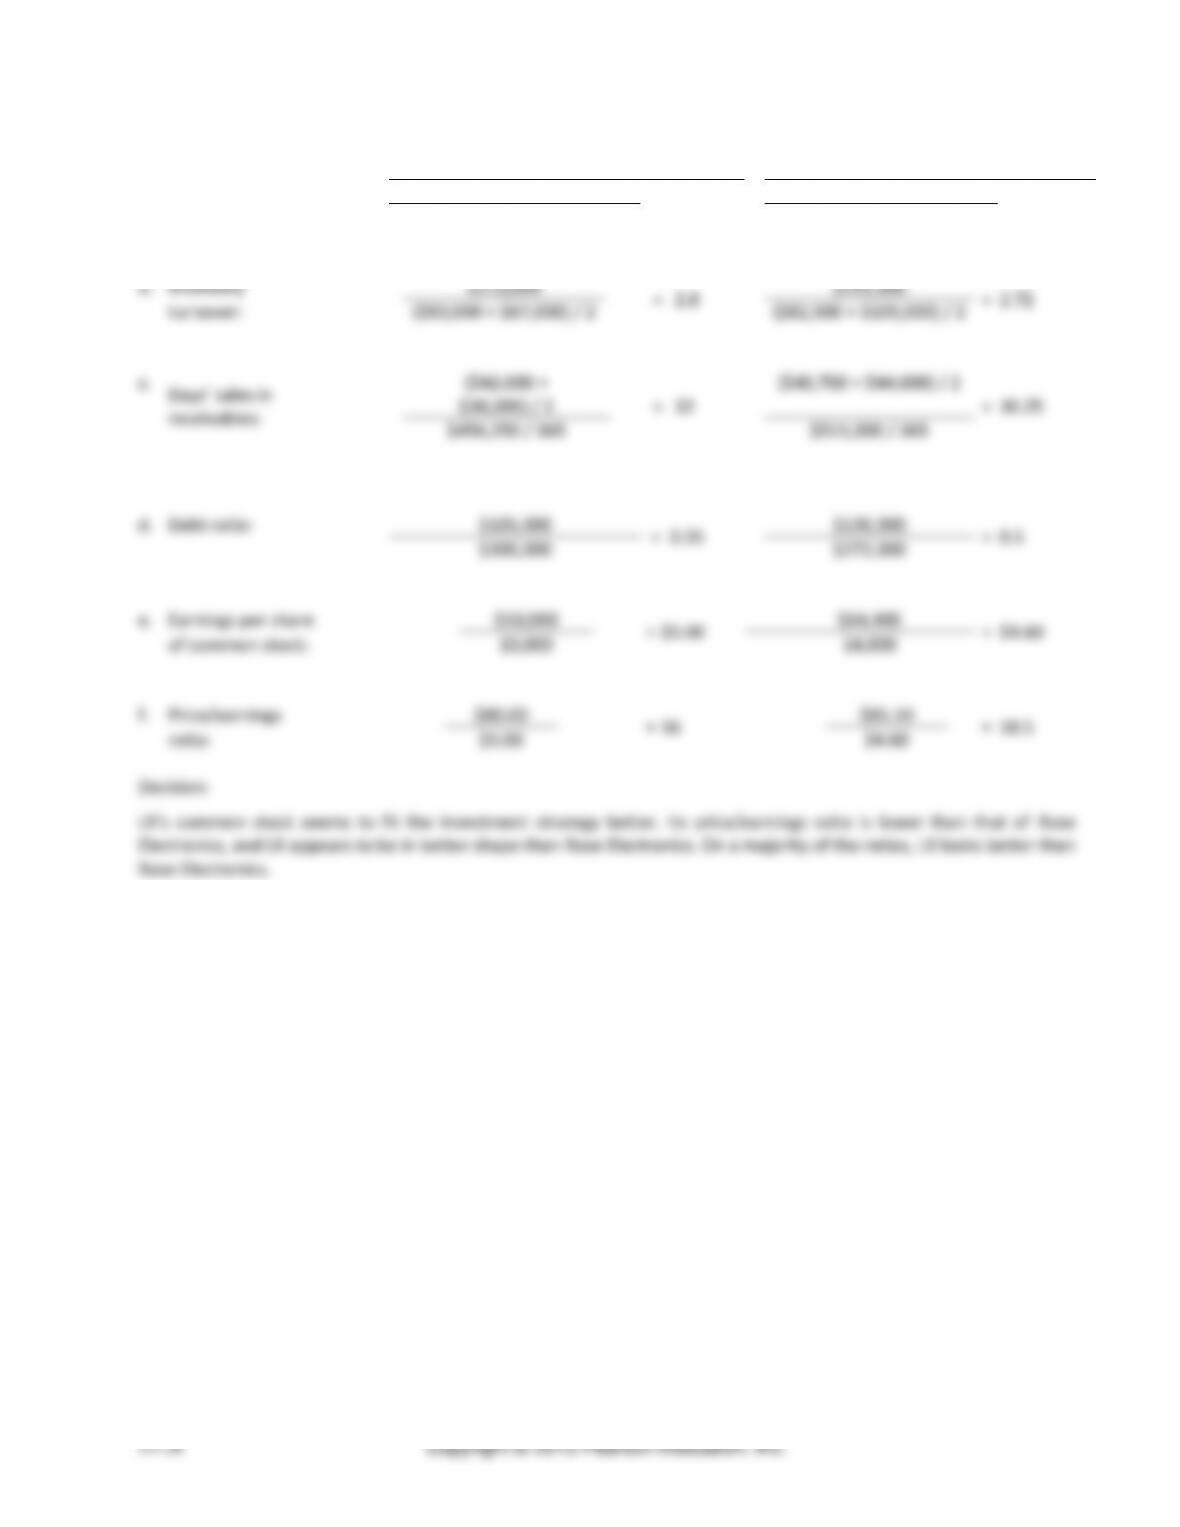
(45-60 min.) P14-42B
LX Electronics
Rose Electronics
a.
Acid-test ratio:
$29,200 + $42,000 + $38,000
=
1.04
$20,500 + $22,200 + $44,000
=
0.85
$105,000
$102,000
b.
Inventory
$210,000
=
2.8
$255,000
=
2.72
turnover:
($83,000 + $67,000) / 2
($82,500 + $105,000) / 2
c.
Days’ sales in
receivables:
($42,000 +
$38,000) / 2
=
32
($40,700 + $44,000) / 2
=
30.25
$456,250 / 365
$511,000 / 365
d.
Debt ratio:
$105,000
=
0.35
$136,000
=
0.5
$300,000
$272,000
e.
Earnings per share
$50,000
=
$5.00
$64,400
=
$4.60
of common stock:
10,000
14,000
f.
Price/earnings
$80.00
=
16
$85.10
=
18.5
ratio:
$5.00
$4.60
Chapter 14 Financial Statement Analysis
Discussion & Analysis
A14-43
1. Describe horizontal analysis. Describe vertical analysis. What is each technique used for? How are the two
methods similar? How are they different?
2. How is the current ratio calculated? What is it used to measure? How is it interpreted?
3. Assume a company has a current ratio of 2.0. List two examples of transactions that could cause the current
4. What does the accounts receivable turnover measure? What does a relatively high accounts receivable turnover
indicate about a company?
5. Describe the set of circumstances that could result in net income increasing while ROI decreases.
6. Suppose a company has a relatively high inventory turnover. What does the high inventory turnover indicate
about the company’s short-term liquidity?
7. Describe at least four financial conditions that may signal financial trouble.
• Has net income decreased significantly for several years in a row? Has income turned into a loss? Most
Chapter 14 Financial Statement Analysis
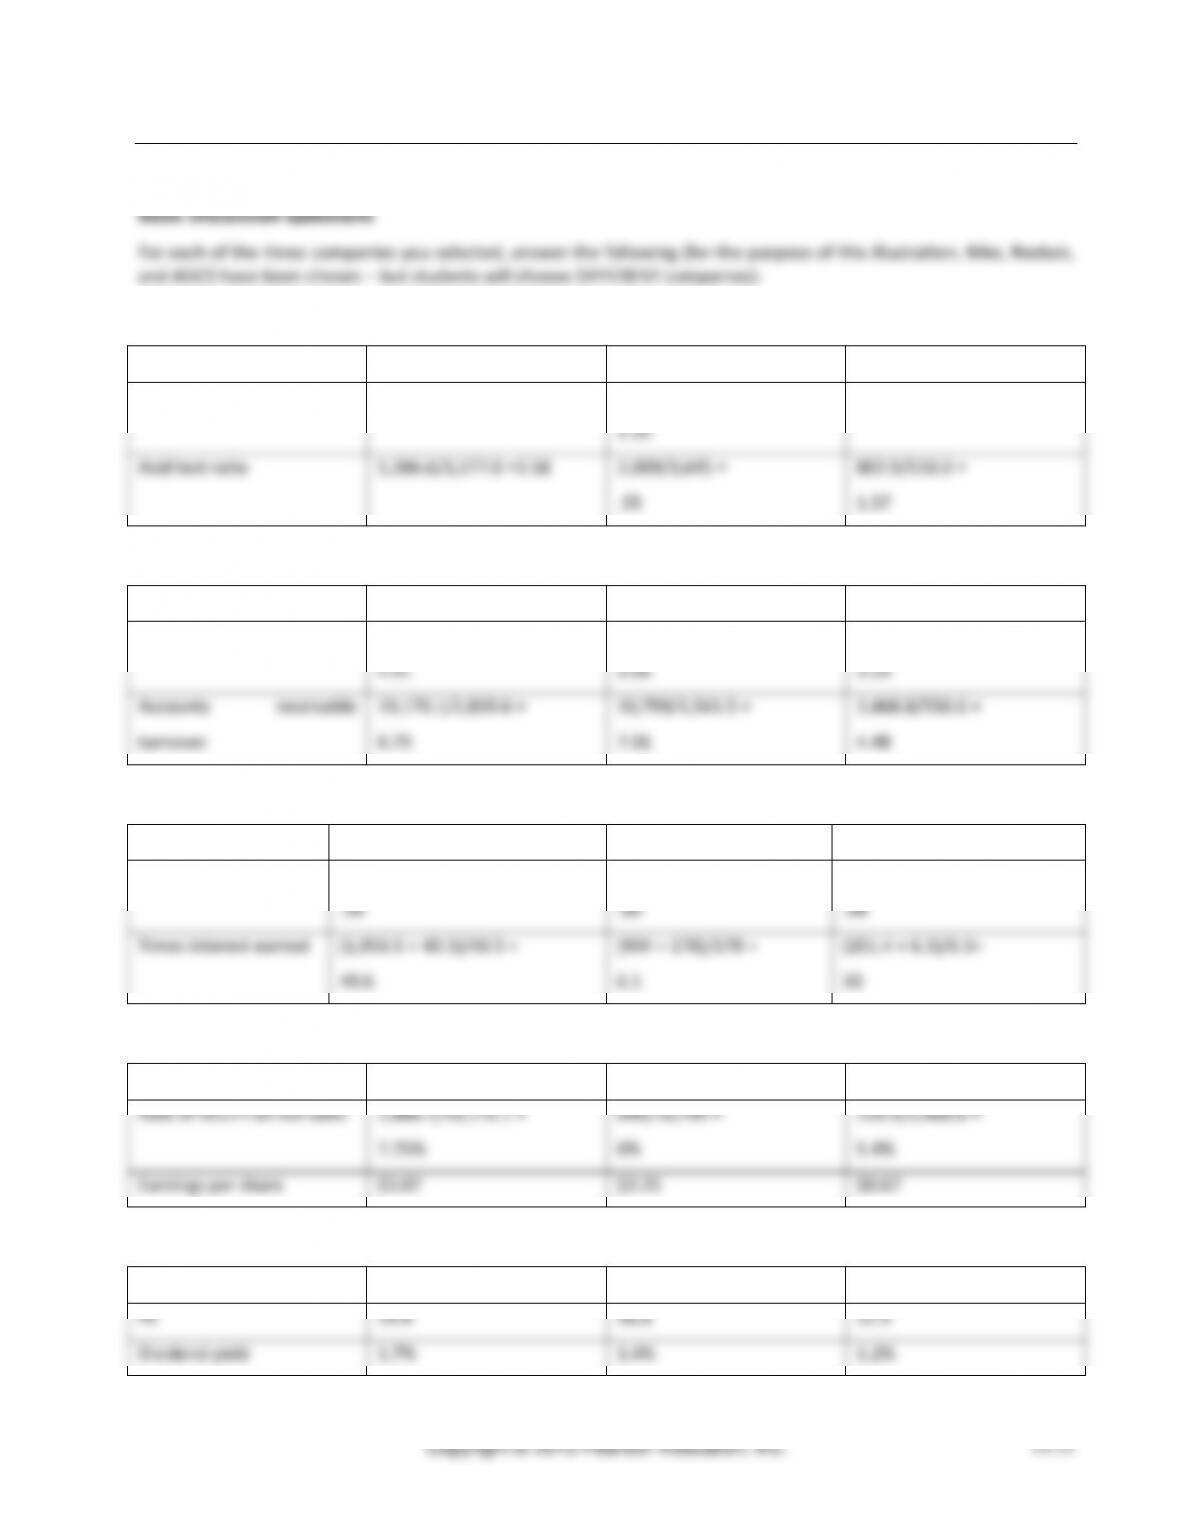
Application & Analysis
A14-44
1. Calculate two ratios that measure the ability to pay current liabilities.
Nike
Reebok
ASICS
Current ratio
9,734.0/3,277.0 = 2.97
4,934/3,645 =
1.35
1,304.3/510.3 = 2.56
Acid test ratio
5,186.6/3,277.0 =1.58
2,009/3,645 =
.55
802.9/510.3 =
1.57
2. Calculate at least two ratios that measure the ability to sell inventory and collect receivables.
Nike
Reebok
ASICS
Inventory turnover
10,571.7/2,397.7 =
4.41
5,543/1812 =
3.06
1,417.4/402 =
3.53
Accounts receivable
turnover
19,176.1/2,839.6 =
6.75
10,799/1,541.5 =
7.01
2,468.8/550.6 =
4.48
3. Calculate at least two ratios that measure the ability to pay long-term debt.
Nike
Reebok
ASICS
Debt ratio
4,556.5/13,249.6 =
.34
6,133/9,533 =
.64
782.2/1,784.9 =
.44
Times interest earned
(1,956.5 + 40.3)/40.3 =
49.6
(904 + 178)/178 =
6.1
(201.4 + 6.3)/6.3=
33
4. Calculate at least two ratios that measure profitability.
Nike
Reebok
ASICS
Rate of return on net sales
1,486.7/19,176.1 =
7.75%
644/10,799 =
6%
133.5/2,468.8 =
5.4%
Earnings per share
$3.07
$3.25
$0.67
5. Calculate at least two ratios that help to analyze the stock as an investment.
Nike
Reebok
ASICS
PE
19.4
16.8
12.5
Dividend yield
1.7%
1.4%
1.2%
Managerial Accounting 4e Solutions Manual
Now that you have crunched the numbers, interpret the ratios. What can you tell about each company and its
financial position? Is one company clearly better than the others in terms of its financial position, or are all three
A14-45
a. The ethical issues in this situation are:
Competence: “Provide decision support information and recommendations that are accurate, clear, concise, and
timely.” If Tom does not disclose all of the ratios clearly, even those that are weak, the decision support
1. Ability to pay current liabilities:
a. Coca-Cola’s current ratios in 2012, 2011, and 2010 were 1.09, 1.05, and 1.17, respectively. Their acid-test
ratios in 2012, 2011, and 2010 were 0.77, 0.78, and 0.85, respectively.
b. PepsiCo’s current ratios in 2012, 2011, and 2010 were 1.10, 0.96, and 1.11, respectively. Their acid-test ratios
in 2012, 2011, and 2010 were 0.80, 0.62, and 0.80, respectively.
Chapter 14 Financial Statement Analysis
2010 was $9,019, $8,572, and $11,809, respectively. Their working capital ($ in millions) in 2012, 2011, and
2010 was $2,507, $1,214, and $3,071, respectively.
2. The Coca-Cola Company:
a. Ability to pay current liabilities: Coca–Cola’s current ratio was weak, and their acid-test ratio was lower than
average. This means that Coca-Cola may have difficulties paying off their current liabilities.
3. PepsiCo, Inc:
a. Ability to pay current liabilities: PepsiCo’s current ratio was weak, and their acid-test ratio was lower than
average. This means that PepsiCo may have difficulties paying off their current liabilities.
4. The Coca-Cola Company vs. PepsiCo, Inc:
a. Ability to pay current liabilities: Coca–Cola’s current and acid–test ratios appear to be stronger than PepsiCo’s
ratios.
b. Ability to sell inventory and collect receivables: Coca–Cola’s inventory and receivables turnover appears to be
5. Conclusions:
Team Project
A14-47
Student answers will vary.