Chapter 14 Financial Statement Analysis
Chapter 14
Financial Statement Analysis
Quick Check
Answers:
Chapter 14 Financial Statement Analysis
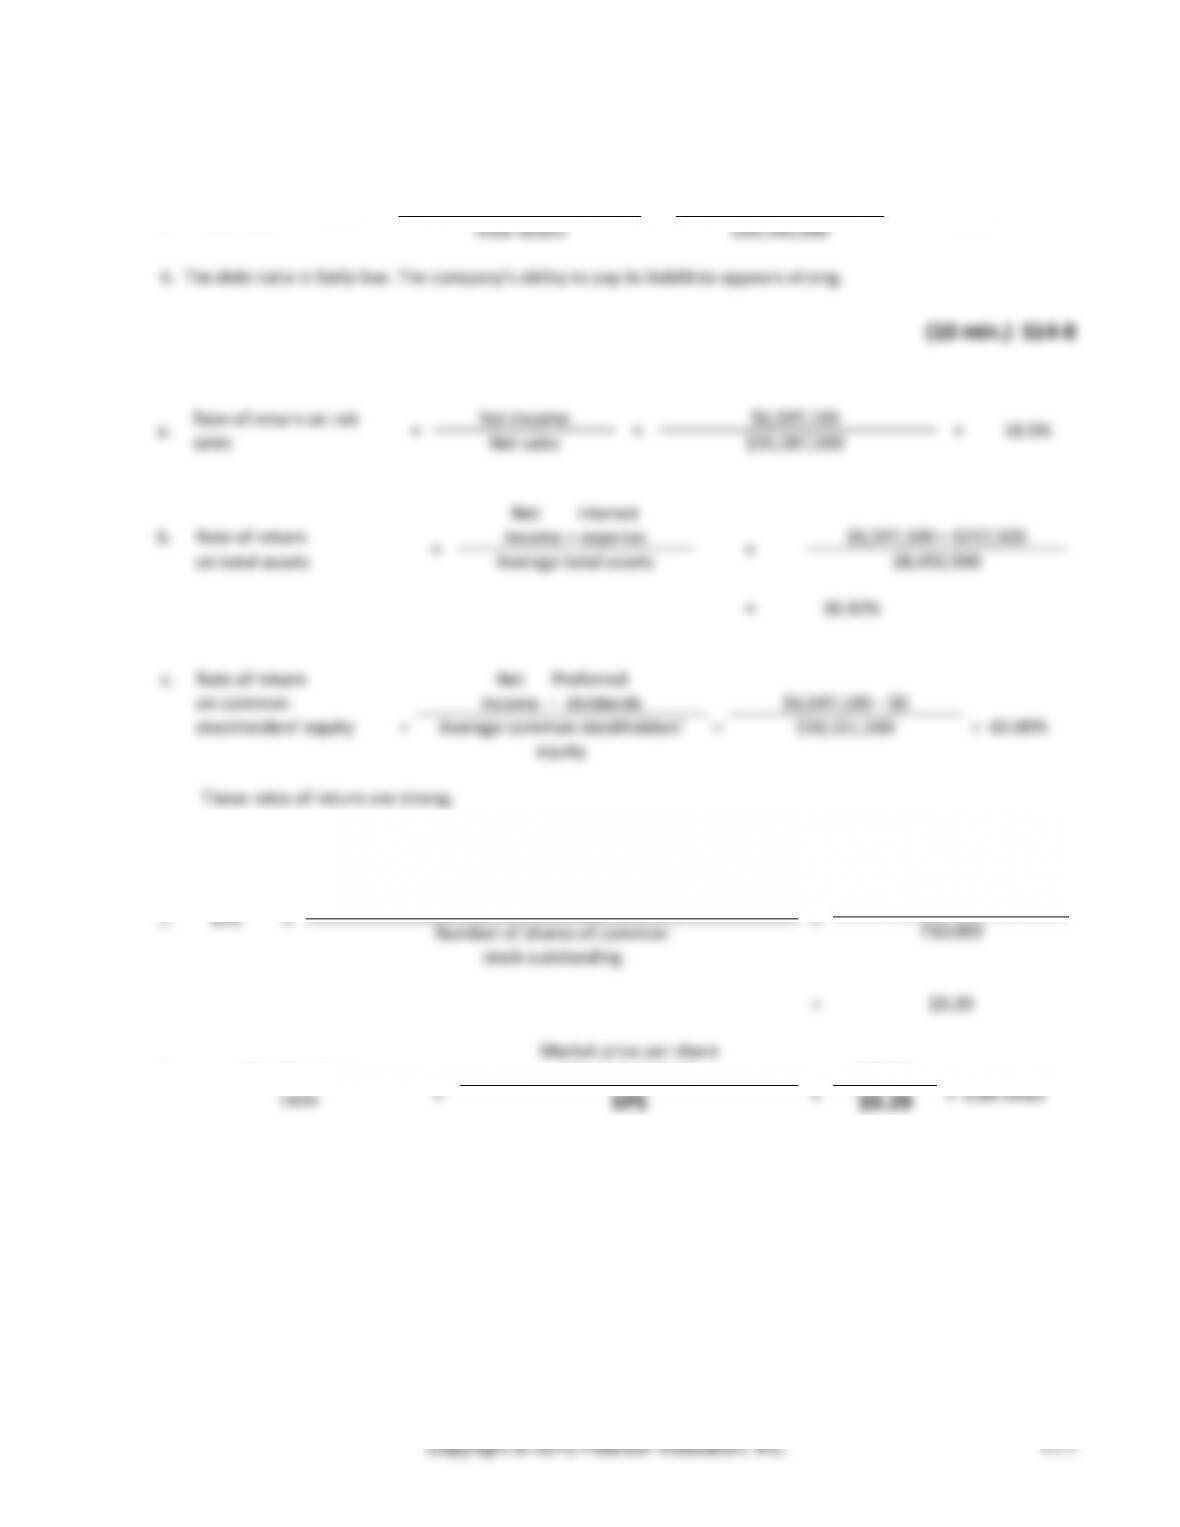
(5 min.) S14-7
a.
Debt ratio
=
Total liabilities
=
$8,714,000
=
0.45
Total assets
$19,345,000
b. The debt ratio is fairly low. The company’s ability to pay its liabilities appears strong.
(10 min.) S14-8
a.
Rate of return on net
sales
=
Net income
=
$6,597,100
=
18.5%
Net sales
$35,587,500
Net Interest
b.
Rate of return
=
income + expense
=
$6,597,100 + $217,500
on total assets
Average total assets
18,455,500
=
36.92%
c.
Rate of return
Net Preferred
on common
=
Income − dividends
=
$6,597,100 − $0
=
65.00%
stockholders’ equity
Average common stockholders’
equity
$10,151,500
These rates of return are strong.
(5-10 min.) S14-9
1.
EPS
=
Net income − Preferred dividends
Number of shares of common
=
$6,597,100 − $0
710,000
stock outstanding
=
$9.29
Market price per share
of common stock
2.
Price/earnings
ratio
=
=
$63.50
=
6.84 times
EPS
$9.29
Managerial Accounting 4e Solutions Manual
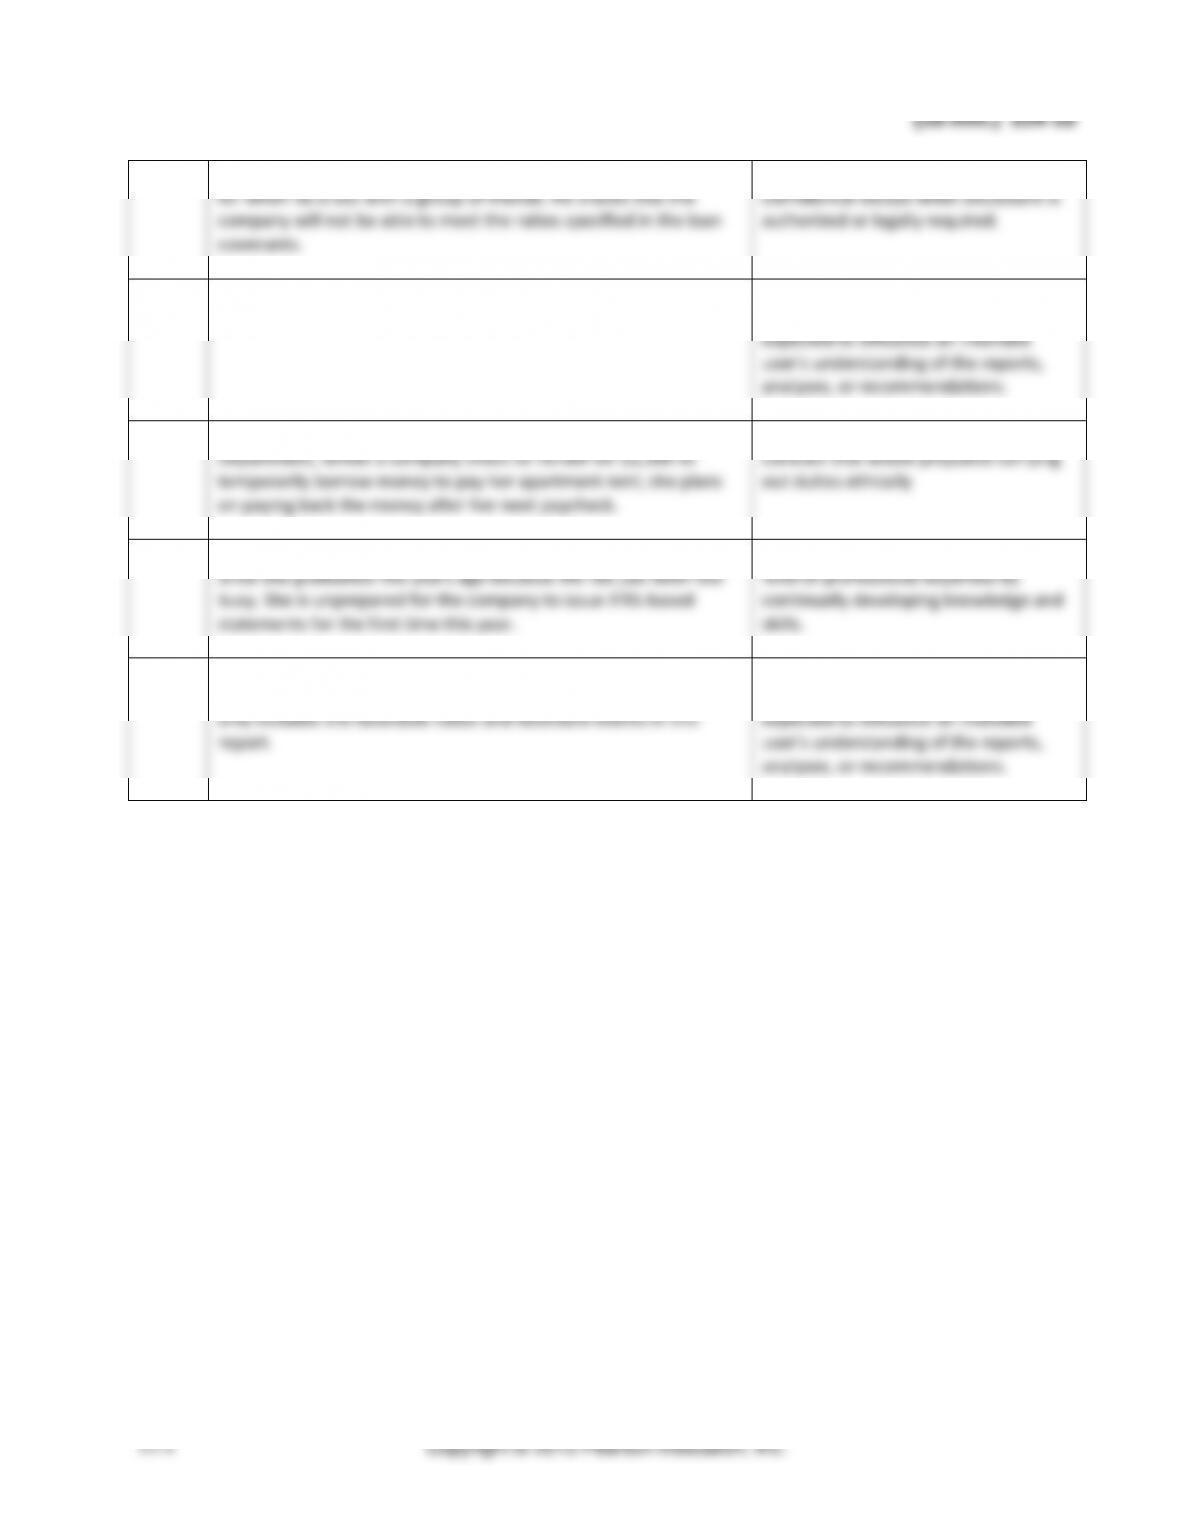
(10 min.) S14-10
1.
Emmett talks about the financial woes of the company he works
for when he is out with a group of friends. He shares that the
company will not be able to meet the ratios specified in the loan
covenants.
Confidentiality – Keep information
confidential except when disclosure is
authorized or legally required.
2.
Marion prepares the financial statements, but the internal control
system weaknesses are not disclosed.
Credibility – Disclose all relevant
information that could reasonably be
expected to influence an intended
user’s understanding of the reports,
analyses, or recommendations.
3.
Jeanne, an accountant working in the Accounts Payable
Department, writes a company check to herself for $1,500 to
temporarily borrow money to pay her apartment rent; she plans
on paying back the money after her next paycheck.
Integrity – Refrain from engaging in any
conduct that would prejudice carrying
out duties ethically
4.
Shirley has not participated in any continuing education activities
since she graduated five years ago because life has just been too
busy. She is unprepared for the company to issue IFRS-based
statements for the first time this year.
Competence – Maintain an appropriate
level of professional expertise by
continually developing knowledge and
skills.
5.
Floyd, the corporate controller, prepares a report for the board of
directors that summarizes the year. Floyd, wanting to look good,
only includes the favorable ratios and favorable events in this
report.
Credibility – Disclose all relevant
information that could reasonably be
expected to influence an intended
user’s understanding of the reports,
analyses, or recommendations.
Chapter 14 Financial Statement Analysis
Exercises (Group A)
(5-15 min.) E14-11A
2014
2013
2012
Total current assets
$379,780
$356,000
$309,000
Total current liabilities
188,000
184,000
149,000
Working capital
$191,780
$172,000
$160,000
11.5%
Chapter 14 Financial Statement Analysis
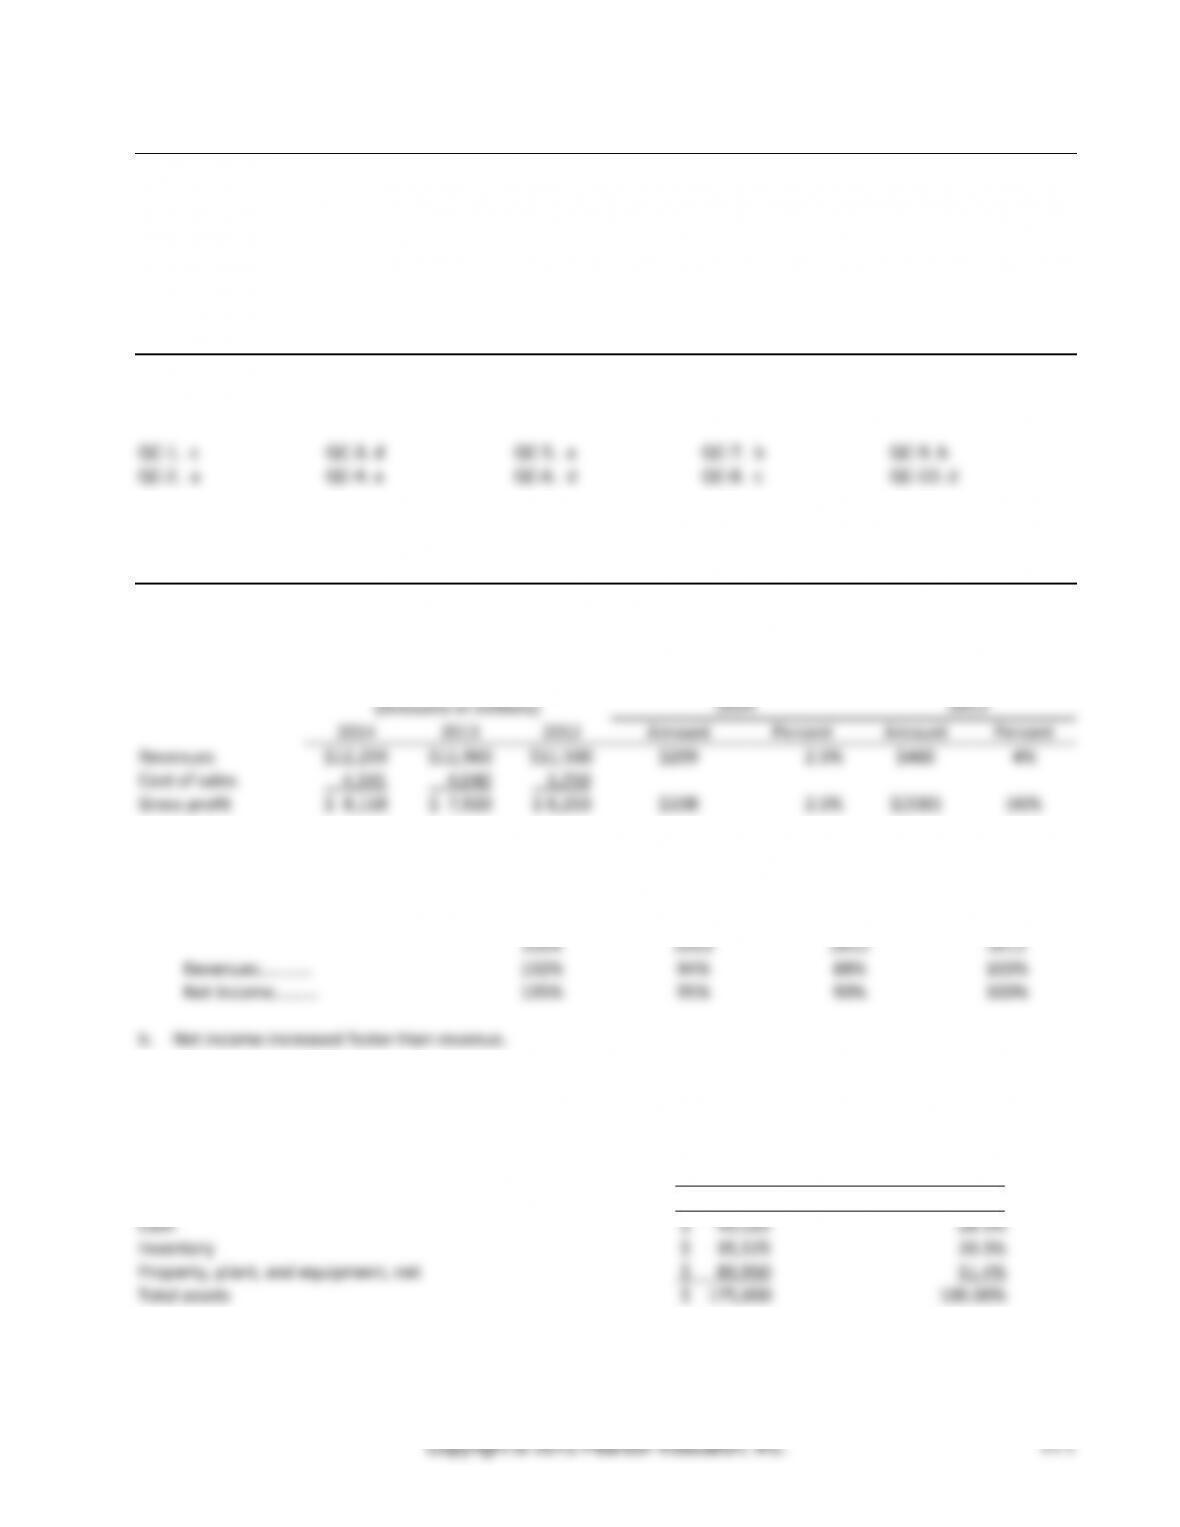
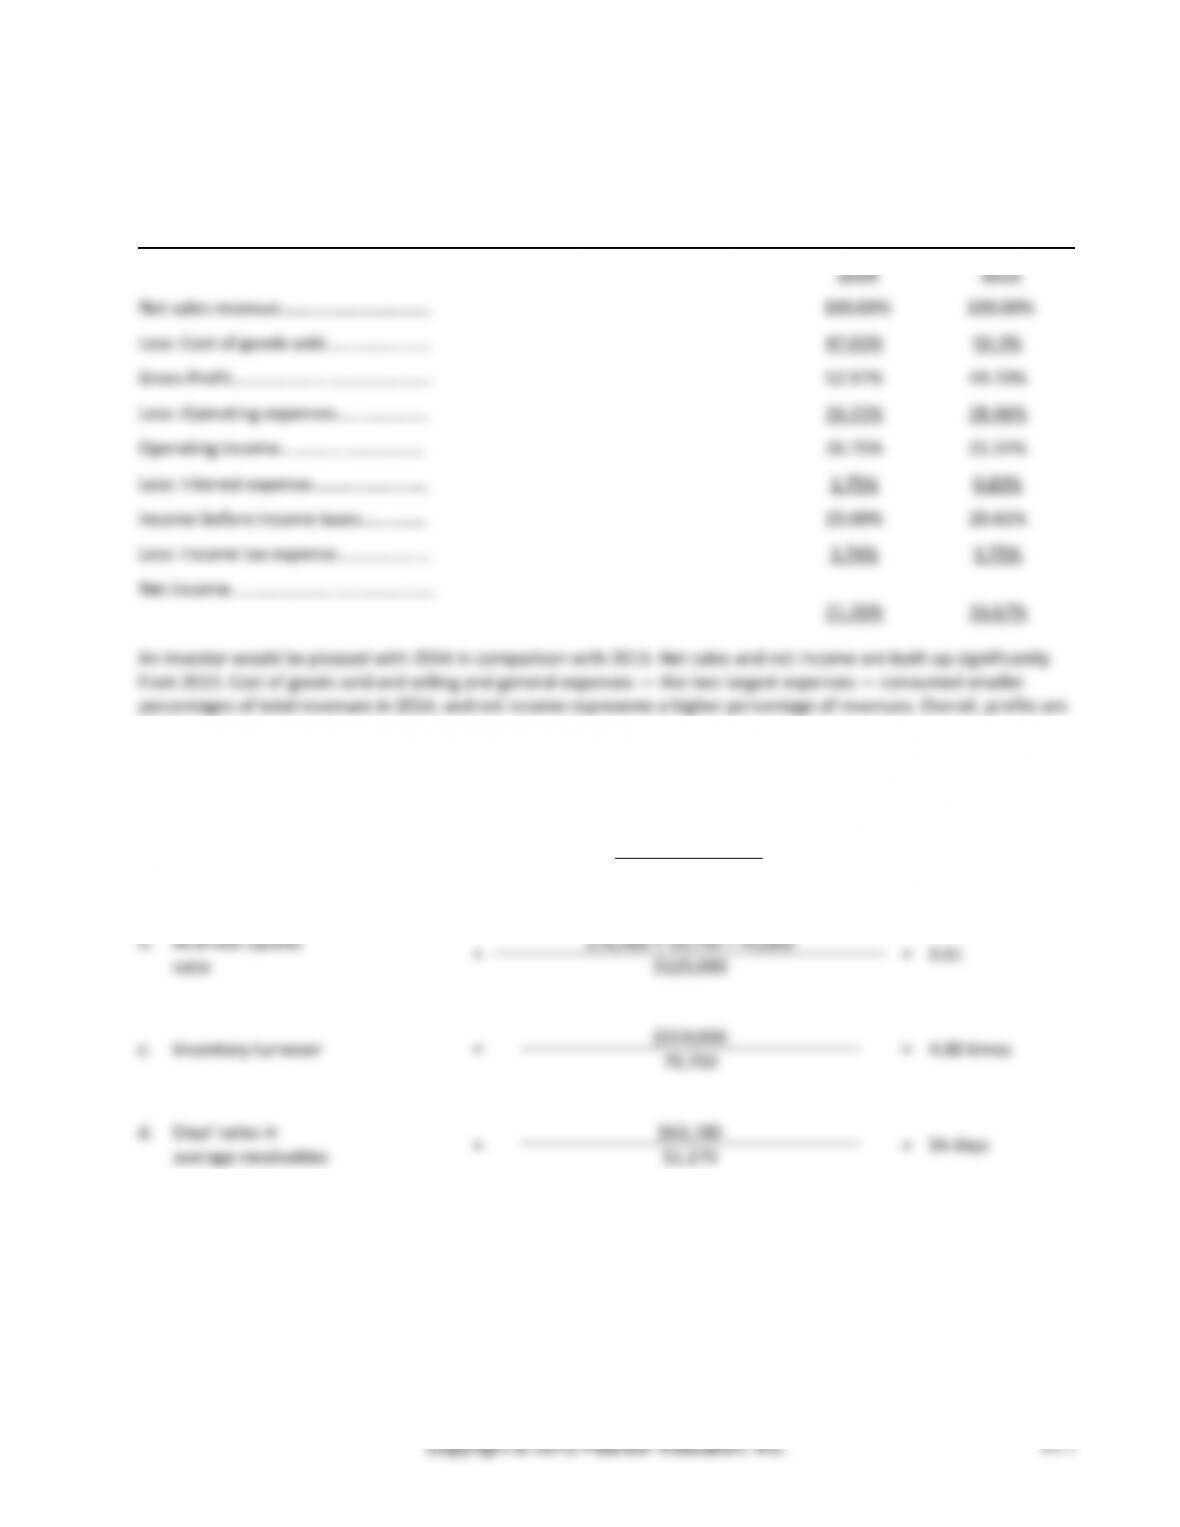
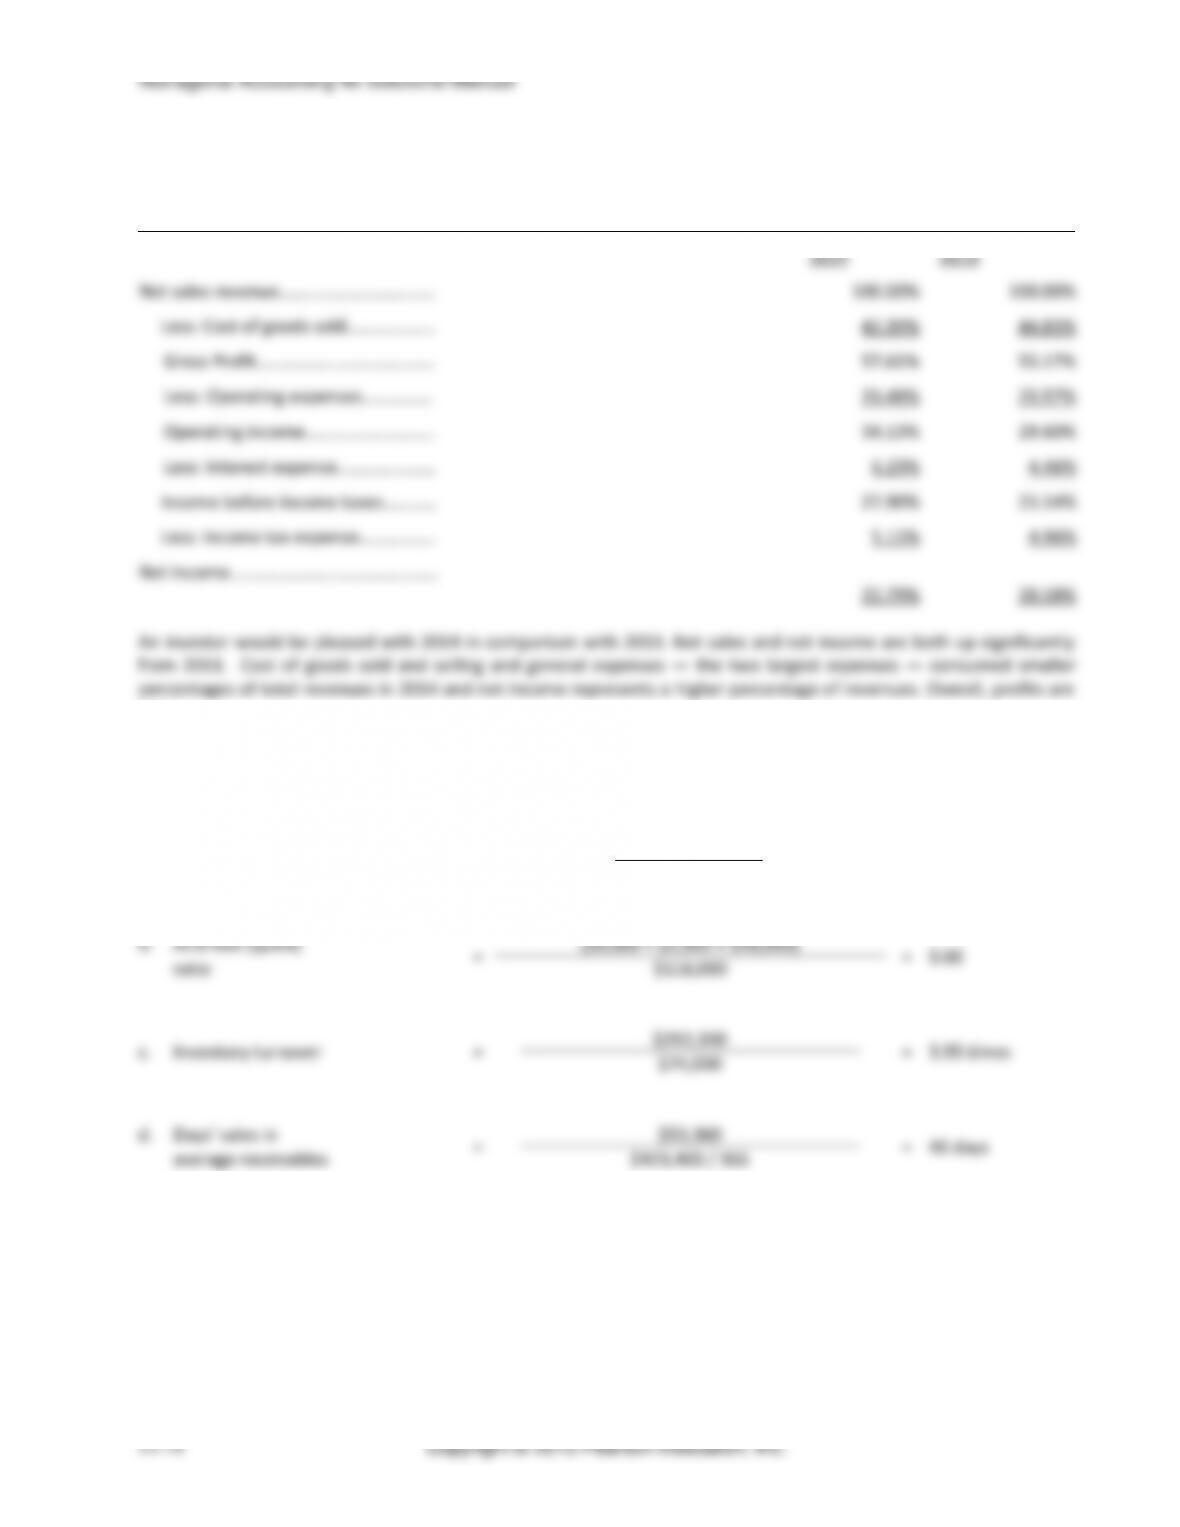
(10-15 min.) E14-15A
Mariner Designs
Income Statement
For the years ended December 31, 2014 and 2013
2014
2013
Net sales revenue…………………………….
100.00%
100.00%
Less: Cost of goods sold……………………
47.03%
50.3%
Gross Profit………….…………………………..
52.97%
49.70%
Less: Operating expenses…………………
26.22%
28.46%
Operating income……………………………
26.75%
21.24%
Less: Interest expense……………………..
1.75%
0.83%
Income before income taxes……………
25.00%
20.41%
Less: Income tax expense…………………
3.74%
3.75%
Net income……………………………………….
21.26%
16.67%
An investor would be pleased with 2014 in comparison with 2013. Net sales and net income are both up significantly
from 2013. Cost of goods sold and selling and general expenses — the two largest expenses — consumed smaller
percentages of total revenues in 2014, and net income represents a higher percentage of revenues. Overall, profits are
rising.
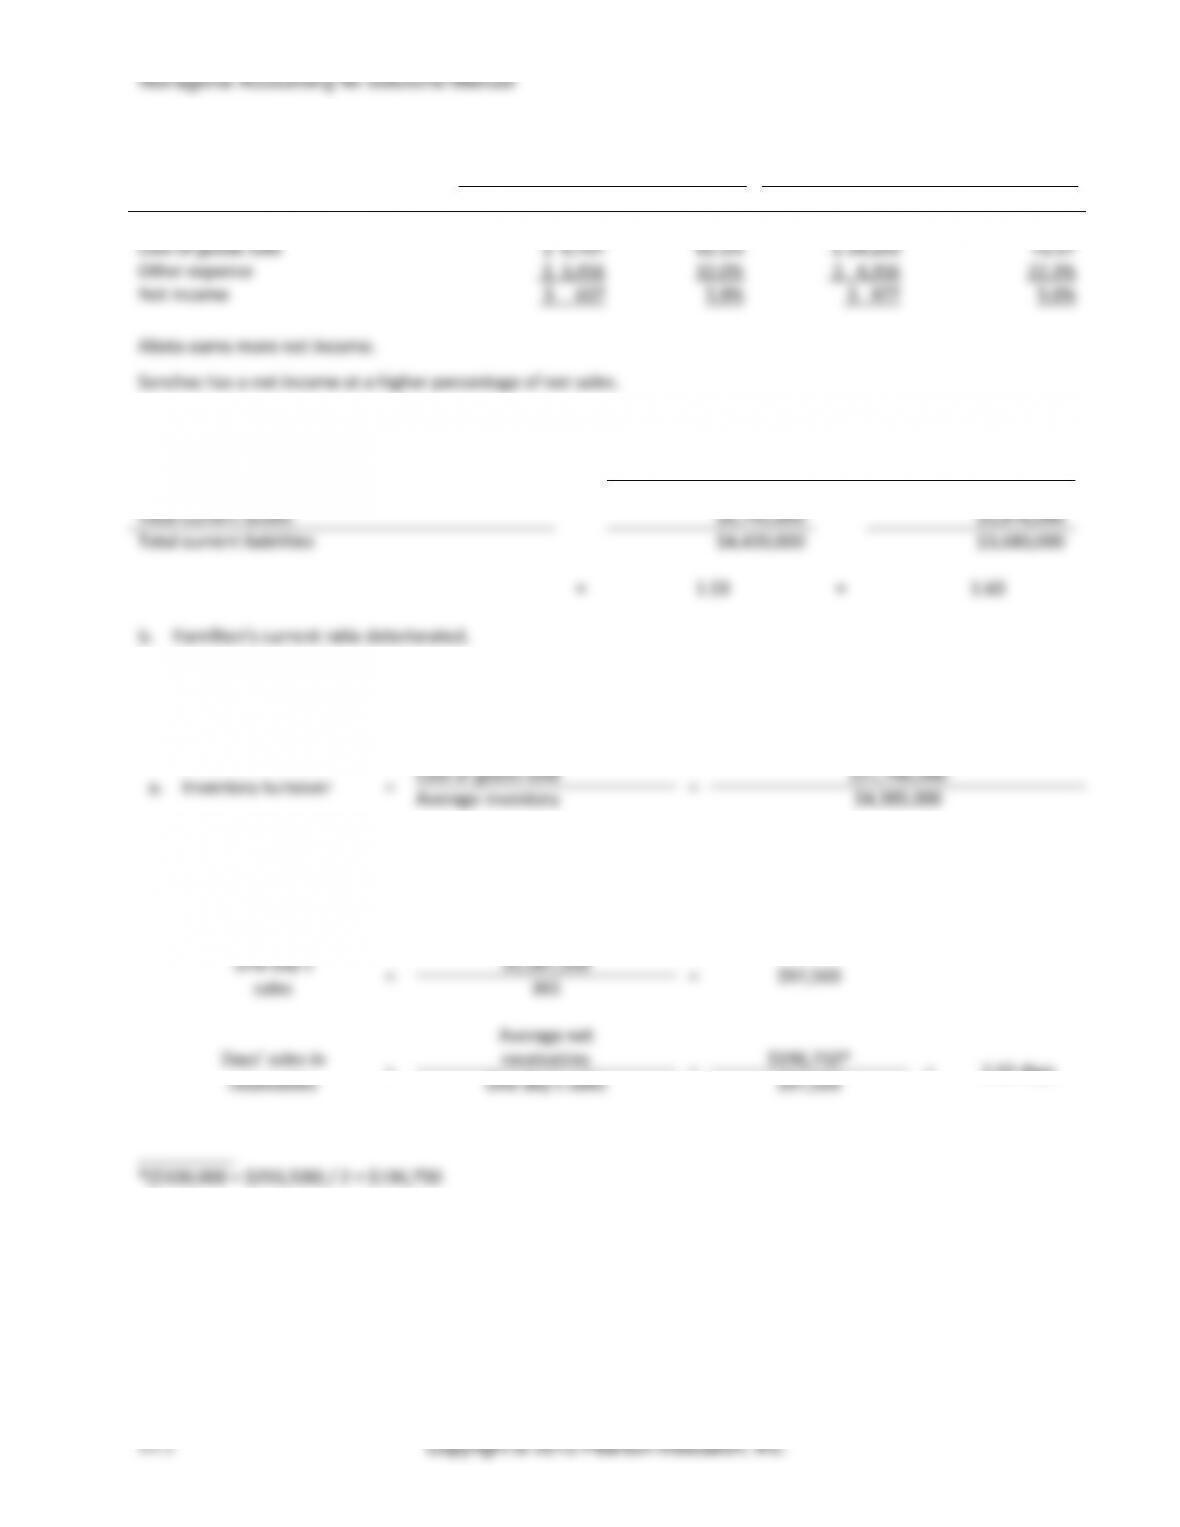
(10-15 min.) E14-16A
a.
Current ratio
=
$178,750
=
1.43
$125,000
b.
Acid-test (quick)
=
$16,500 + 10,750 + 49,000
=
0.61
ratio
$125,000
c.
Inventory turnover
=
$319,000
=
4.00 times
79,750
d.
Days’ sales in
=
$63,180
=
54 days
average receivables
$1,170
Chapter 14 Financial Statement Analysis
(10-15 min.) E14-19A
2014
2013
a.
Price/earnings ratio:
$17.50
=
20.0
$14.00
=
17.5
($83,375 − $12,500) / 81,000
($77,300 − $12,500) / 81,000
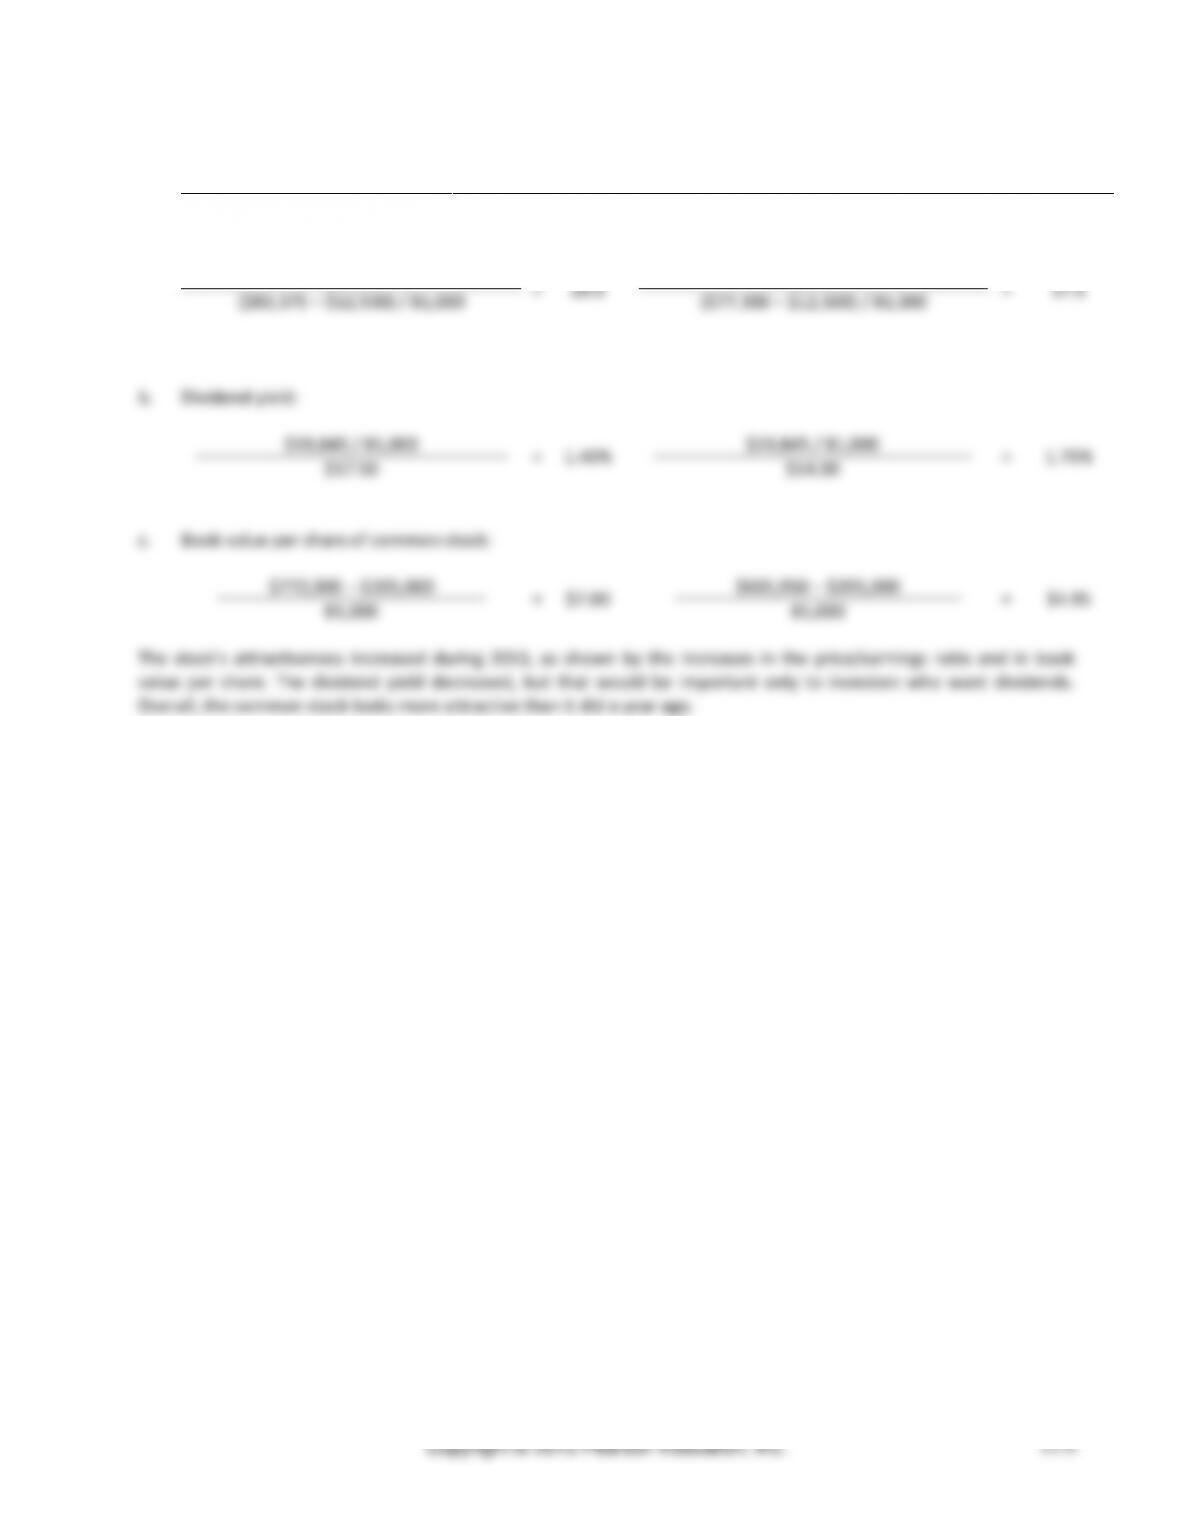
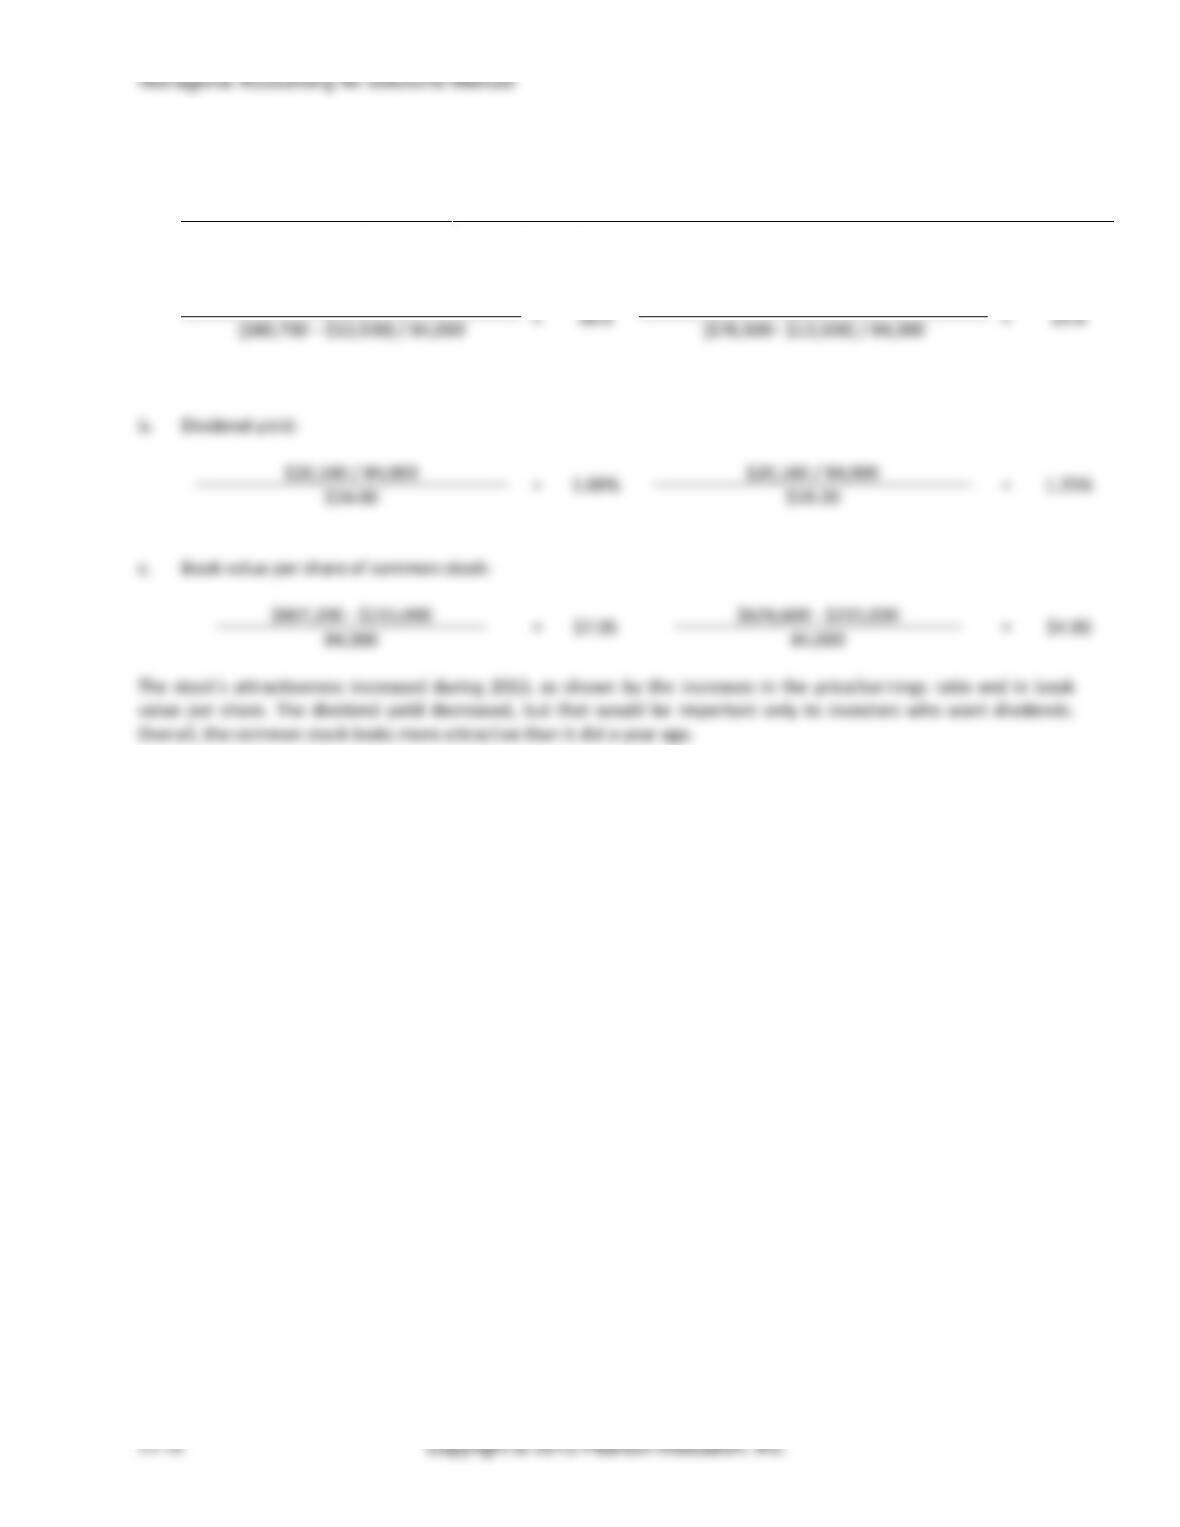
b.
Dividend yield:
$19,845 / 81,000
=
1.40%
$19,845 / 81,000
=
1.75%
$17.50
$14.00
c.
Book value per share of common stock:
$772,000 − $205,000
=
$7.00
$605,950 − $205,000
=
$4.95
81,000
81,000
The stock’s attractiveness increased during 2013, as shown by the increases in the price/earnings ratio and in book
value per share. The dividend yield decreased, but that would be important only to investors who want dividends.
Overall, the common stock looks more attractive than it did a year ago.
Chapter 14 Financial Statement Analysis
(5 min.) E14-21A
a. People
b. Profit
Copyright © 2015 Pearson Education, Inc.
14–12
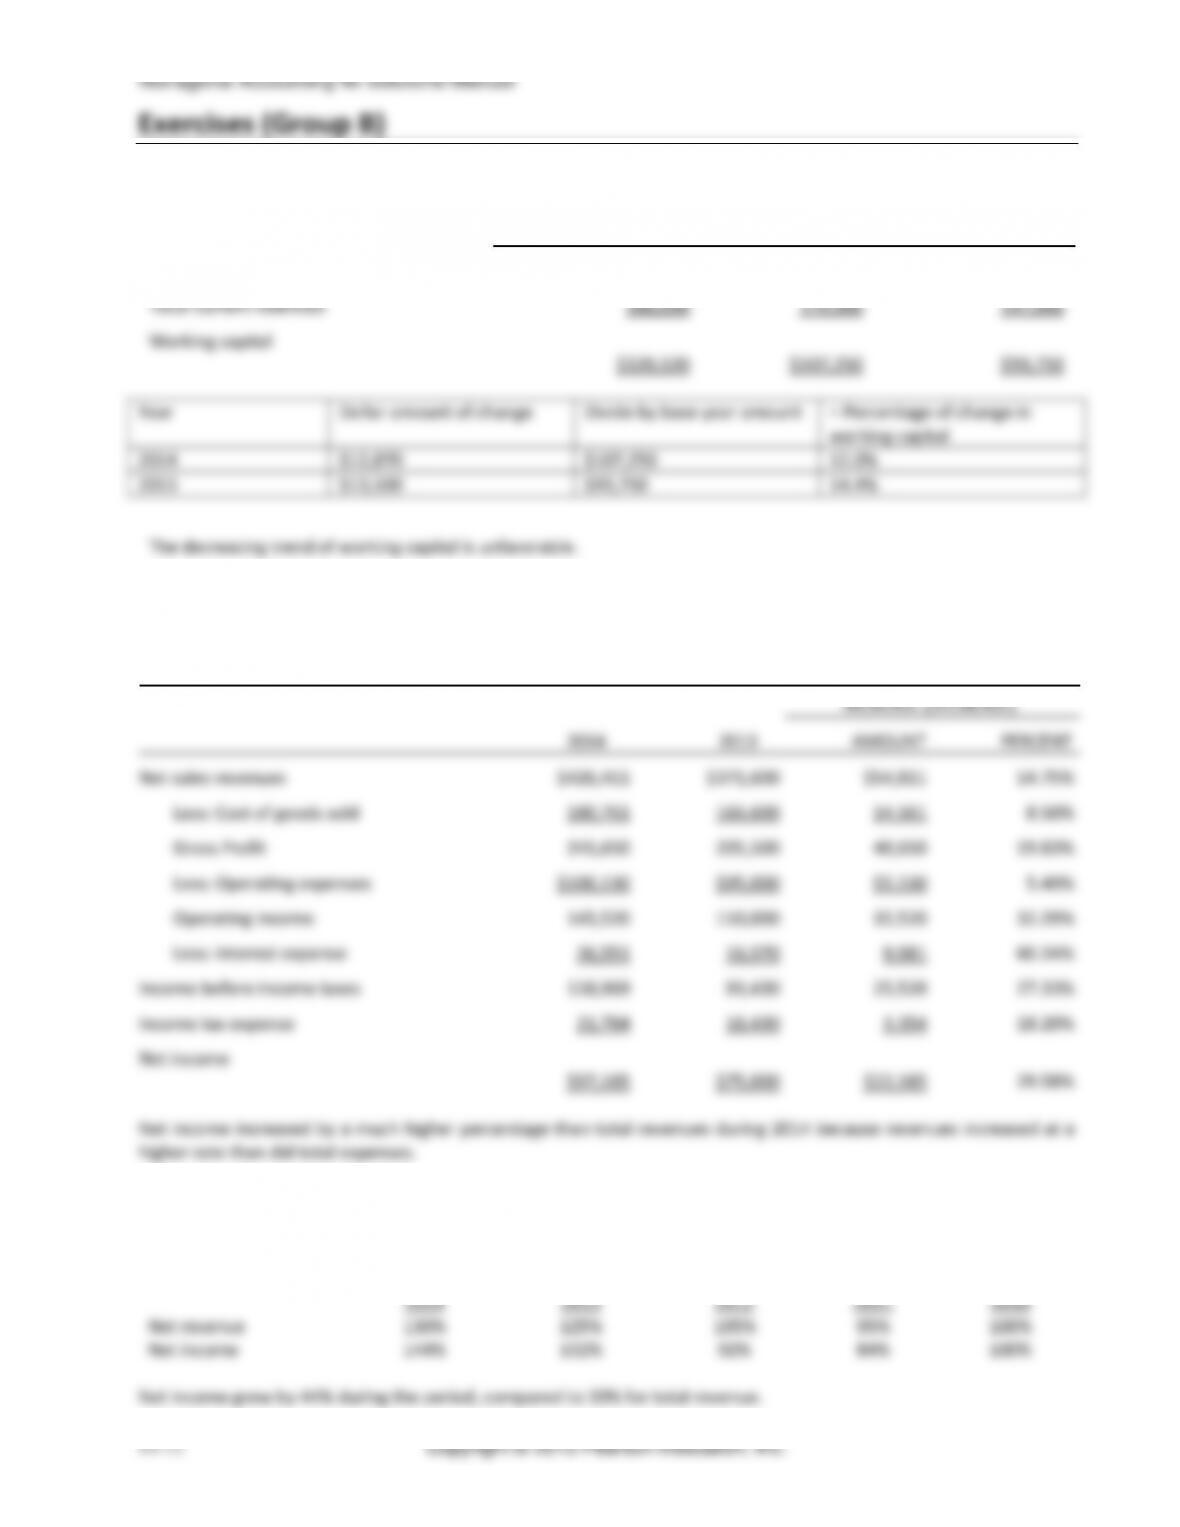
(5-15 min.) E14-22B
2014
2013
2012
Total current assets
$306,120
$286,250
$240,750
Total current liabilities
186,000
179,000
147,000
Working capital
$120,120
$107,250
$93,750
Year
Dollar amount of change
Divide by base year amount
= Percentage of change in
working capital
2014
$12,870
$107,250
12.0%
2013
$13,500
$93,750
14.4%
The decreasing trend of working capital is unfavorable.
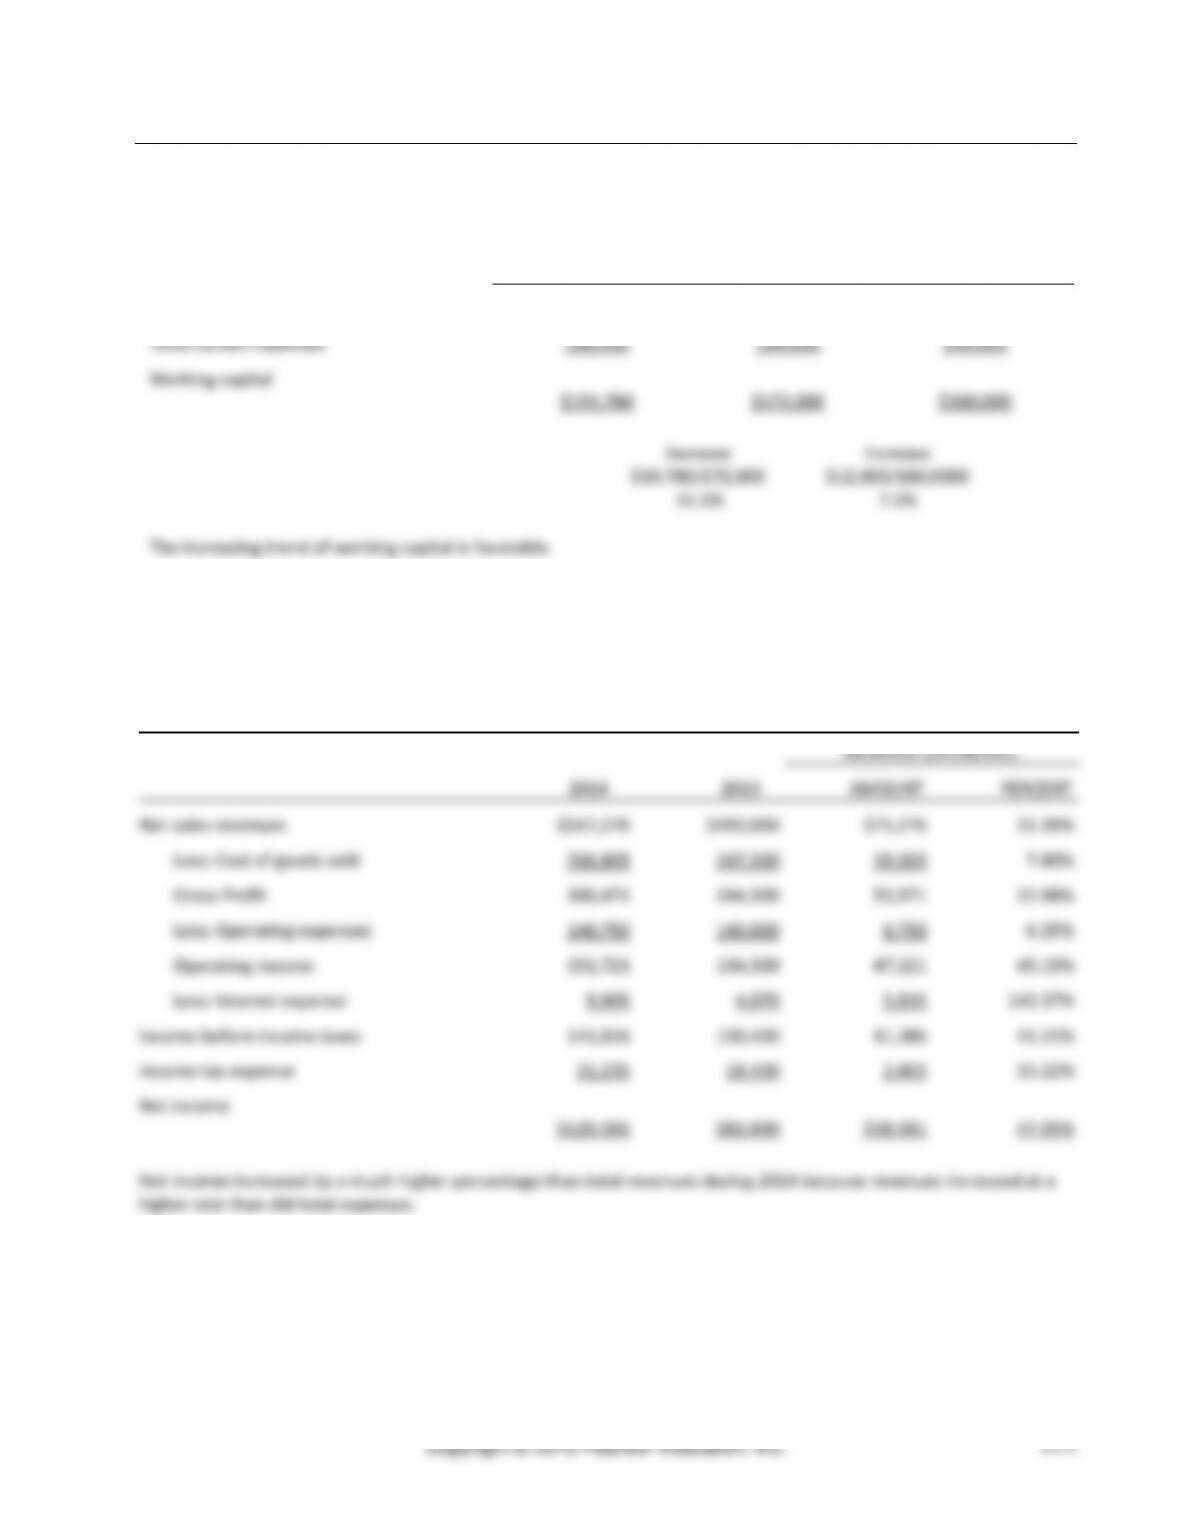
(10-15 min.) E14-23B
Enchanted Designs
Horizontal Analysis of Comparative Income Statement
Years Ended December 31, 2014 and 2013
INCREASE (DECREASE)
2014
2013
AMOUNT
PERCENT
Net sales revenues
$426,411
$371,600
$54,811
14.75%
Less: Cost of goods sold
180,761
166,600
14,161
8.50%
Gross Profit
245,650
205,500
40,650
19.83%
Less: Operating expenses
$100,130
$95,000
$5,130
5.40%
Operating income
145,520
110,000
35,520
32.29%
Less: Interest expense
26,551
16,570
9,981
60.24%
Income before income taxes
118,969
93,430
25,539
27.33%
Income tax expense
21,784
18,430
3,354
18.20%
Net income
$97,185
$75,000
$22,185
29.58%
Net income increased by a much higher percentage than total revenues during 2014 because revenues increased at a
higher rate than did total expenses.
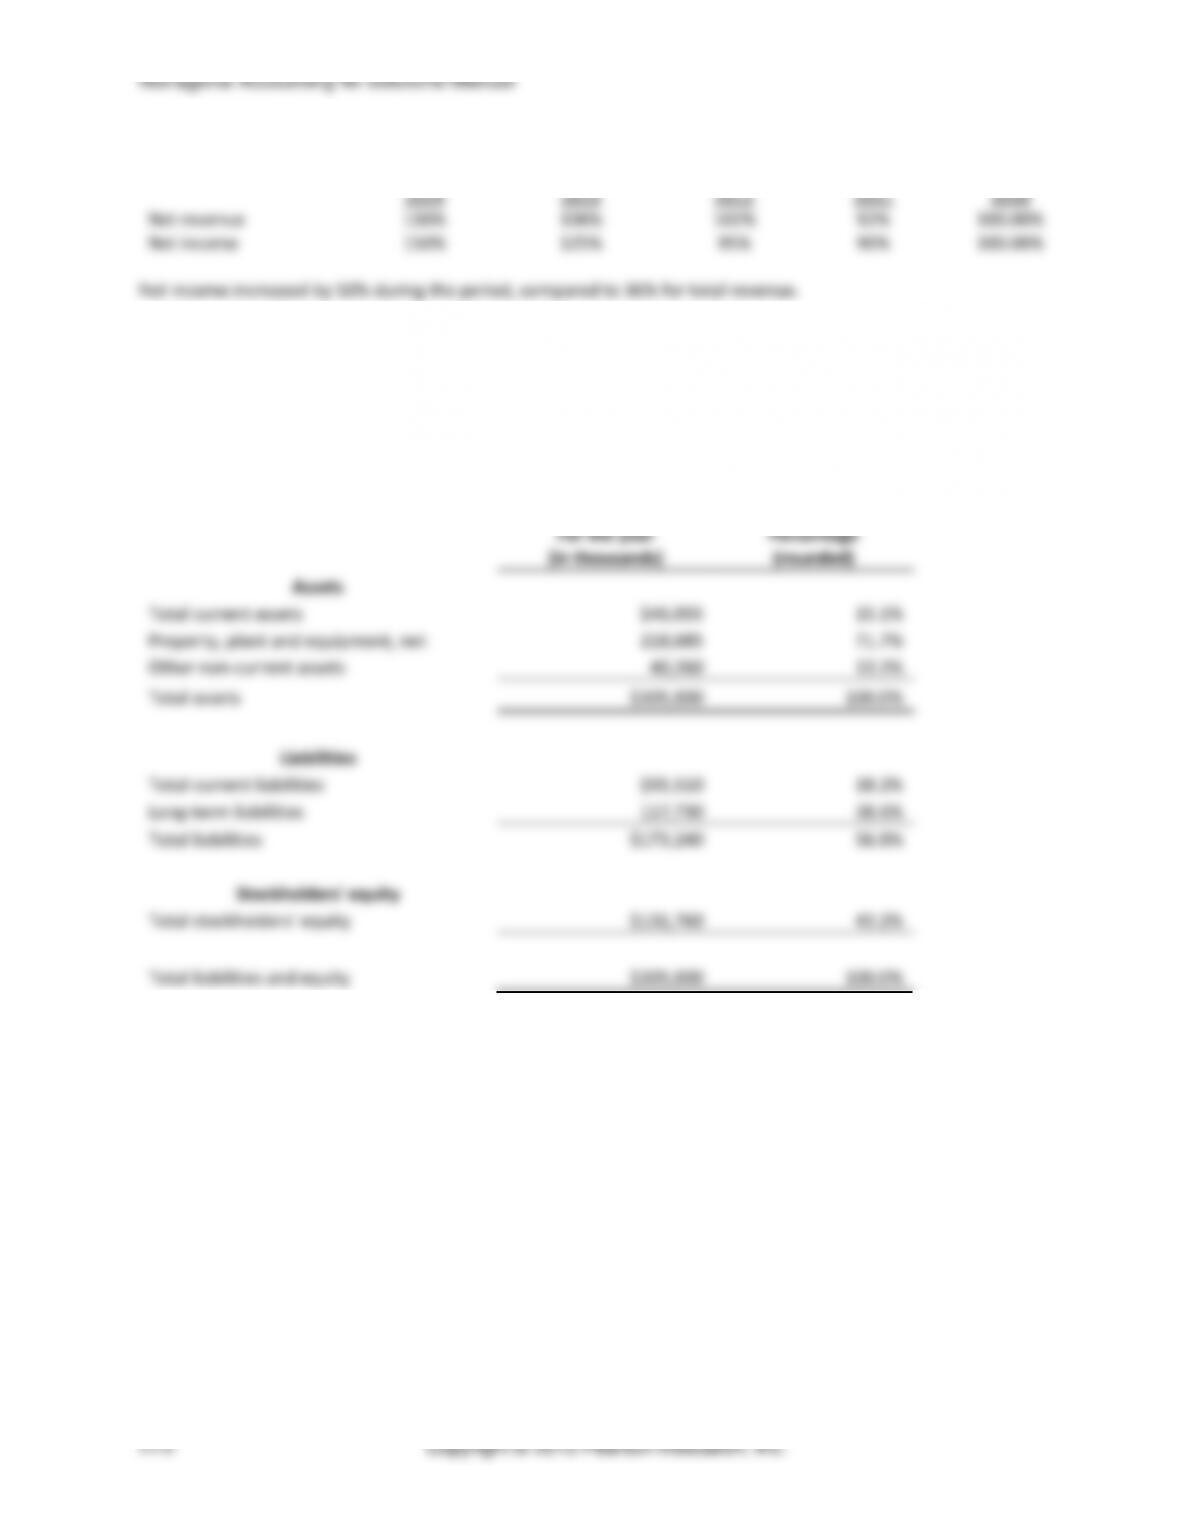
(5-10 min.) E14-24B
Trend percentages:
2014
2013
2012
2011
2010
Net revenue
130%
125%
105%
95%
100%
Net income
144%
132%
92%
84%
100%
Net income grew by 44% during the period, compared to 30% for total revenue.
Chapter 14 Financial Statement Analysis
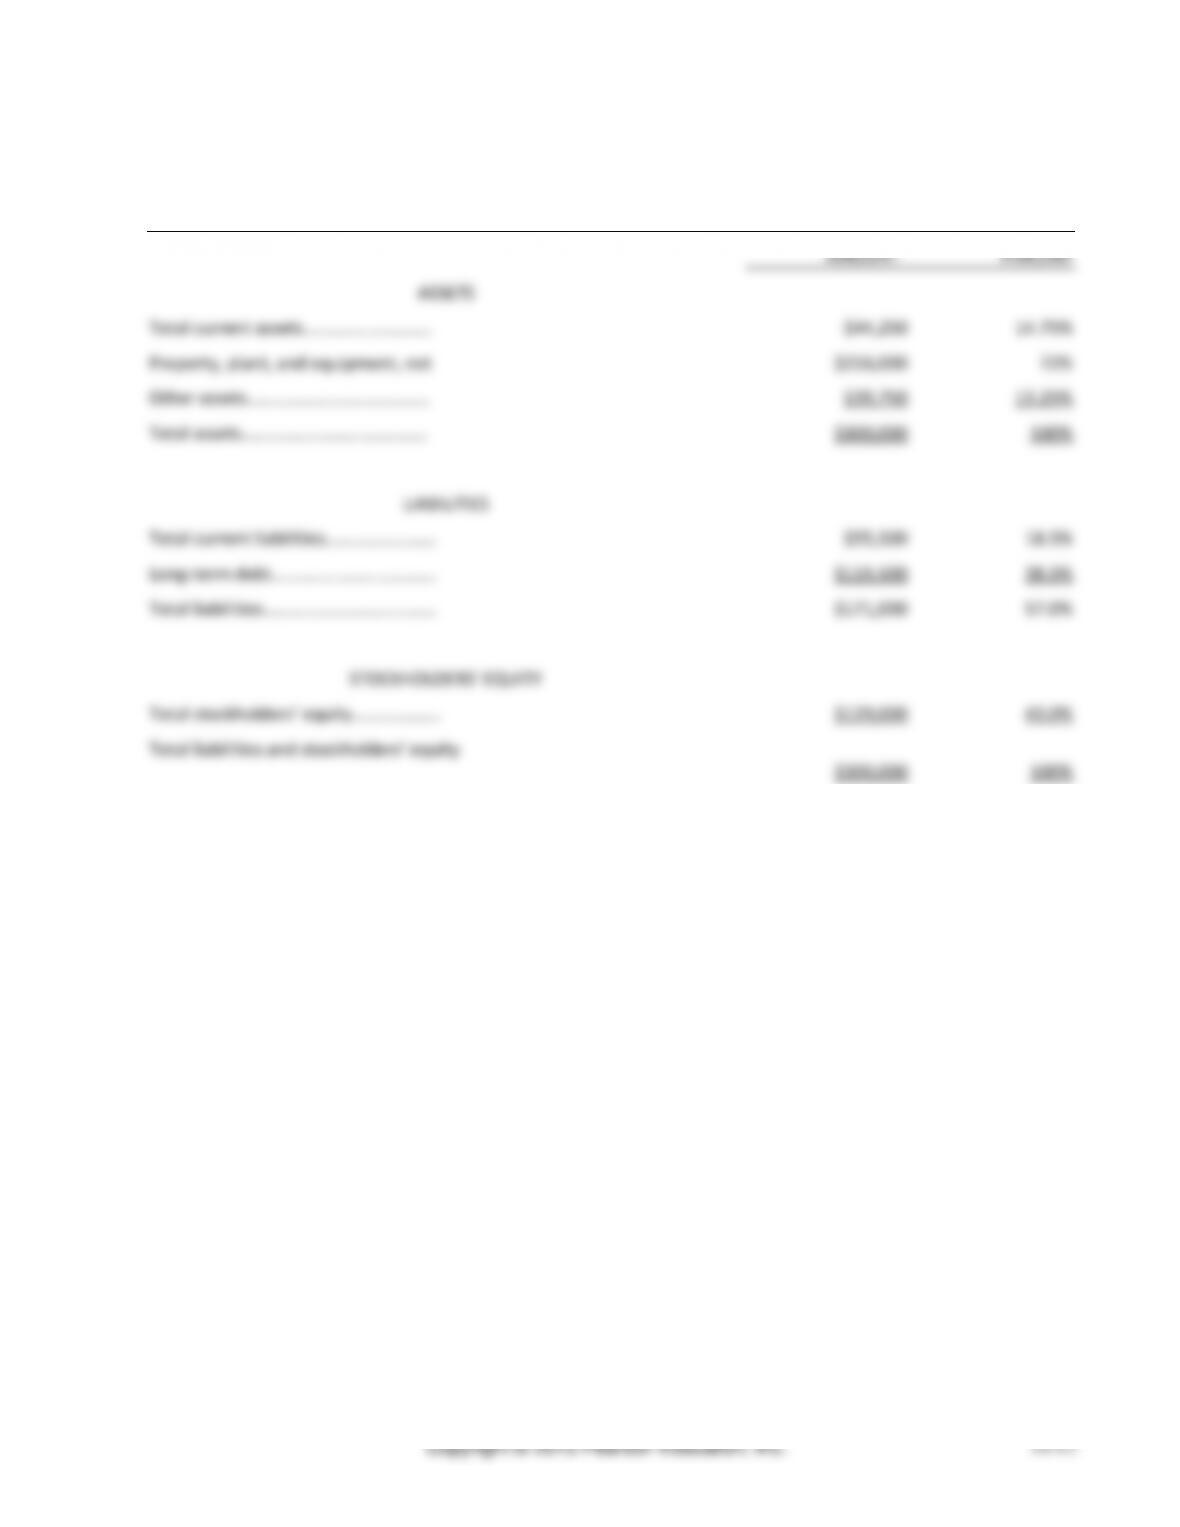
(10-15 min.) E14-25B
Eta Designs, Inc.
Vertical Analysis of Balance Sheet
As of December 31
AMOUNT
PERCENT
ASSETS
Total current assets………………………..
$44,250
14.75%
Property, plant, and equipment, net
$216,000
72%
Other assets…………………………………..
$39,750
13.25%
Total assets……………………………………
$300,000
100%
LIABILITIES
Total current liabilities…………………….
$55,500
18.5%
Long-term debt……………………………….
$115,500
38.5%
Total liabilities…………………………………
$171,000
57.0%
STOCKHOLDERS’ EQUITY
Total stockholders’ equity………………..
$129,000
43.0%
Total liabilities and stockholders’ equity
$300,000
100%
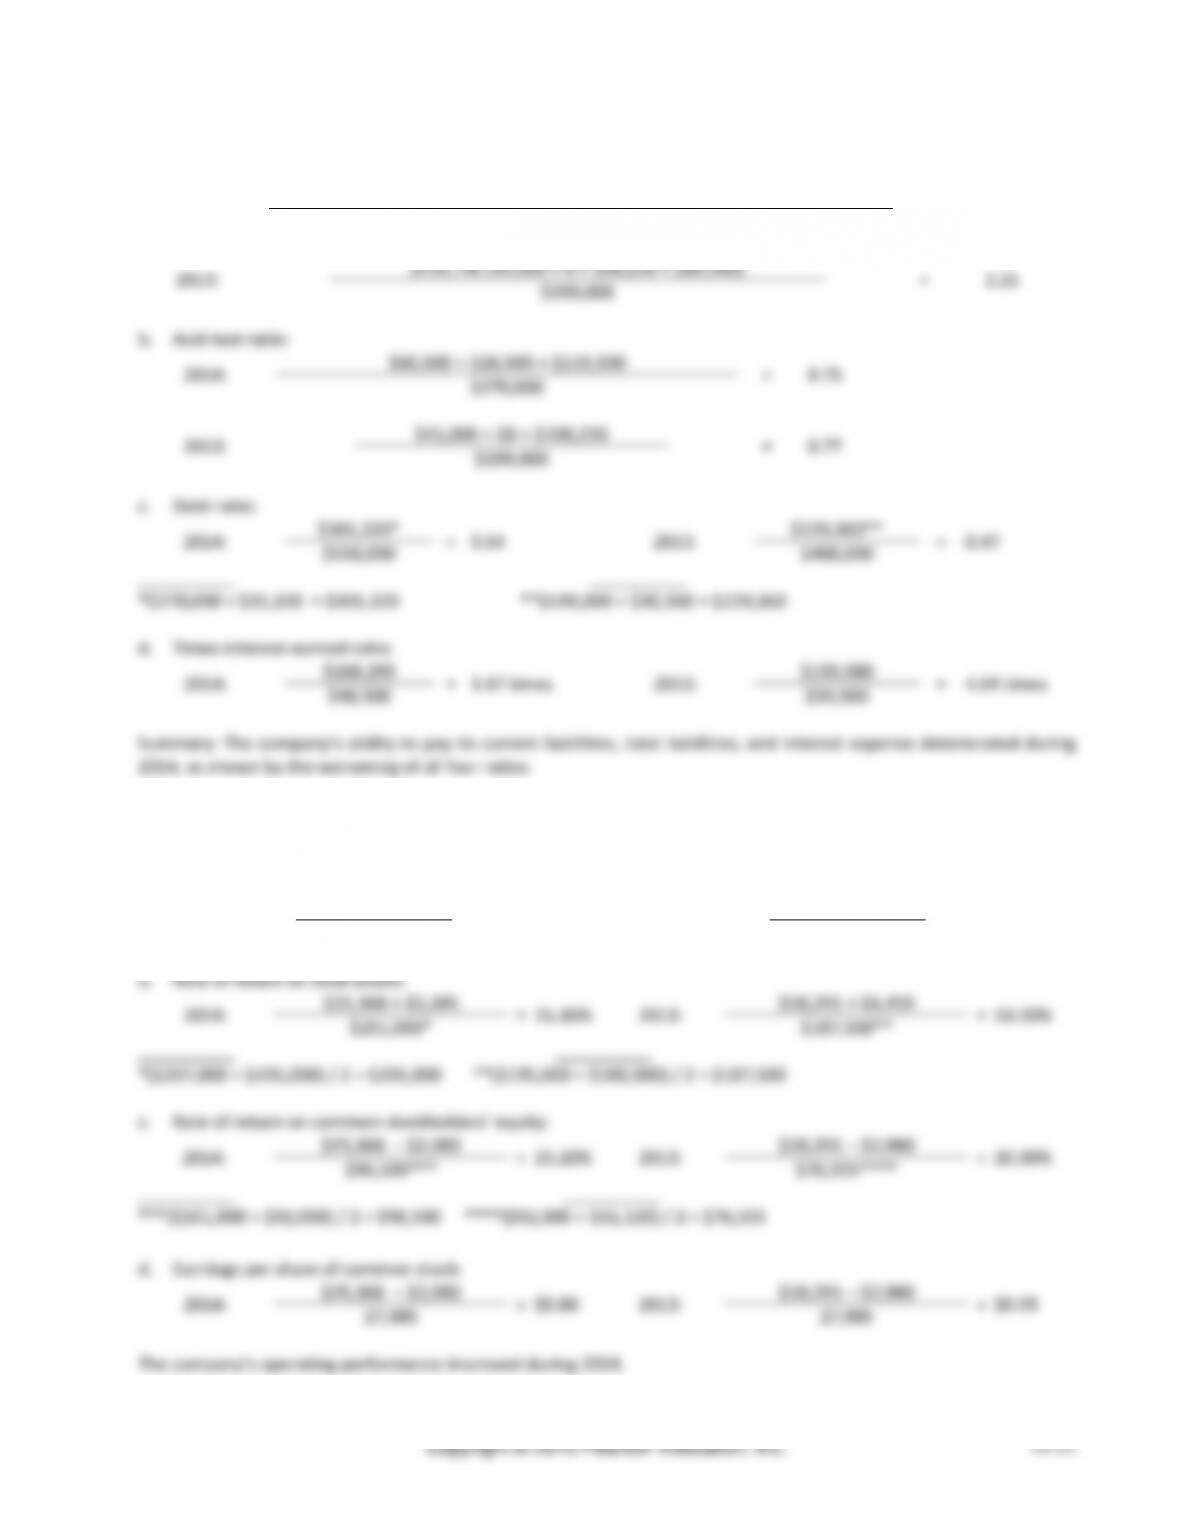
Chapter 14 Financial Statement Analysis
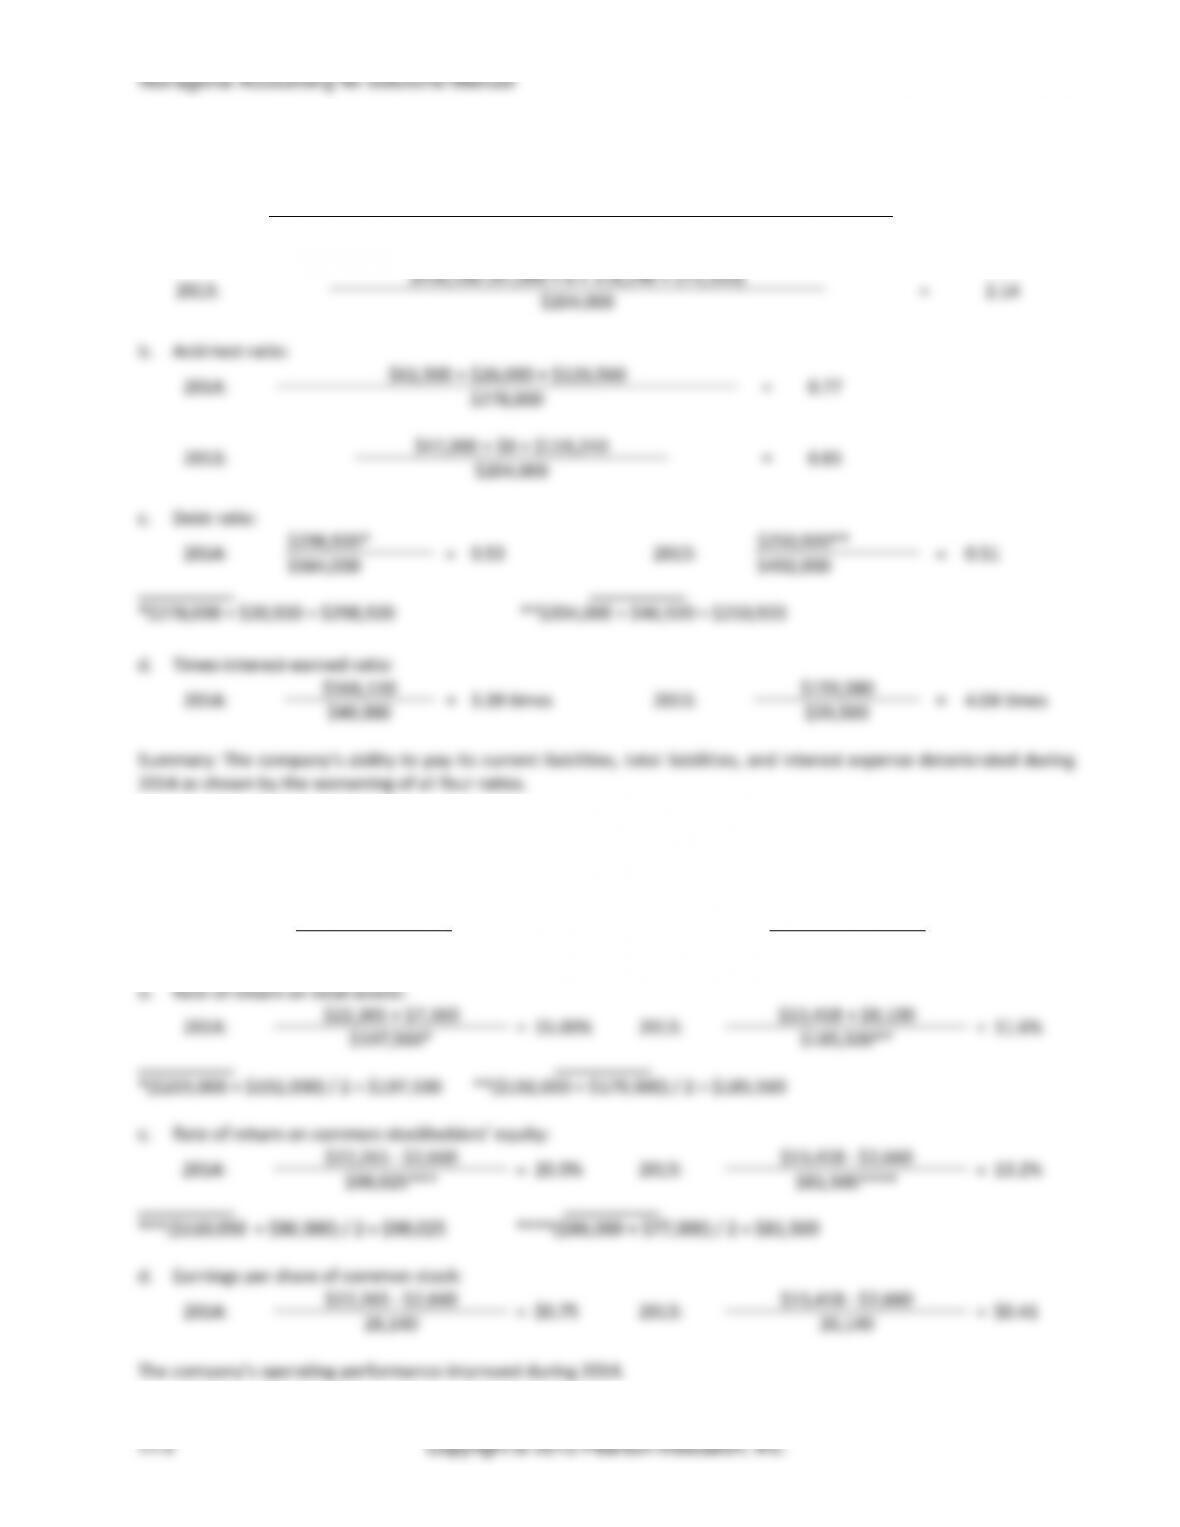
(15-20 min.) E14-28B
a. Current ratio:
2014:
$429,300 (60,500 + 26,500 + 115,500 + 226,800)
=
1.59
$270,000
2013:
$439,790 (45,000 + 0 + 108,230 + 286,560)
=
2.21
$199,000
b. Acid-test ratio:
2014:
$60,500 + $26,500 + $115,500
=
0.75
$270,000
2013:
$45,000 + $0 + $108,230
=
0.77
$199,000
c. Debt ratio:
2014:
$301,320*
=
0.54
2013:
$229,360**
=
0.47
$558,000
$488,000
2014:
$168,295
=
3.47 times
2013:
$159,580
=
4.04 times
2014:
$25,368
=
2013:
$18,291
=
2014:
2013:
2014:
2013:
2014:
2013:
Chapter 14 Financial Statement Analysis
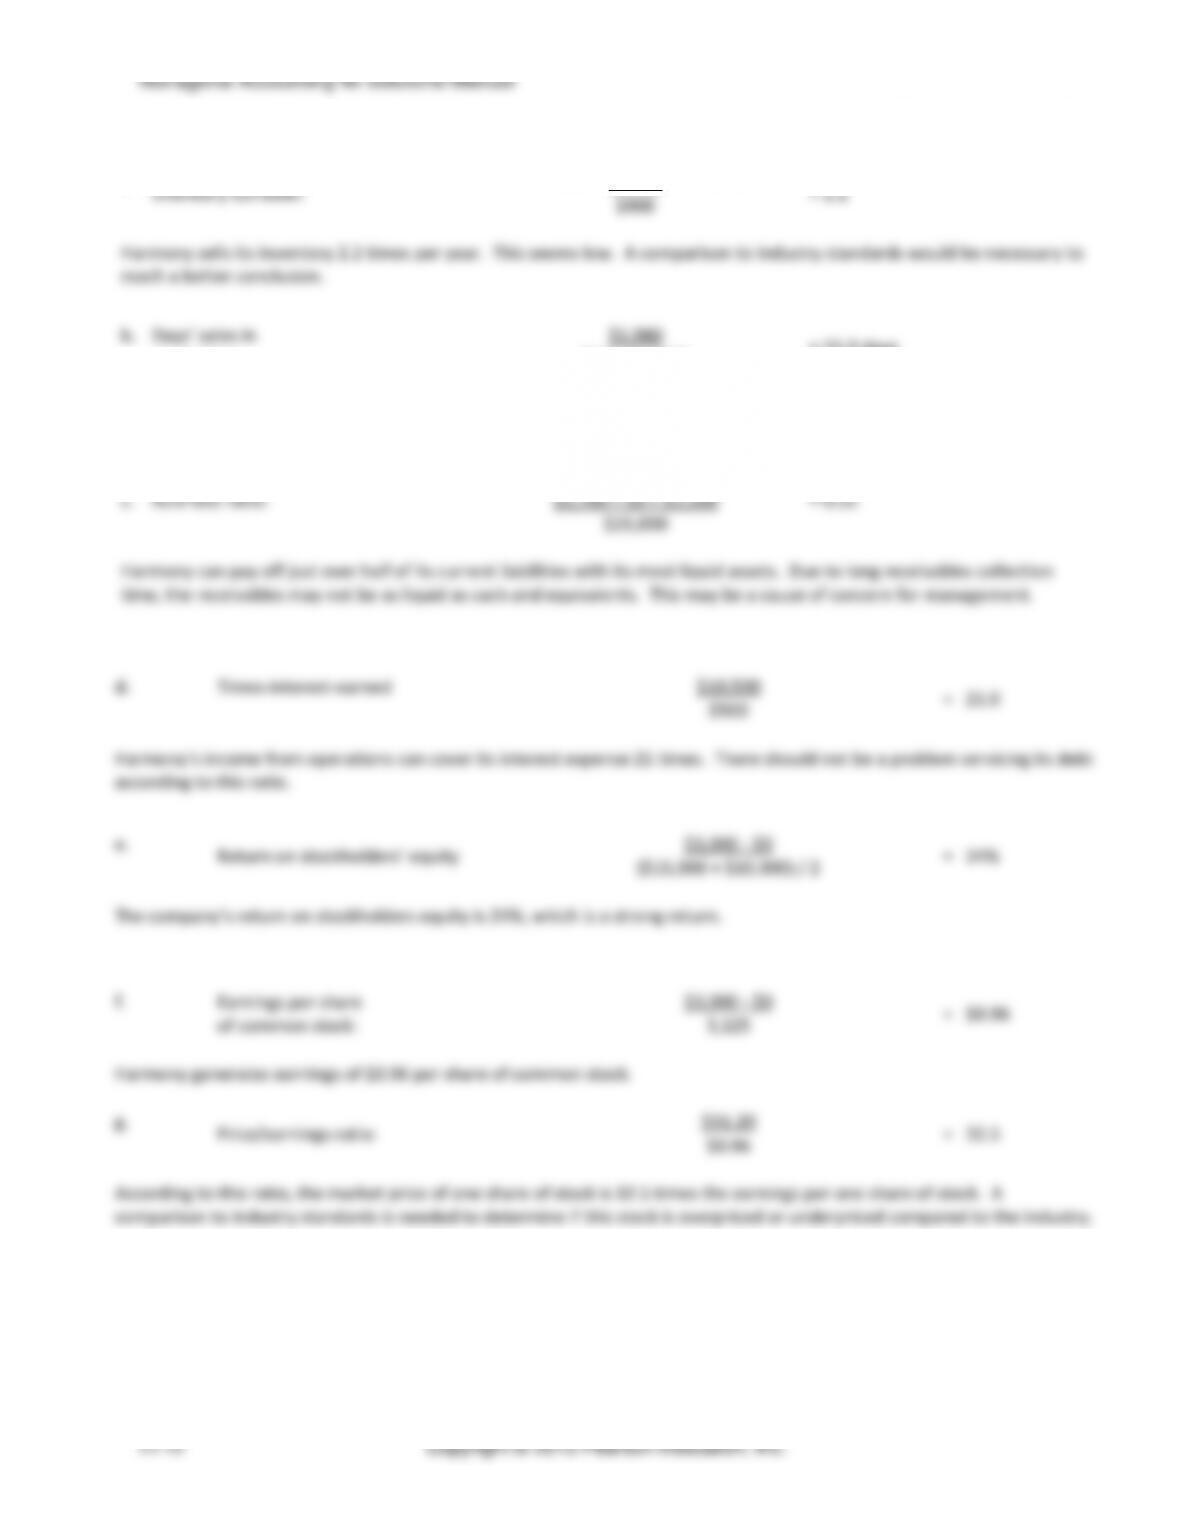
(20-30 min.) E14-31B
a.
Inventory turnover:
$5,400
=
3.0
$1,800
Jannus sells its inventory 3 times per year. This seems low. A comparison to industry standards would be
necessary to reach a better conclusion.
b.
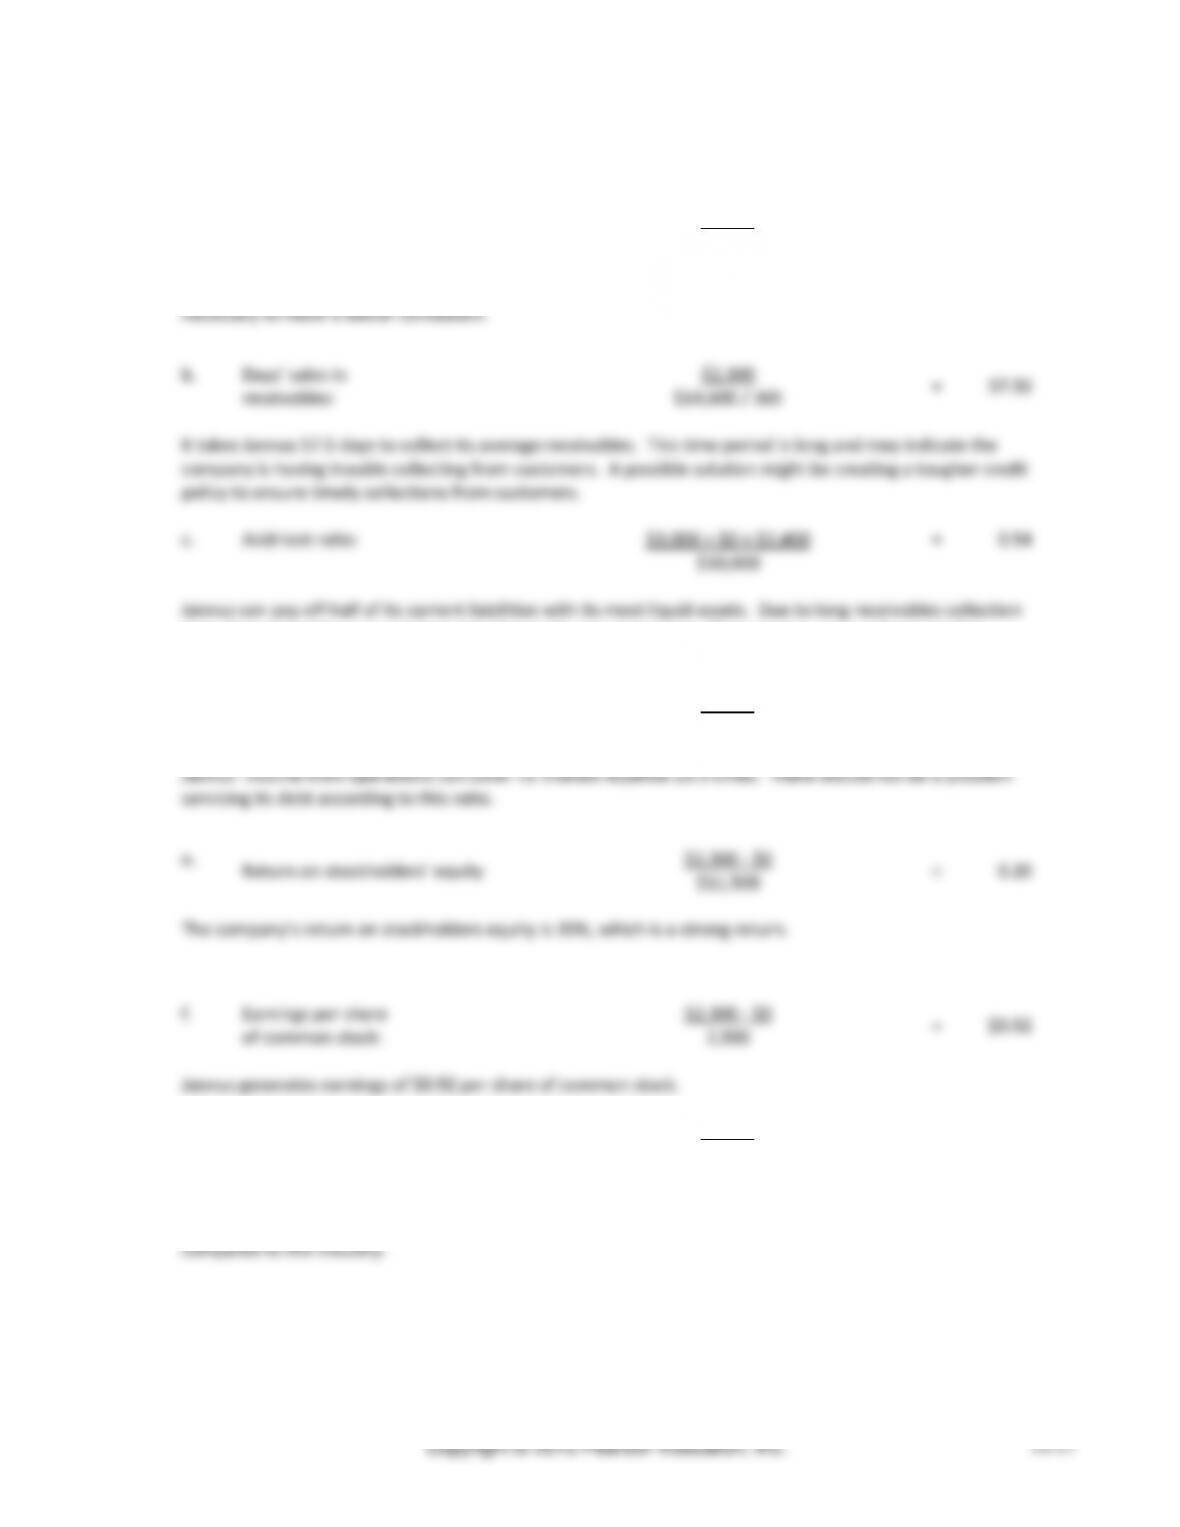
Days’ sales in
receivables:
$2,300
=
57.50
$14,600 / 365
It takes Jannus 57.5 days to collect its average receivables. This time period is long and may indicate the
company is having trouble collecting from customers. A possible solution might be creating a tougher credit
policy to ensure timely collections from customers.
c.
Acid-test ratio:
$3,000 + $0 + $2,400
=
0.54
$10,000
Jannus can pay off half of its current liabilities with its most liquid assets. Due to long receivables collection
time, the receivables may not be as liquid as cash and equivalents. This may be a cause of concern for
management.
d.
Times-interest-earned
$4,700
=
23.5
$200
Jannus’ income from operations can cover its interest expense 23.5 times. There should not be a problem
servicing its debt according to this ratio.
e.
Return on stockholders’ equity
$2,300 – $0
$11,500
=
0.20
The company’s return on stockholders equity is 20%, which is a strong return.
f.
Earnings per share
of common stock:
$2,300 – $0
=
$0.92
2,500
Jannus generates earnings of $0.92 per share of common stock.
g.
Price/earnings ratio:
$34.50
=
37.5
$0.92
According to this ratio, the market price of one share of stock is 37.5 times the earnings per one share of
stock. A comparison to industry standards is needed to determine if this stock is overpriced or underpriced
compared to the industry.