Chapter 10 Performance Evaluation
(15-20 min.) E10-37B
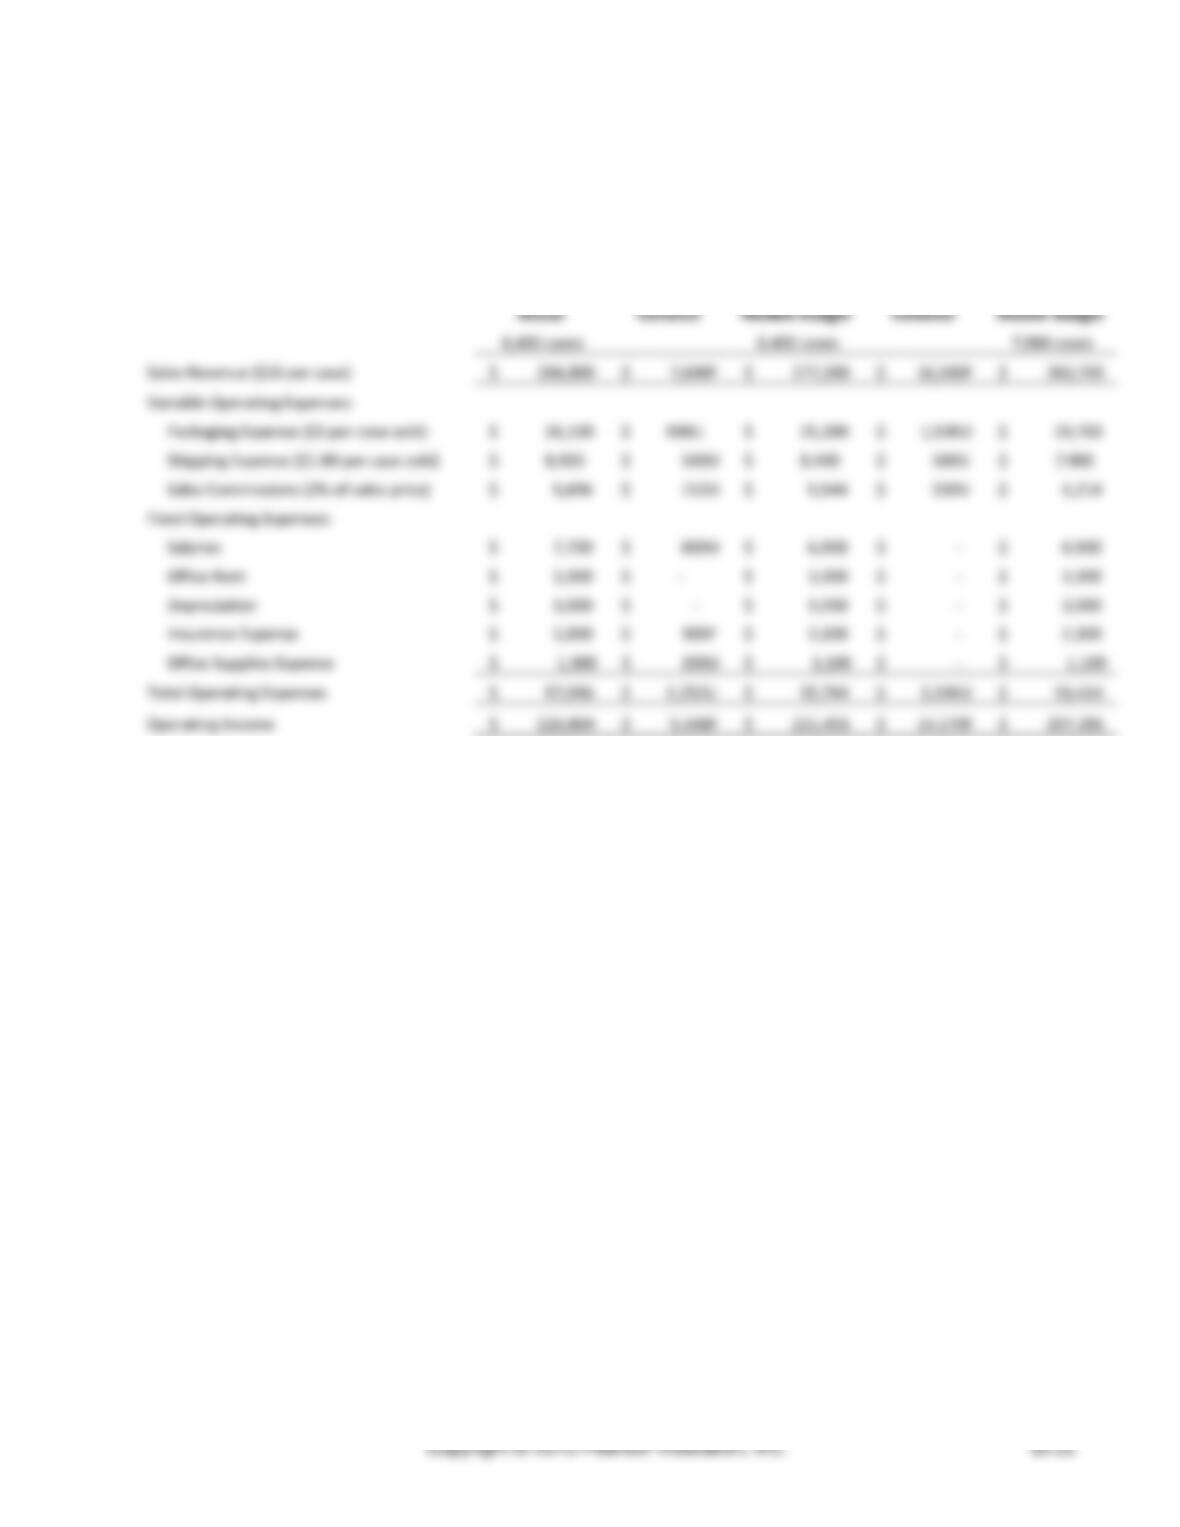
Sweet Street Muffins
Flexible Budget Performance Report – Sales and Operating Expenses
For Year Ended December 31
Actual
Flexible
Budget
Variance
Flexible Budget
Volume
Variance
Master Budget
8,400 cases
8,400 cases
7,900 cases
Sales Revenue ($33 per case)
$ 284,800
$ 7,600F
$ 277,200
$ 16,500F
$ 260,700
Variable Operating Expenses:
Packaging Expense ($3 per case sold)
$ 26,100
$ 900U
$ 25,200
$ 1,500U
$ 23,700
Shipping Expense ($1.00 per case sold)
$ 8,900
$ 500U
$ 8,400
$ 500U
$ 7,900
Sales Commissions (2% of sales price)
$ 5,696
$ 152U
$ 5,544
$ 330U
$ 5,214
Fixed Operating Expenses:
Salaries
$ 7,700
$ 800U
$ 6,900
$ –
$ 6,900
Office Rent
$ 3,300
$ –
$ 3,300
$ –
$ 3,300
Depreciation
$ 3,000
$ –
$ 3,000
$ –
$ 3,000
Insurance Expense
$ 2,000
$ 300F
$ 2,300
$ –
$ 2,300
Office Supplies Expense
$ 1,300
$ 200U
$ 1,100
$ –
$ 1,100
Total Operating Expenses
$ 57,996
$ 2,252U
$ 55,744
$ 2,330U
$ 53,414
Operating Income
$ 226,804
$ 5,348F
$ 221,456
$ 14,170F
$ 207,286
Chapter 10 Performance Evaluation
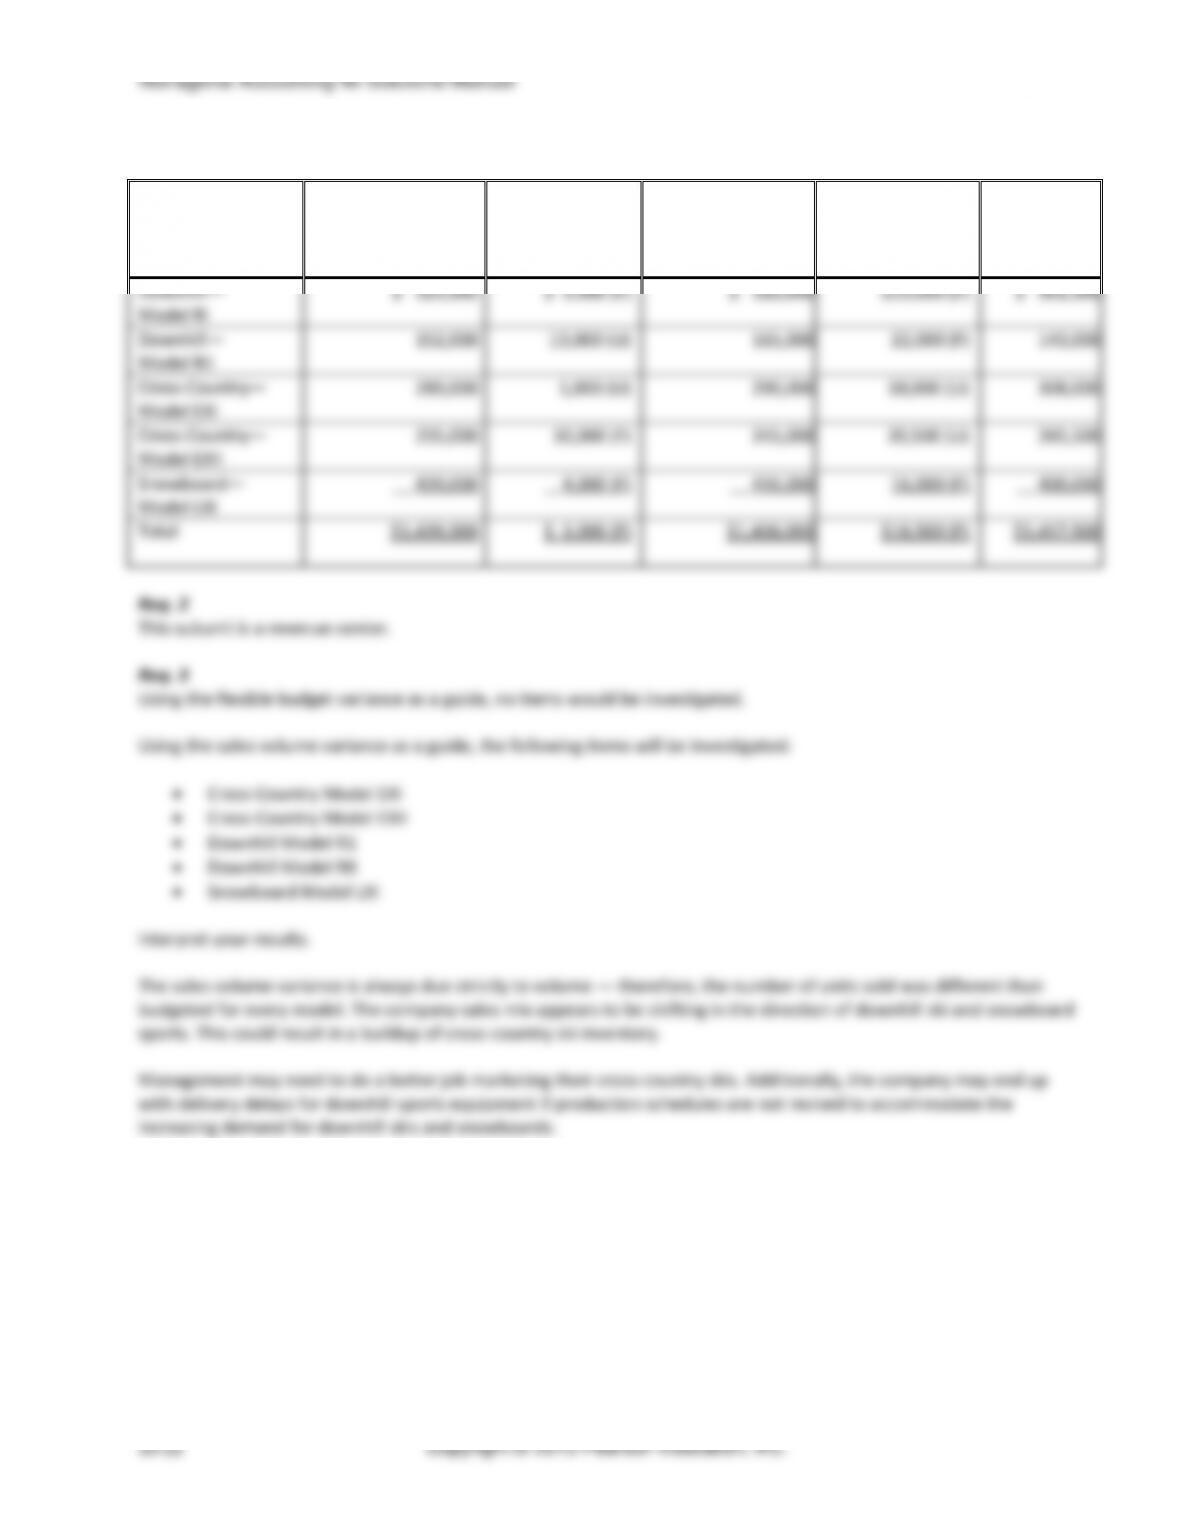
(15-20 min.) E10-39B
a. Flexible budget variance
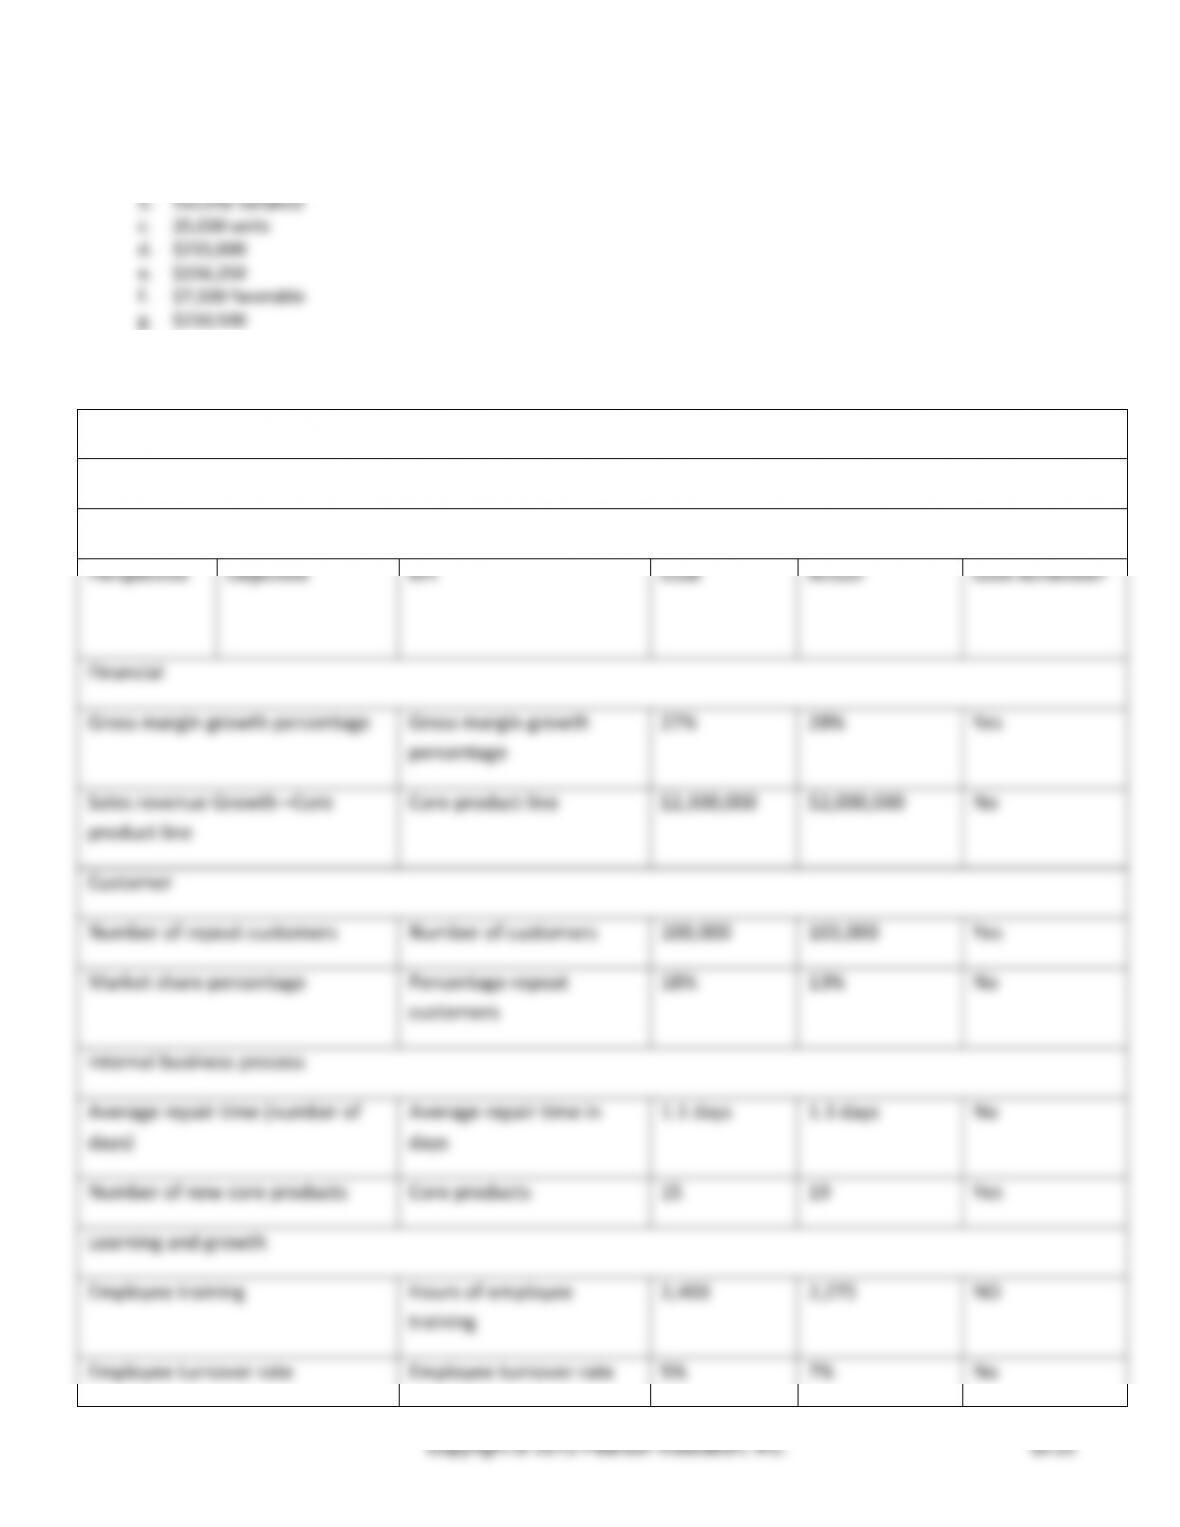
(15-20 min.) E10-40B
Jubilee Corporation
Balanced Scorecard Report
For Quarter Ended December 31
Perspective
Objective
KPI
Goal
Actual
Goal Achieved?
Financial
Gross margin growth percentage
Gross margin growth
percentage
27%
28%
Yes
Sales revenue Growth –Core
product line
Core product line
$2,300,000
$2,000,000
No
Customer
Number of repeat customers
Number of customers
100,000
103,000
Yes
Market share percentage
Percentage repeat
customers
18%
13%
No
Internal business process
Average repair time (number of
days)
Average repair time in
days
1.1 days
1.3 days
No
Number of new core products
Core products
15
19
Yes
Learning and growth
Employee training
Hours of employee
training
2,400
2,275
NO
Employee turnover rate
Employee turnover rate
5%
7%
No
Chapter 10 Performance Evaluation
Problems (Group A)
(20-25 min.) P10-42A
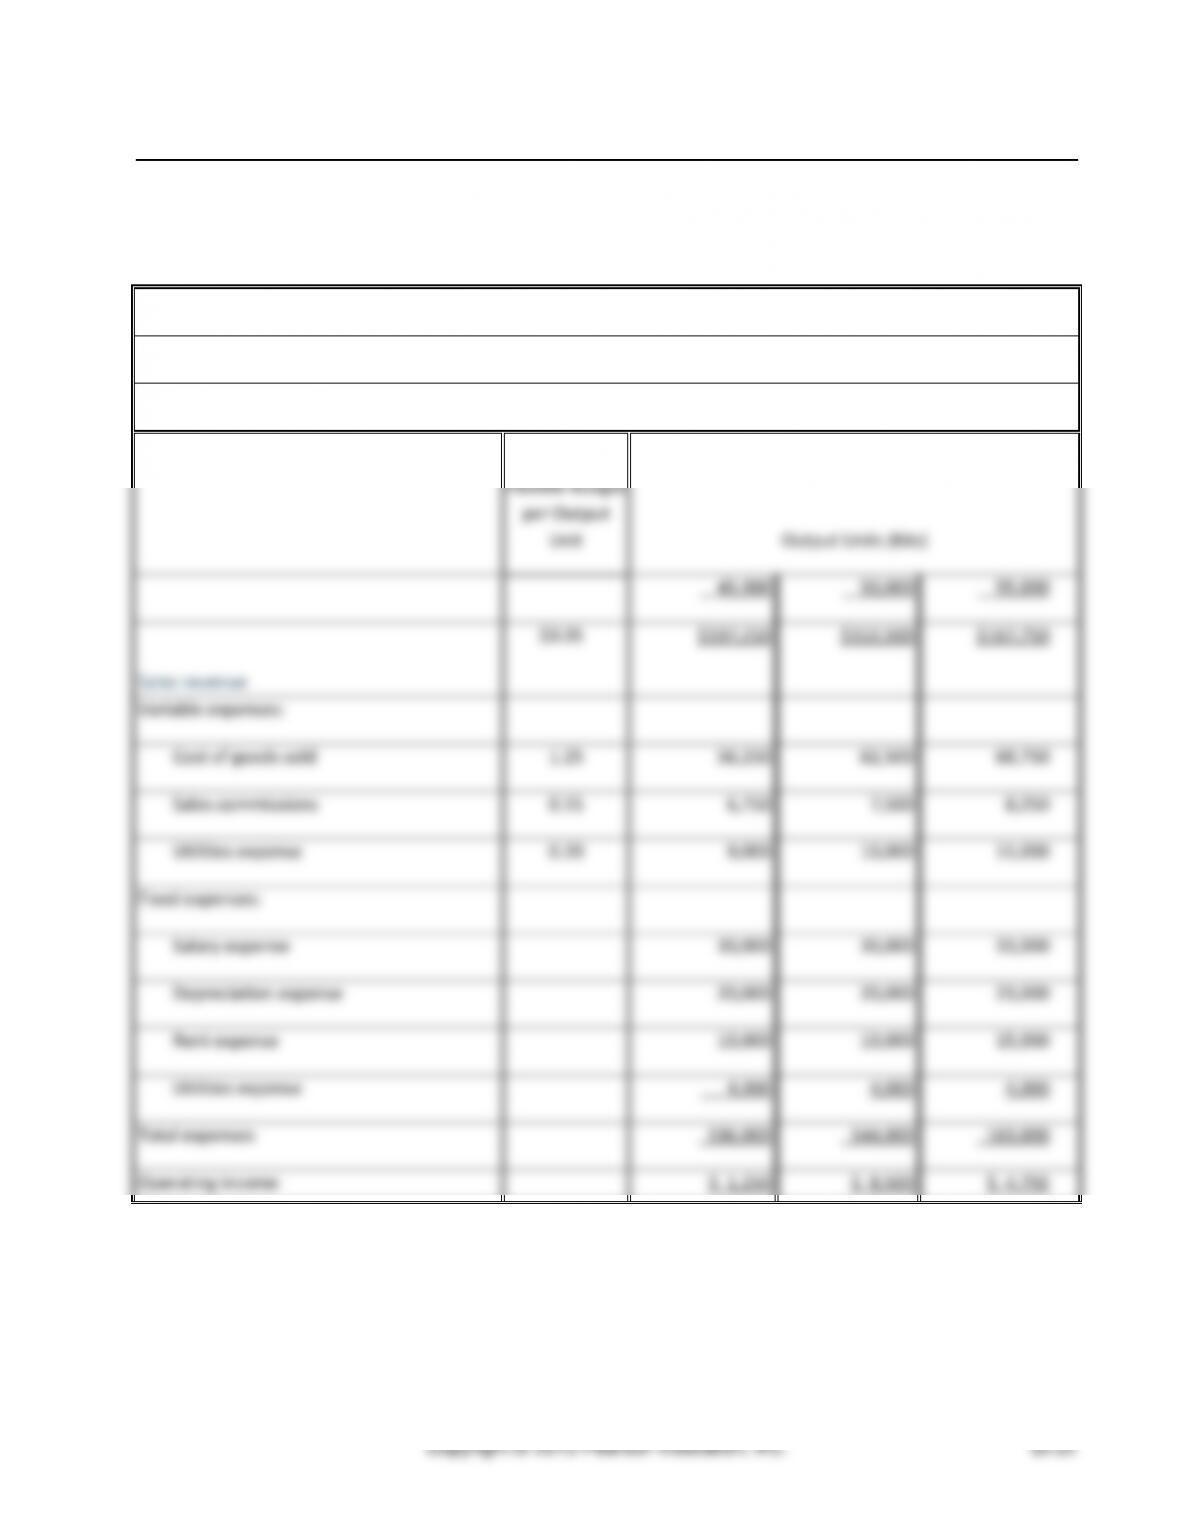
Req. 1
Lively Bubbles, Inc.
Flexible Budget Income Statement
Month Ended July 31
Flexible Budget
per Output
Unit
Output Units (Kits)
45,000
50,000
55,000
Sales revenue
$3.05
$137,250
$152,500
$167,750
Variable expenses:
Cost of goods sold
1.25
56,250
62,500
68,750
Sales commissions
0.15
6,750
7,500
8,250
Utilities expense
0.20
9,000
10,000
11,000
Fixed expenses:
Salary expense
30,000
30,000
33,000
Depreciation expense
20,000
20,000
23,000
Rent expense
10,000
10,000
15,000
Utilities expense
4,000
4,000
4,000
Total expenses
136,000
144,000
163,000
Operating income
$ 1,250
$ 8,500
$ 4,750
Managerial Accounting 4e Solutions Manual
(continued) P10-42A
cost.
(15-20 min.) P10-43A
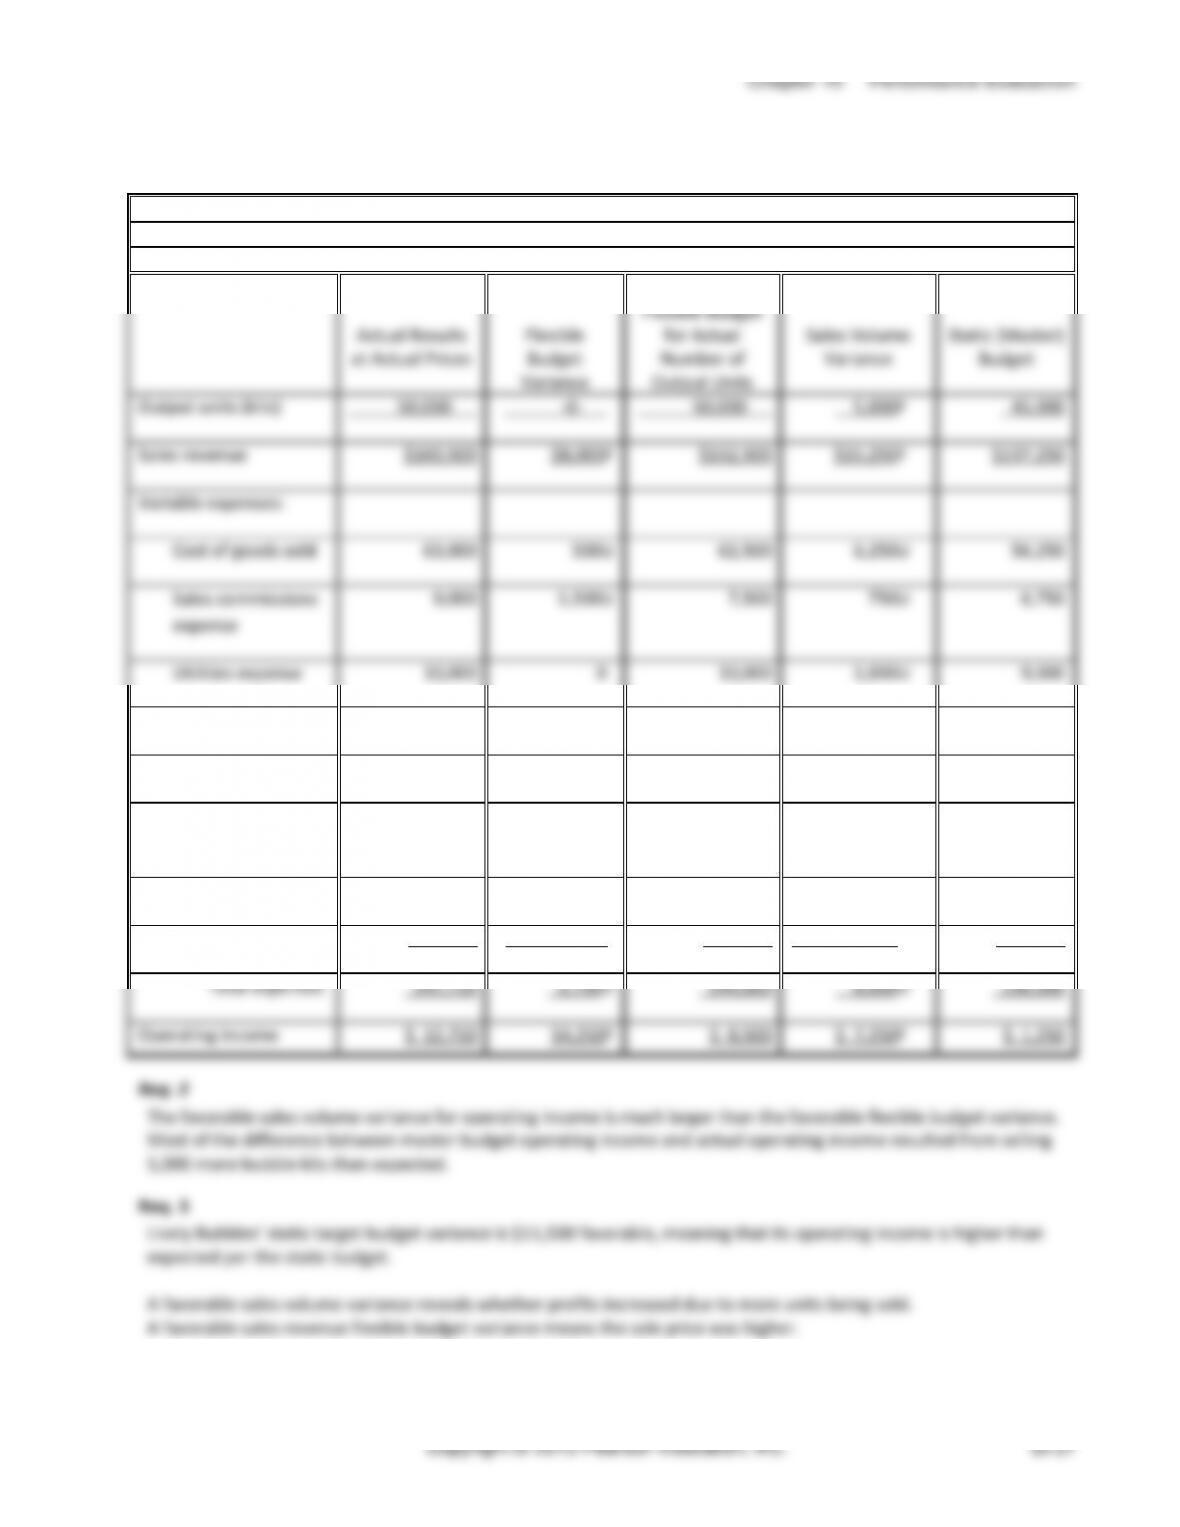
Req. 1
Lively Bubbles, Inc.
Income Statement Performance Report
Month Ended July 31
Actual Results
at Actual Prices
Flexible
Budget
Variance
Flexible Budget
for Actual
Number of
Output Units
Sales Volume
Variance
Static (Master)
Budget
Output units (kits)
50,000
-0-
50,000
5,000F
45,000
Sales revenue
$160,500
$8,000F
$152,500
$15,250F
$137,250
Variable expenses:
Cost of goods sold
63,000
500U
62,500
6,250U
56,250
Sales commissions
expense
9,000
1,500U
7,500
750U
6,750
Utilities expense
10,000
0
10,000
1,000U
9,000
Fixed expenses:
Salary expense
32,200
2,200U
30,000
0
30,000
Depreciation
expense
20,000
0
20,000
0
20,000
Rent expense
9,550
450F
10,000
0
10,000
Utilities expense
4,000
0
4,000
0
4,000
Total expenses
147,750
3,750U
144,000
8,000U
136,000
Operating income
$ 12,750
$4,250F
$ 8,500
$ 7,250F
$ 1,250
Req. 2
The favorable sales volume variance for operating income is much larger than the favorable flexible budget variance.
Most of the difference between master budget operating income and actual operating income resulted from selling
5,000 more bubble kits than expected.
Req. 3
Lively Bubbles’ static target budget variance is $11,500 favorable, meaning that its operating income is higher than
expected per the static budget.
A favorable sales volume variance reveals whether profits increased due to more units being sold.
A favorable sales revenue flexible budget variance means the sale price was higher.
Managerial Accounting 4e Solutions Manual
(15-20 min.) P10-44A
Req. 1
Paint Stores
Consumer
Operating income
$ 440,000
$ 148,200
÷ Total assets
÷$1,250,000
÷$1,425,000
Return on investment
35.2%
10.4%
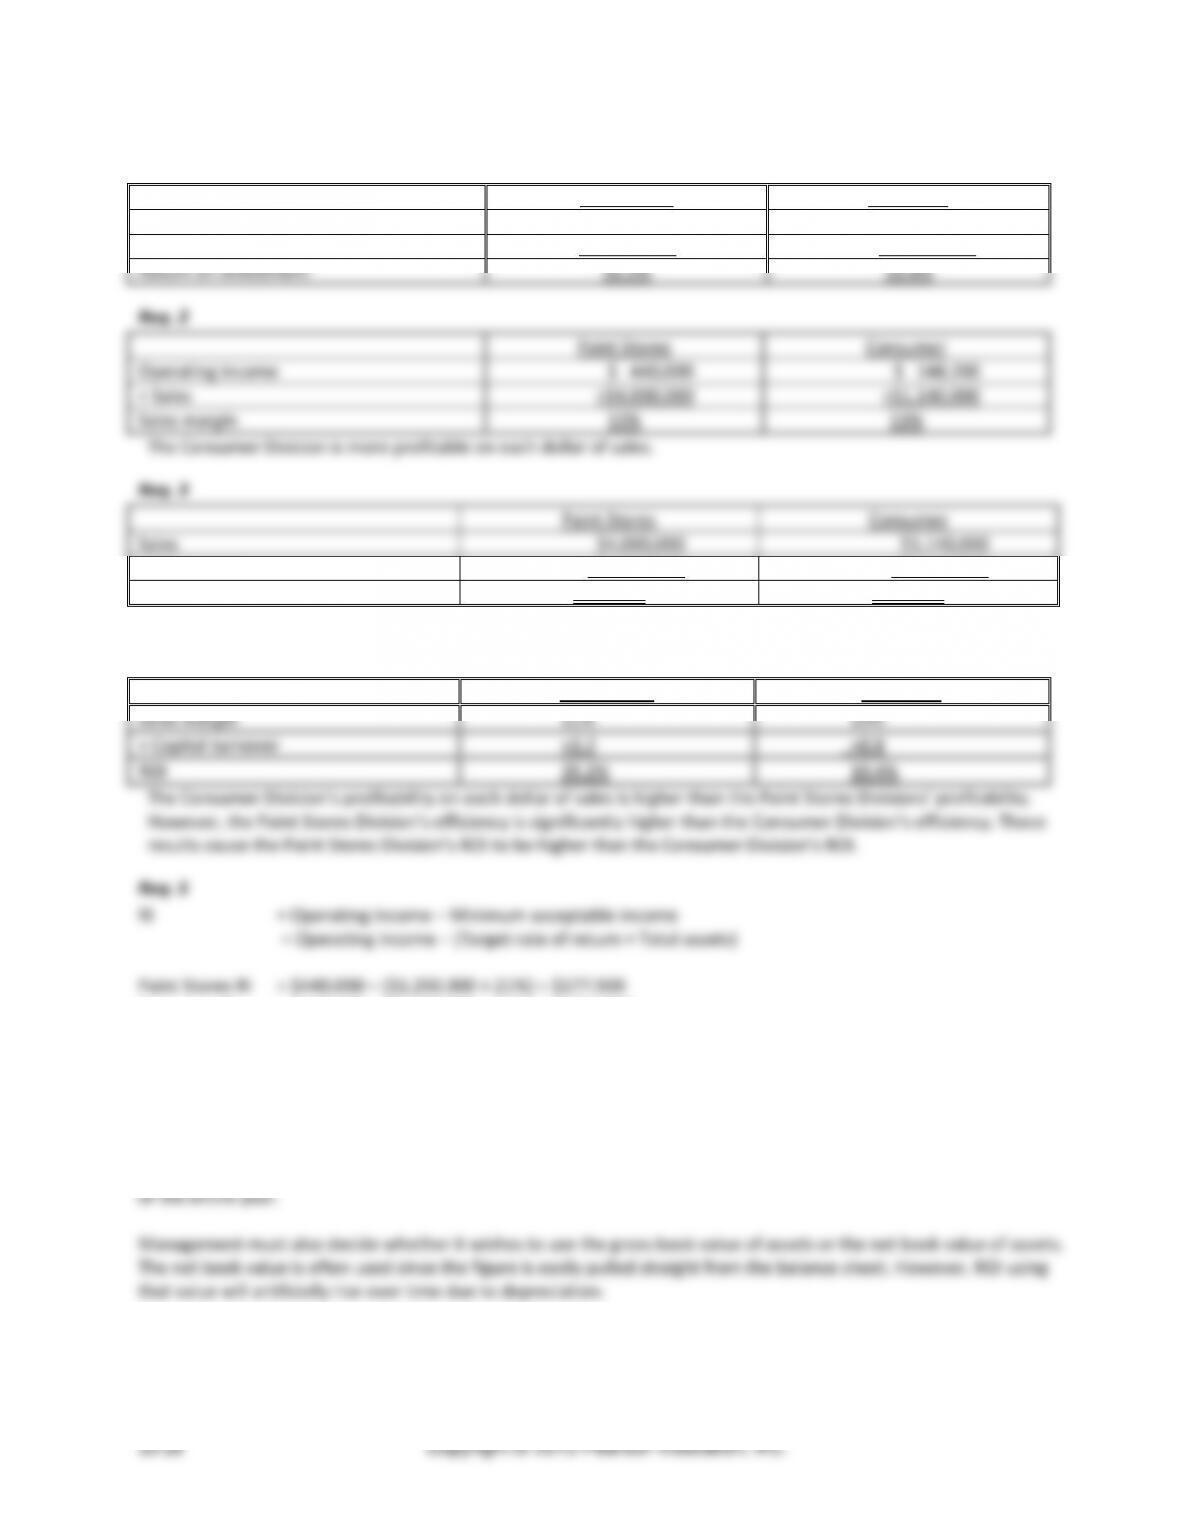
Req. 2
Paint Stores
Consumer
Operating income
$ 440,000
$ 148,200
÷ Sales
÷$4,000,000
÷$1,140,000
Sales margin
11%
13%
The Consumer Division is more profitable on each dollar of sales.
Req. 3
Paint Stores
Consumer
Sales
$4,000,000
$1,140,000
÷ Total assets
÷$1,250,000
÷$1,425,000
Capital turnover
3.2 times
0.8 times
The Paint Stores Division is more efficient in generating sales with its assets.
Req. 4
Paint Stores
Consumer
Sales margin
11%
13%
× Capital turnover
×3.2
×0.8
ROI
35.2%
10.4%
The Consumer Division’s profitability on each dollar of sales is higher than the Paint Stores Divisions’ profitability.
However, the Paint Stores Division’s efficiency is significantly higher than the Consumer Division’s efficiency. These
results cause the Paint Stores Division’s ROI to be higher than the Consumer Division’s ROI.
Req. 5
RI = Operating income − Minimum acceptable income
= Operating income − (Target rate of return × Total assets)
Paint Stores RI = $440,000 − ($1,250,000 × 21%) = $177,500
Consumer RI = $148,200 − ($1,425,000 × 21%) = $(151,050)
Only the Paint Stores Division is meeting management’s target rate of return. The Consumer Division should work on
improving its capital turnover rate. Improving the capital turnover rate may help the division achieve positive residual
income.
Req. 6
Most companies use the average asset balance since the income used in the ROI calculation is earned over the course
Chapter 10 Performance Evaluation
(continued) P10-44A
Req. 7
Risk level of the division’s business
assets.
Chapter 10 Performance Evaluation
(continued) P10-45A
Req. 4
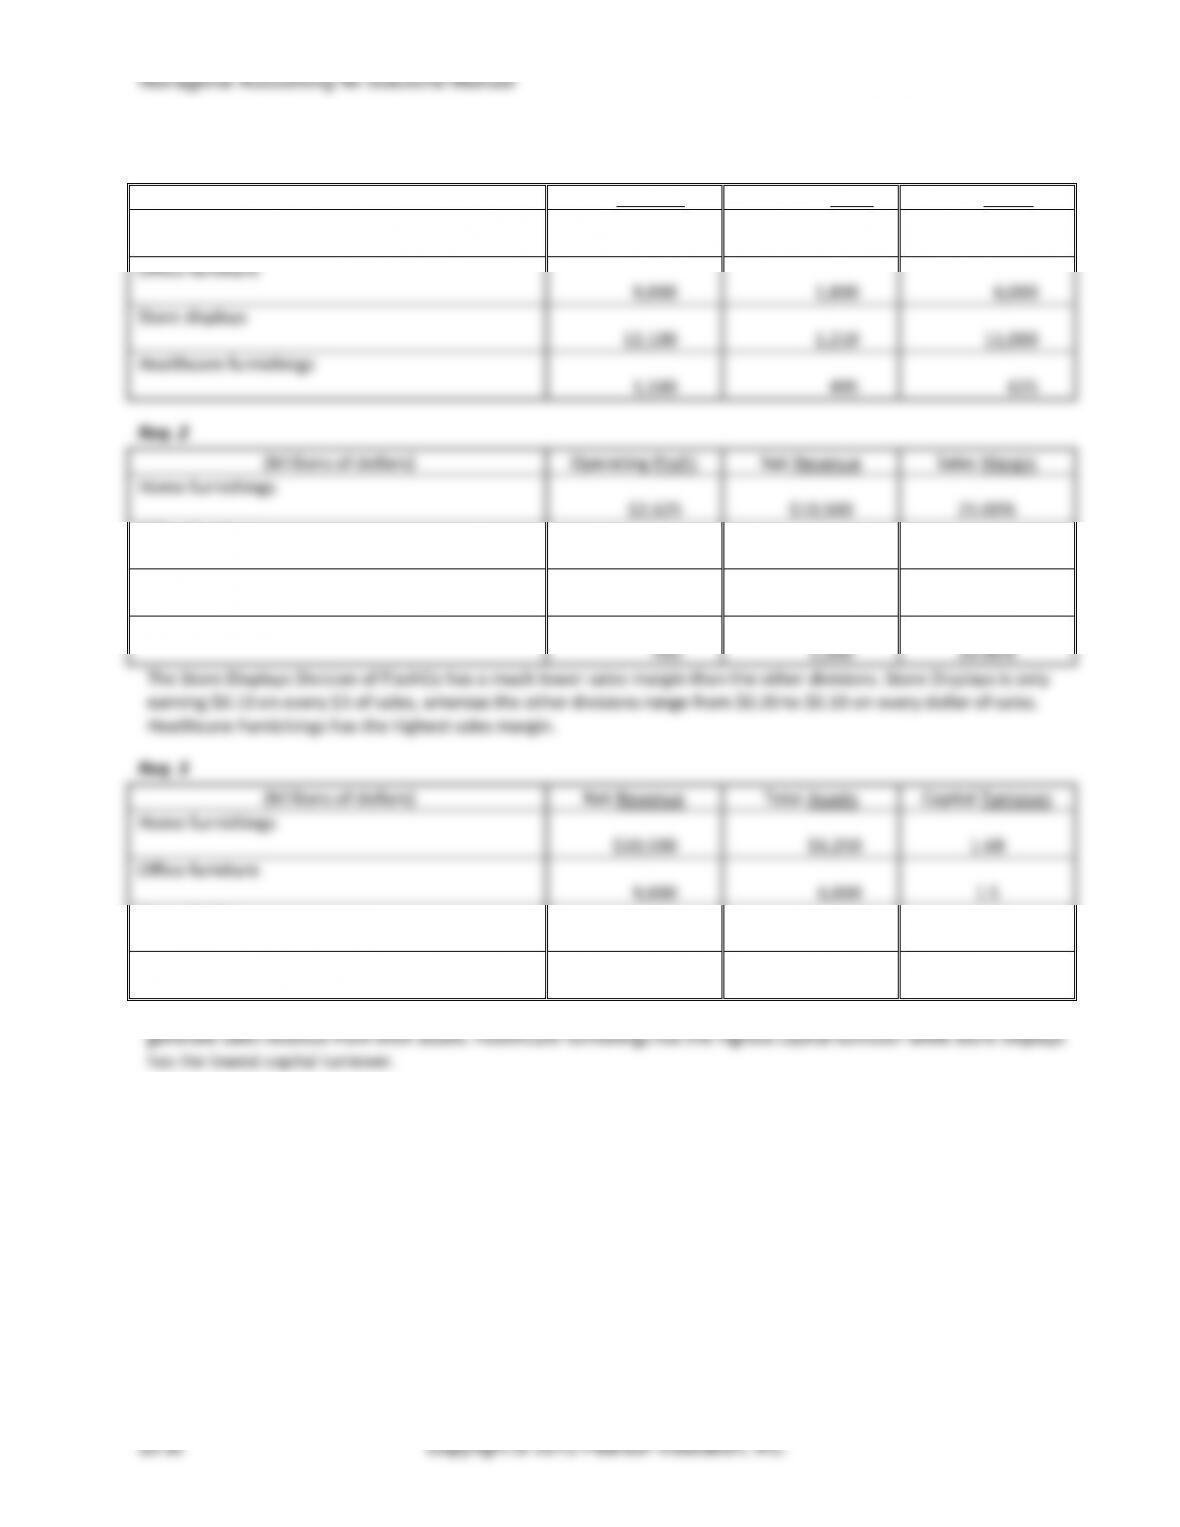
(Millions of dollars)
Operating Profit
Total Assets
ROI
Home furnishings
$2,625
$6,250
42.00%
Office furniture
1,800
6,000
30.00%
Store displays
1,210
11,000
11.00%
Healthcare furnishings
495
625
79.20%
Home furnishings and Healthcare furnishings have the highest ROI. Both of these divisions had the highest sales
margins, which is a factor as to why they have the highest ROI. Store Displays had the lowest ROI, in part driven by the
fact that it had the lowest sales margin of the four divisions.
Req. 5
Financial reporting is for the benefit of external users, not internal management. Therefore, not all company
information is disclosed in the financial statements. Residual income (RI) calculations involve management’s target rate
of return. Since this information is not presented, residual income cannot be calculated by an external user without
making an assumption about the rate.
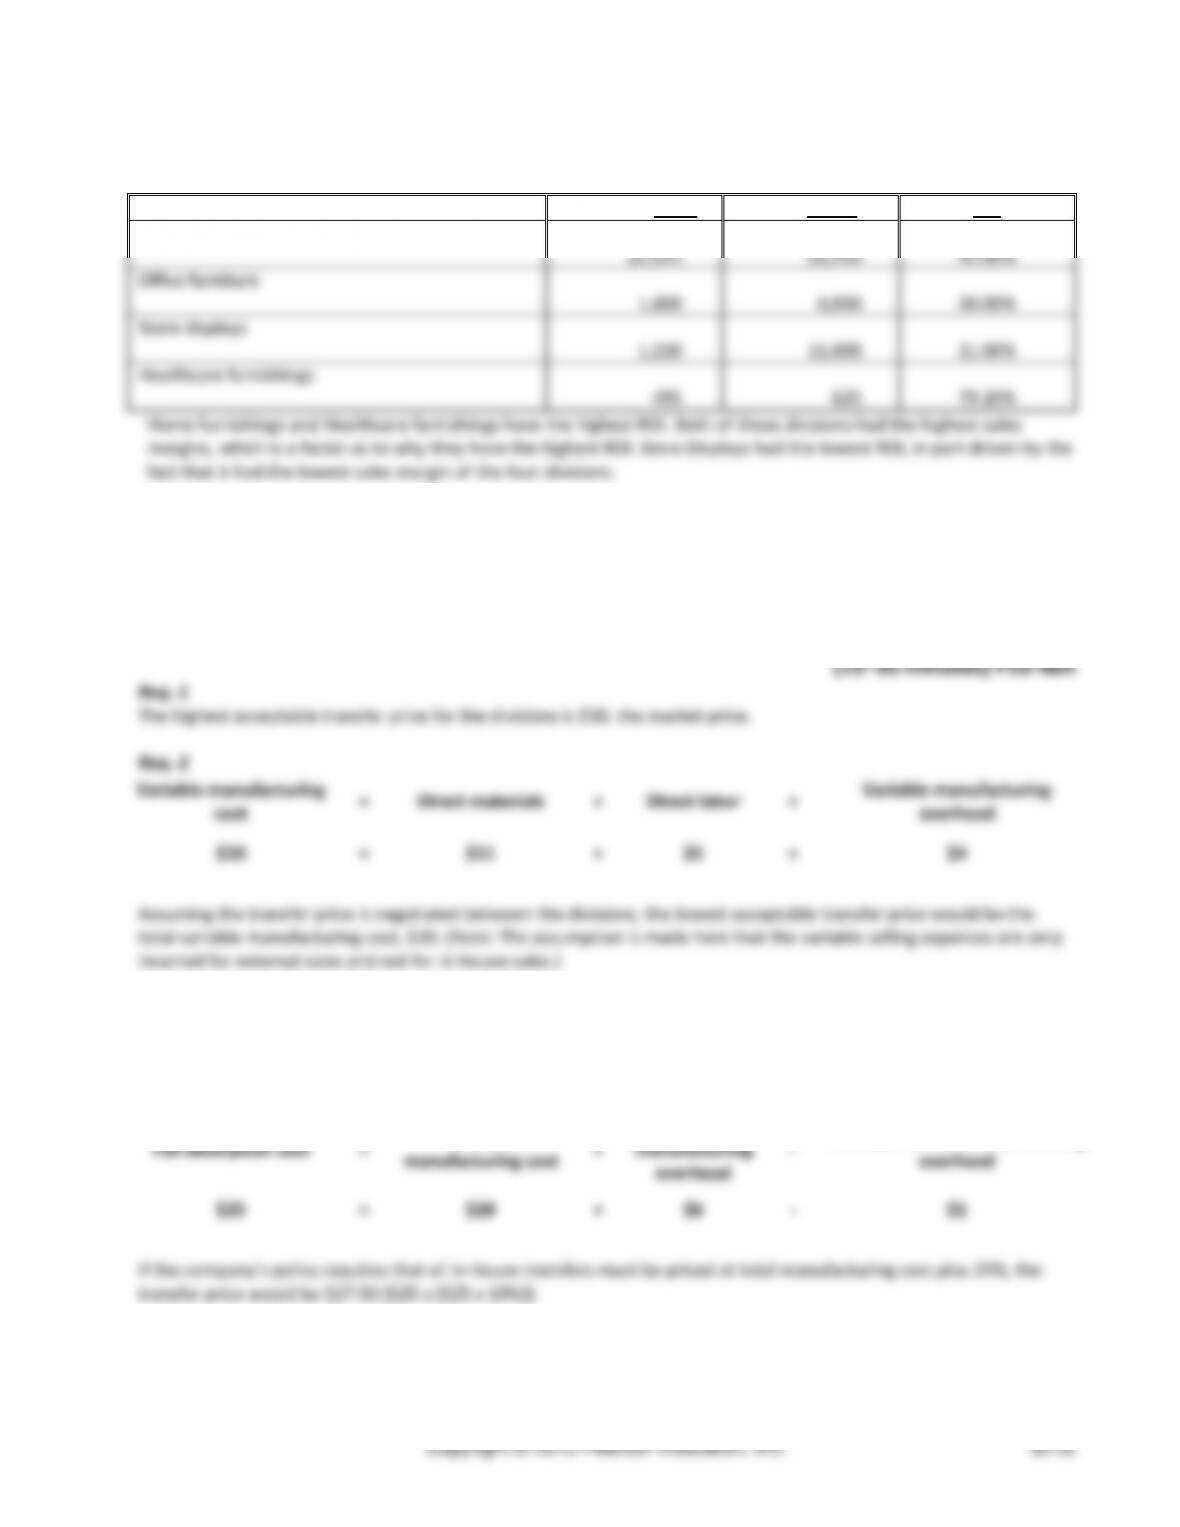
$20
=
$11
+
$5
$4
Req. 3
The manager of the Small Components Division would prefer the $30 transfer price. The manager of the Computer
Division would prefer the $20 transfer price.
Req. 4
Full absorption cost
=
Variable
manufacturing cost
+
Fixed
manufacturing
overhead
–
Decrease in fixed manufacturing
overhead
$25
=
$20
+
$6
–
$1
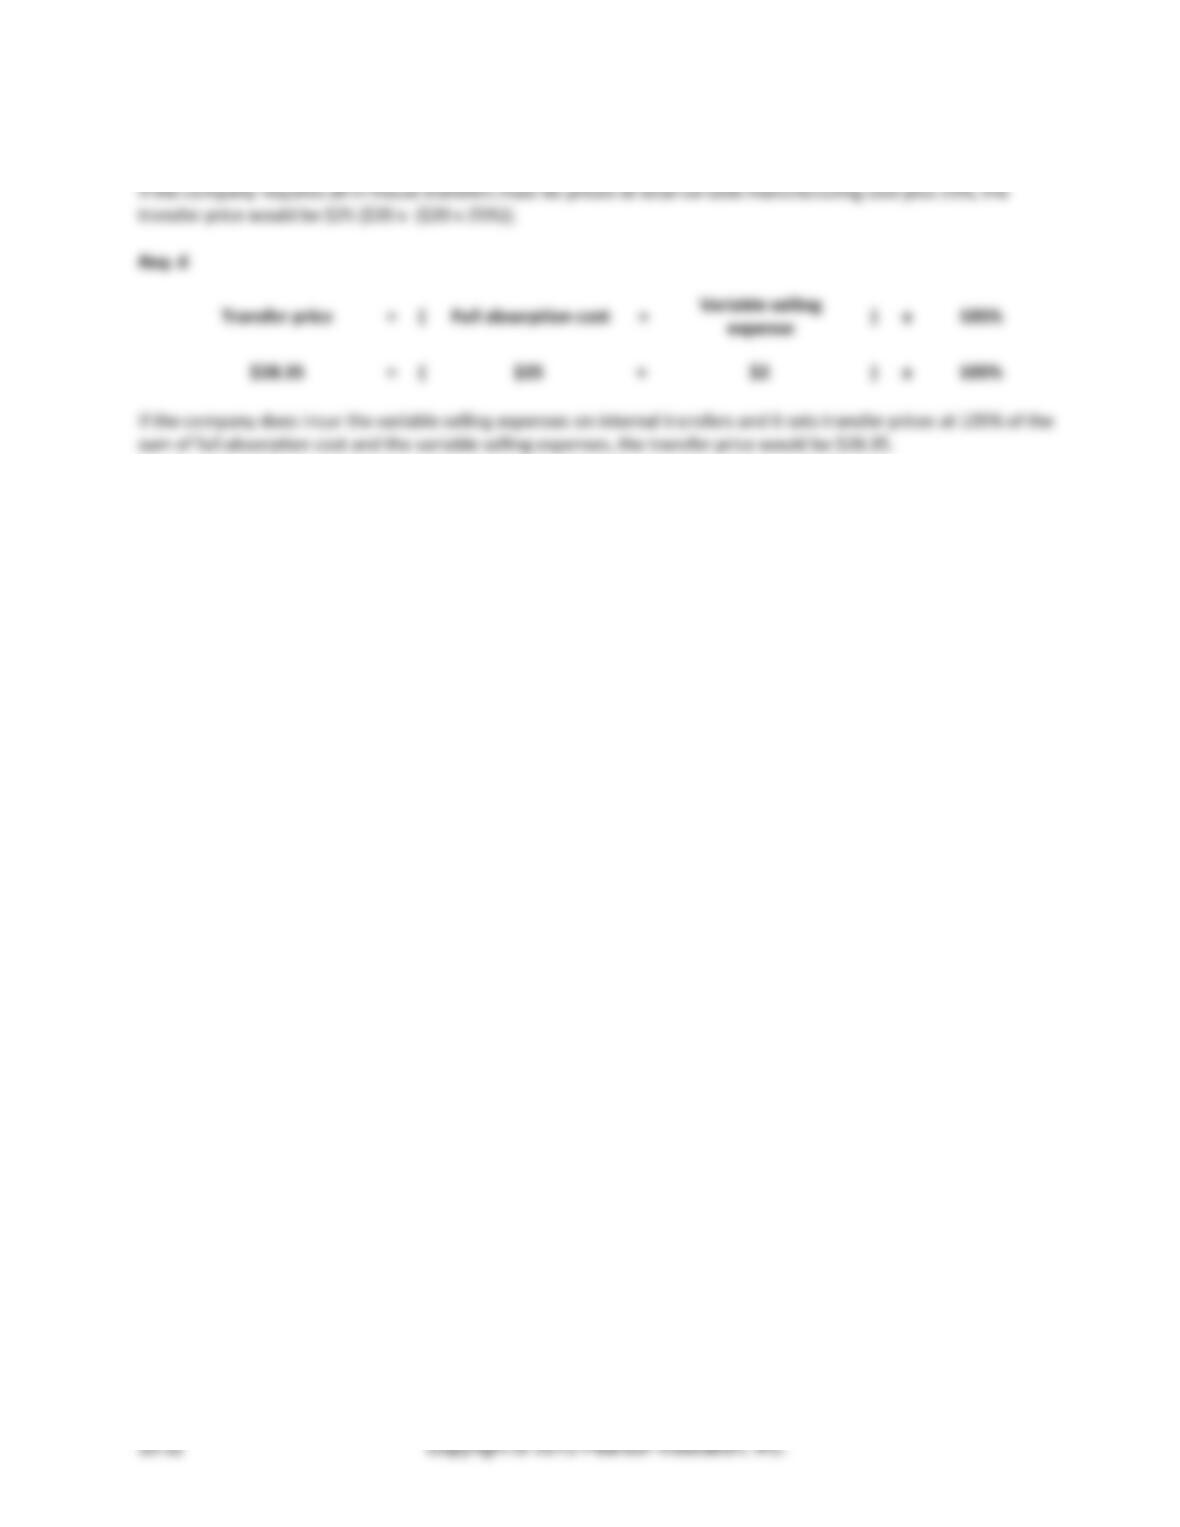
If the company’s policy requires that all in-house transfers must be priced at total manufacturing cost plus 25%, the
transfer price would be $27.50 [$25 x ($25 x 10%)].
Managerial Accounting 4e Solutions Manual
(continued) P10-46A
Req. 5
Chapter 10 Performance Evaluation
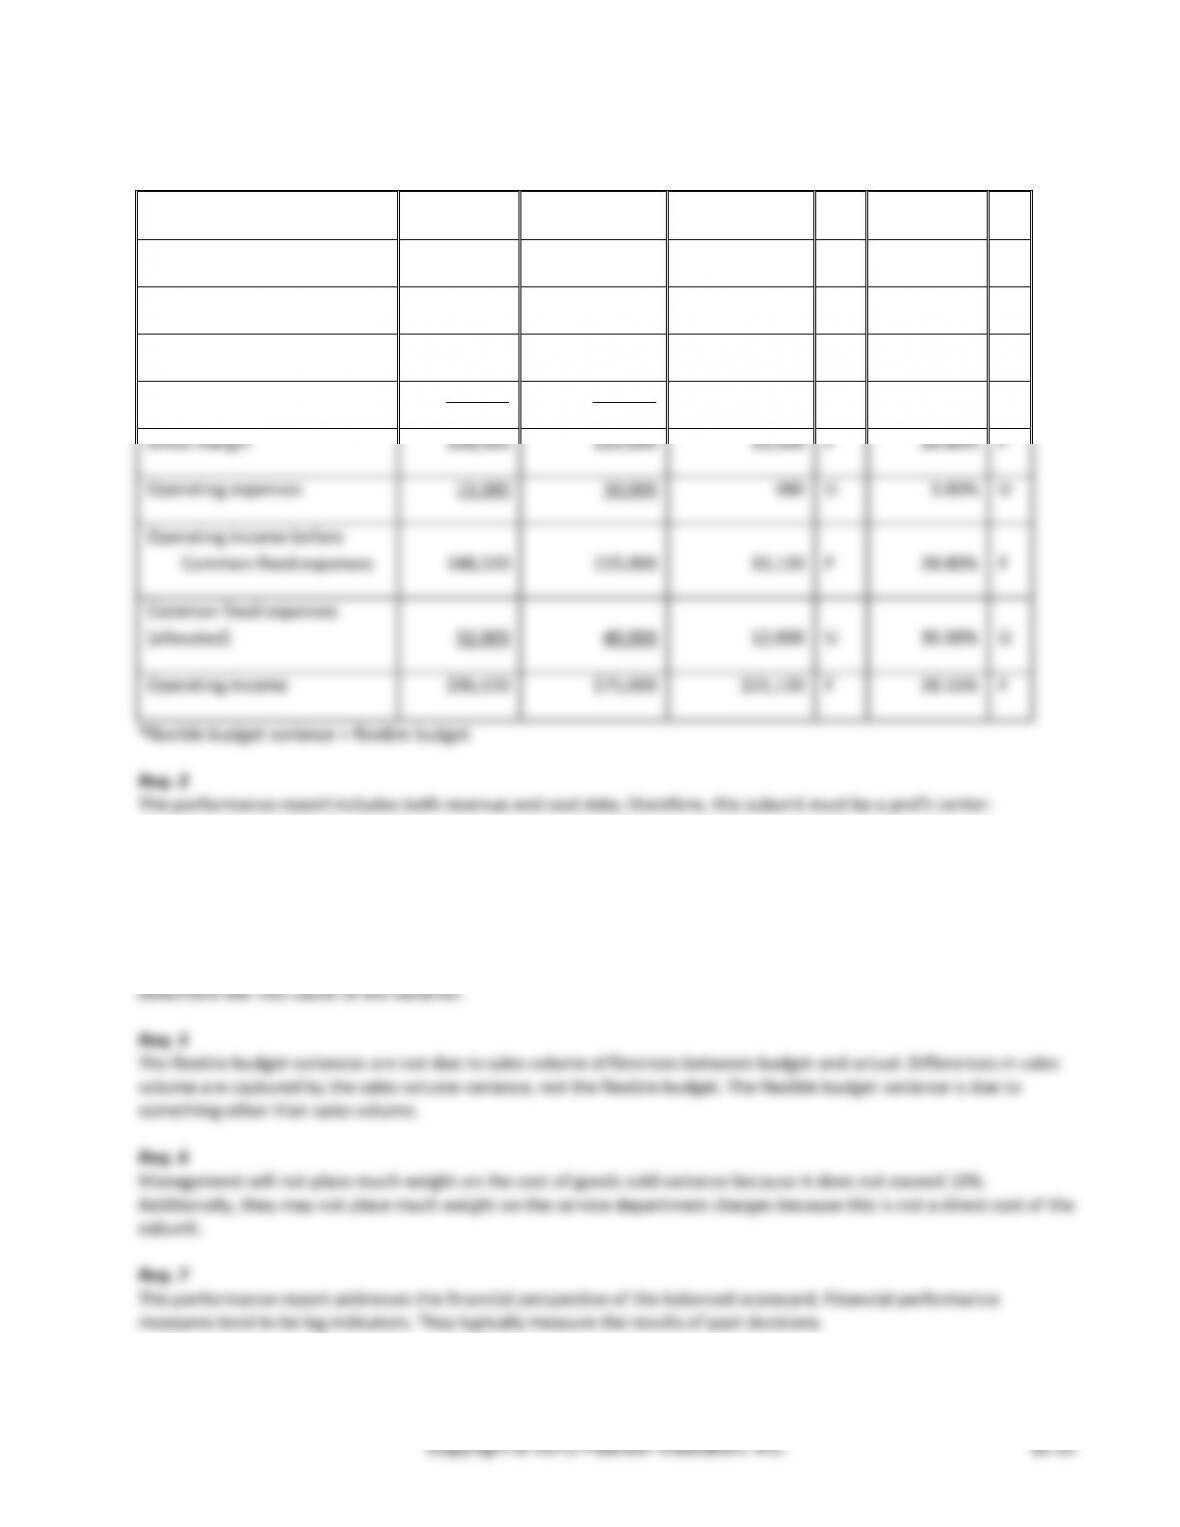
(15-20 min.) P10-47A
Req. 1
Sports–Subunit X
Actual
Flexible Budget
Flexible Budget
Percent
Variance
Variance*
(U or F)
Sales
$545,500
$500,000
$45,500
F
9.10%
F
Cost of goods sold
387,000
375,000
12,000
U
3.20%
U
Gross margin
158,500
125,000
33,500
F
26.80%
F
Operating expenses
10,380
10,000
380
U
3.80%
U
Operating income before
Common fixed expenses
148,120
115,000
33,120
F
28.80%
F
Common fixed expenses
(allocated)
52,000
40,000
12,000
U
30.00%
U
Operating income
$96,120
$75,000
$21,120
F
28.16%
F
Req. 3
Service department charges
Req. 4
Managers should investigate favorable as well as unfavorable variances. Favorable variances may be due to
bookkeeping or budgeting errors. Management needs to evaluate large favorable as well as unfavorable variances to
Managerial Accounting 4e Solutions Manual
(continued) P10-47A
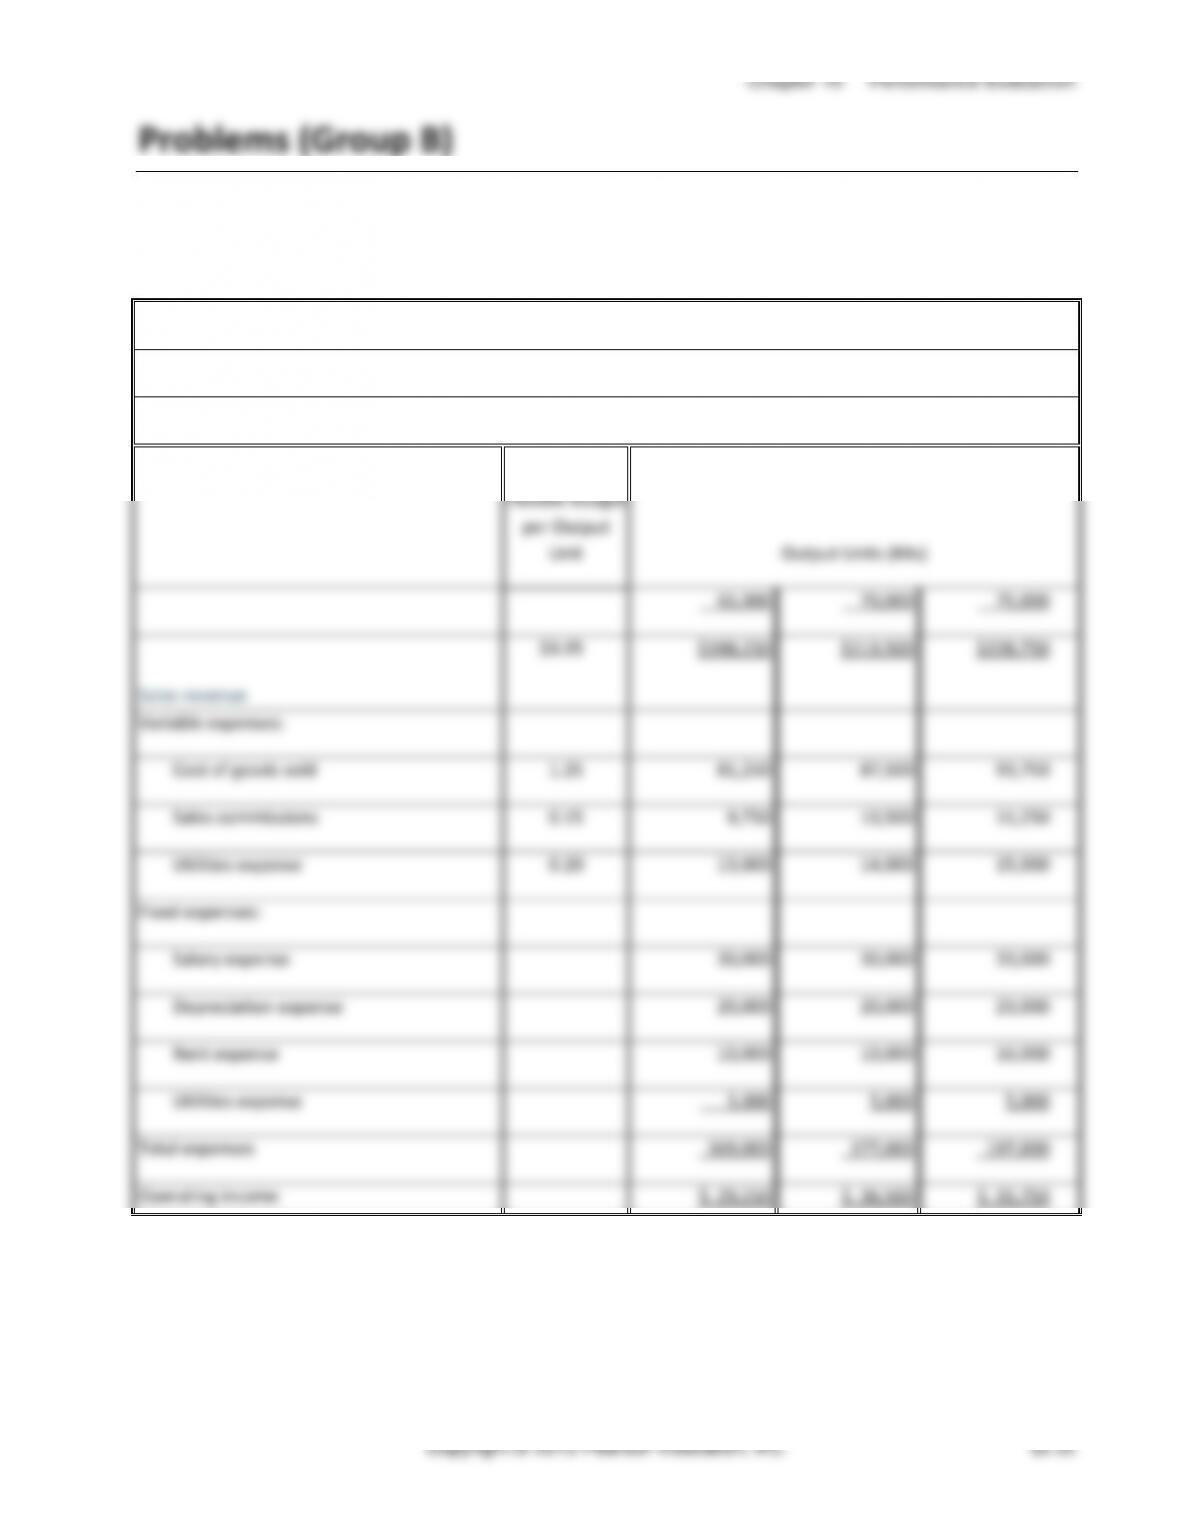
(20-25 min.) P10-48B
Req. 1
Precious Bubbles, Inc.
Flexible Budget Income Statement
Month Ended March 31
Flexible Budget
per Output
Unit
Output Units (Kits)
65,000
70,000
75,000
Sales revenue
$3.05
$198,250
$213,500
$228,750
Variable expenses:
Cost of goods sold
1.25
81,250
87,500
93,750
Sales commissions
0.15
9,750
10,500
11,250
Utilities expense
0.20
13,000
14,000
15,000
Fixed expenses:
Salary expense
30,000
30,000
33,000
Depreciation expense
20,000
20,000
23,000
Rent expense
10,000
10,000
16,000
Utilities expense
5,000
5,000
5,000
Total expenses
169,000
177,000
197,000
Operating income
$ 29,250
$ 36,500
$ 31,750
Managerial Accounting 4e Solutions Manual
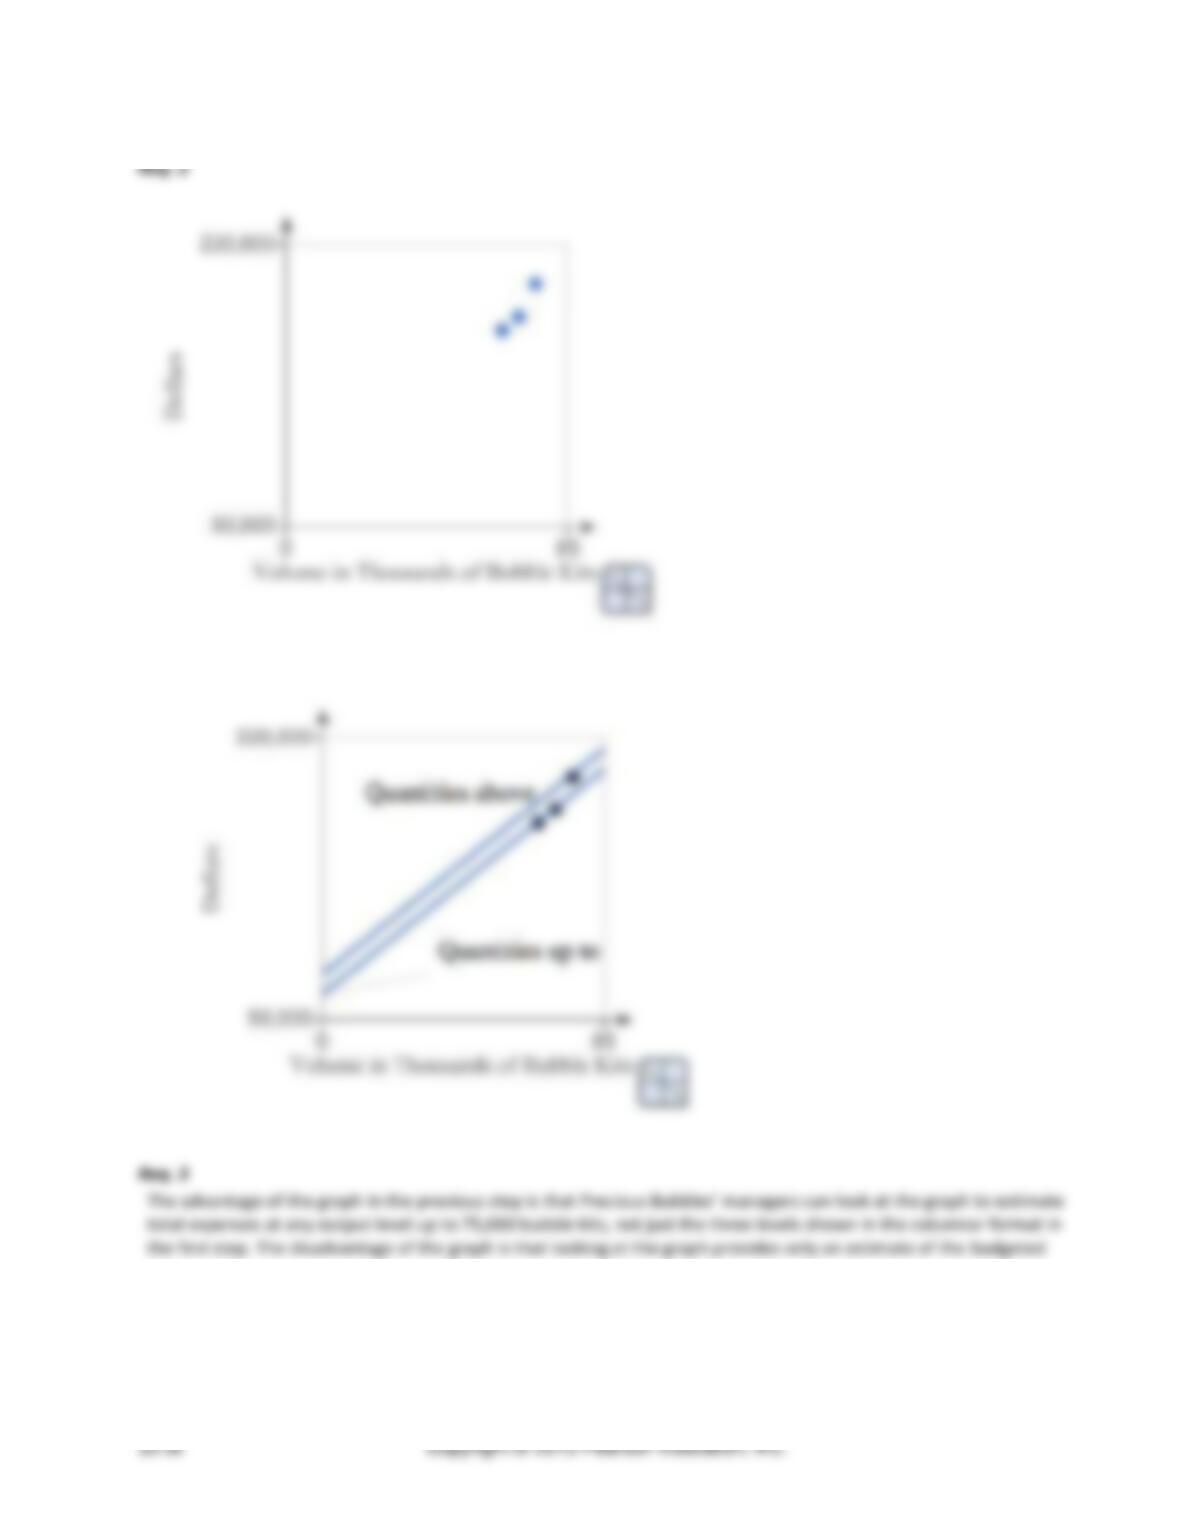
(continued) P10-48B
cost.