Chapter 10 Performance Evaluation
Copyright © 2015 Pearson Education, Inc.
10-1
Chapter 10
Performance Evaluation
Quick Check
Answers:
QC-1. d
QC-3. c
QC-5. b
QC-7. a
QC-9. c
QC-2. b
QC-4. c
QC-6. d
QC-8. b
QC-10. d
Short Exercises
(5 min.) S10-1
a. An investment center
b. A cost center
Managerial Accounting 4e Solutions Manual
(5 – 10 min.) S10-4
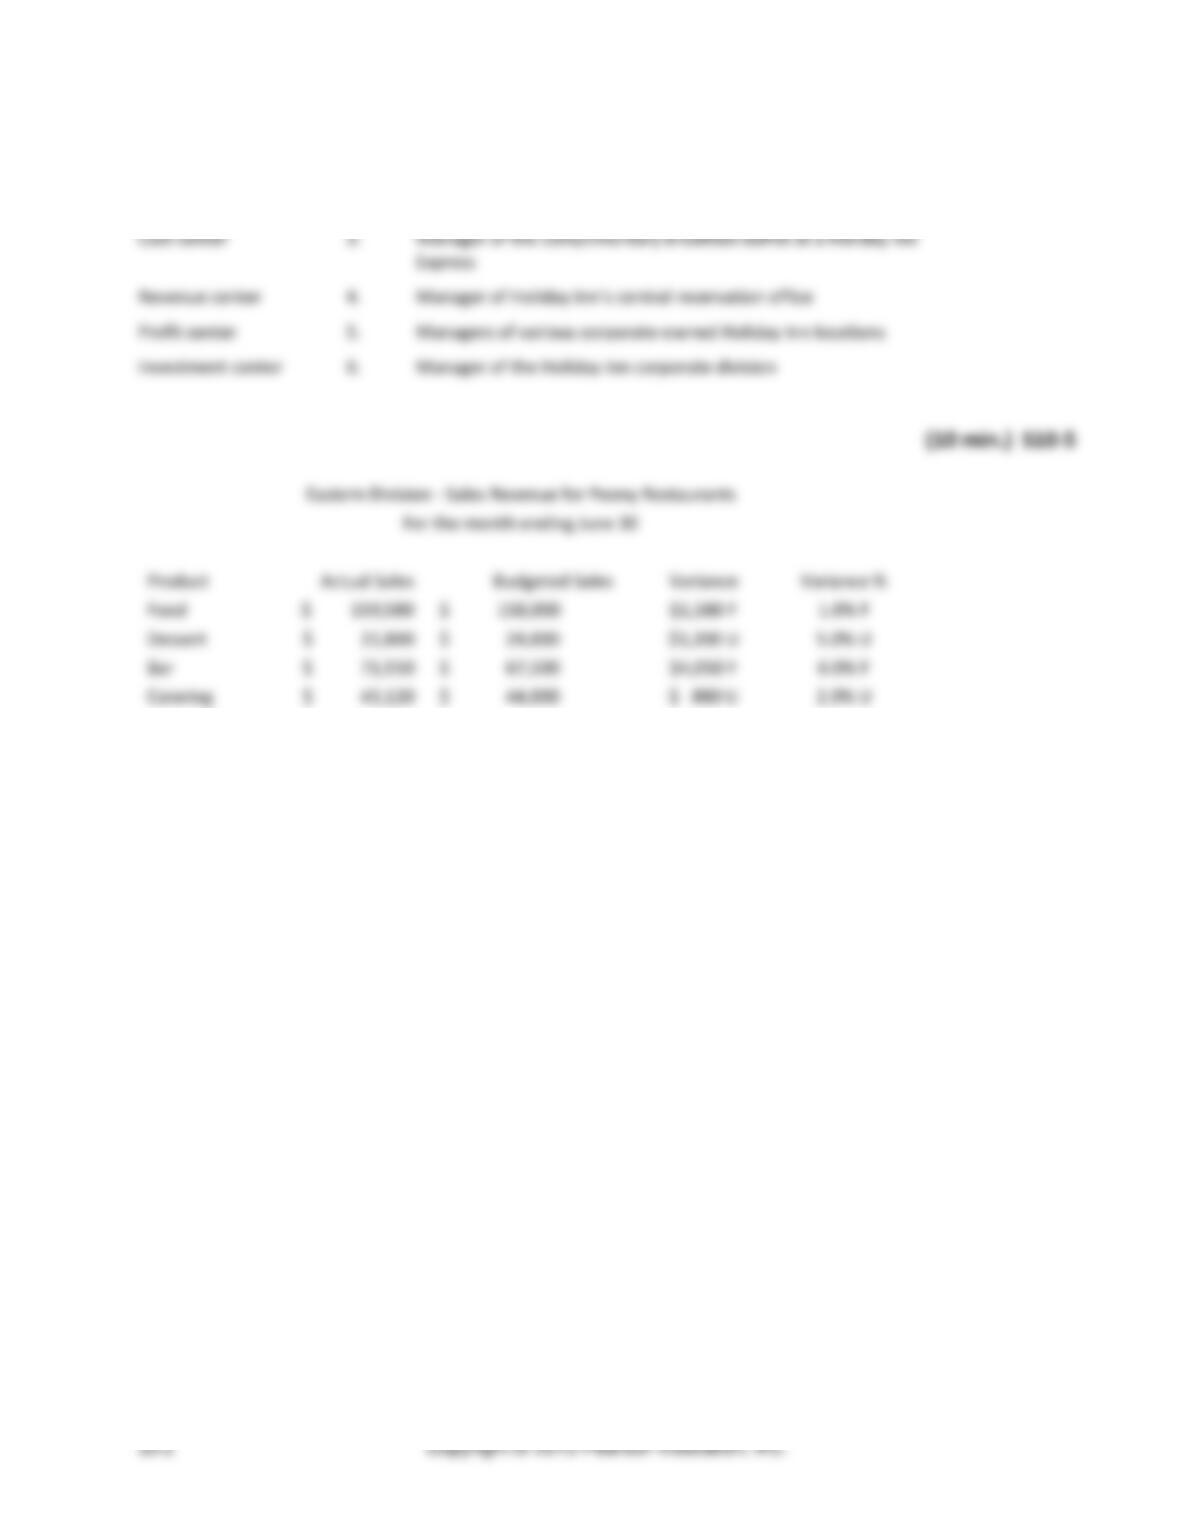
Cost center 1. Manager of the Housekeeping Department at the Holiday Inn
Investment center 2. Manager of the Holiday Inn Express corporate division
(10 min.) S10-6
Sales
margin
Capital
turnover
ROI
Functional Ingredients
26.0%
2.20
57.20%
Consumer Markets
12.5%
2.00
25.00%
Performance Materials
26.0%
1.00
26.00%
ROI 26.0% x 2.2 = 57.20%
ROI 12.5% x 2.0 = 25.0%
ROI 26.0% x 1.0 = 26.0%
(10 min.) S10-7
1. Enter the formula, then calculate each division’s ROI.
Operating Income
÷
Total Assets
=
ROI
Snow Sports
$ 950,000
÷
$ 4,900,000
=
19.4 %
Non-Snow Sports
$ 1,482,000
÷
$ 7,100,000
=
20.9 %
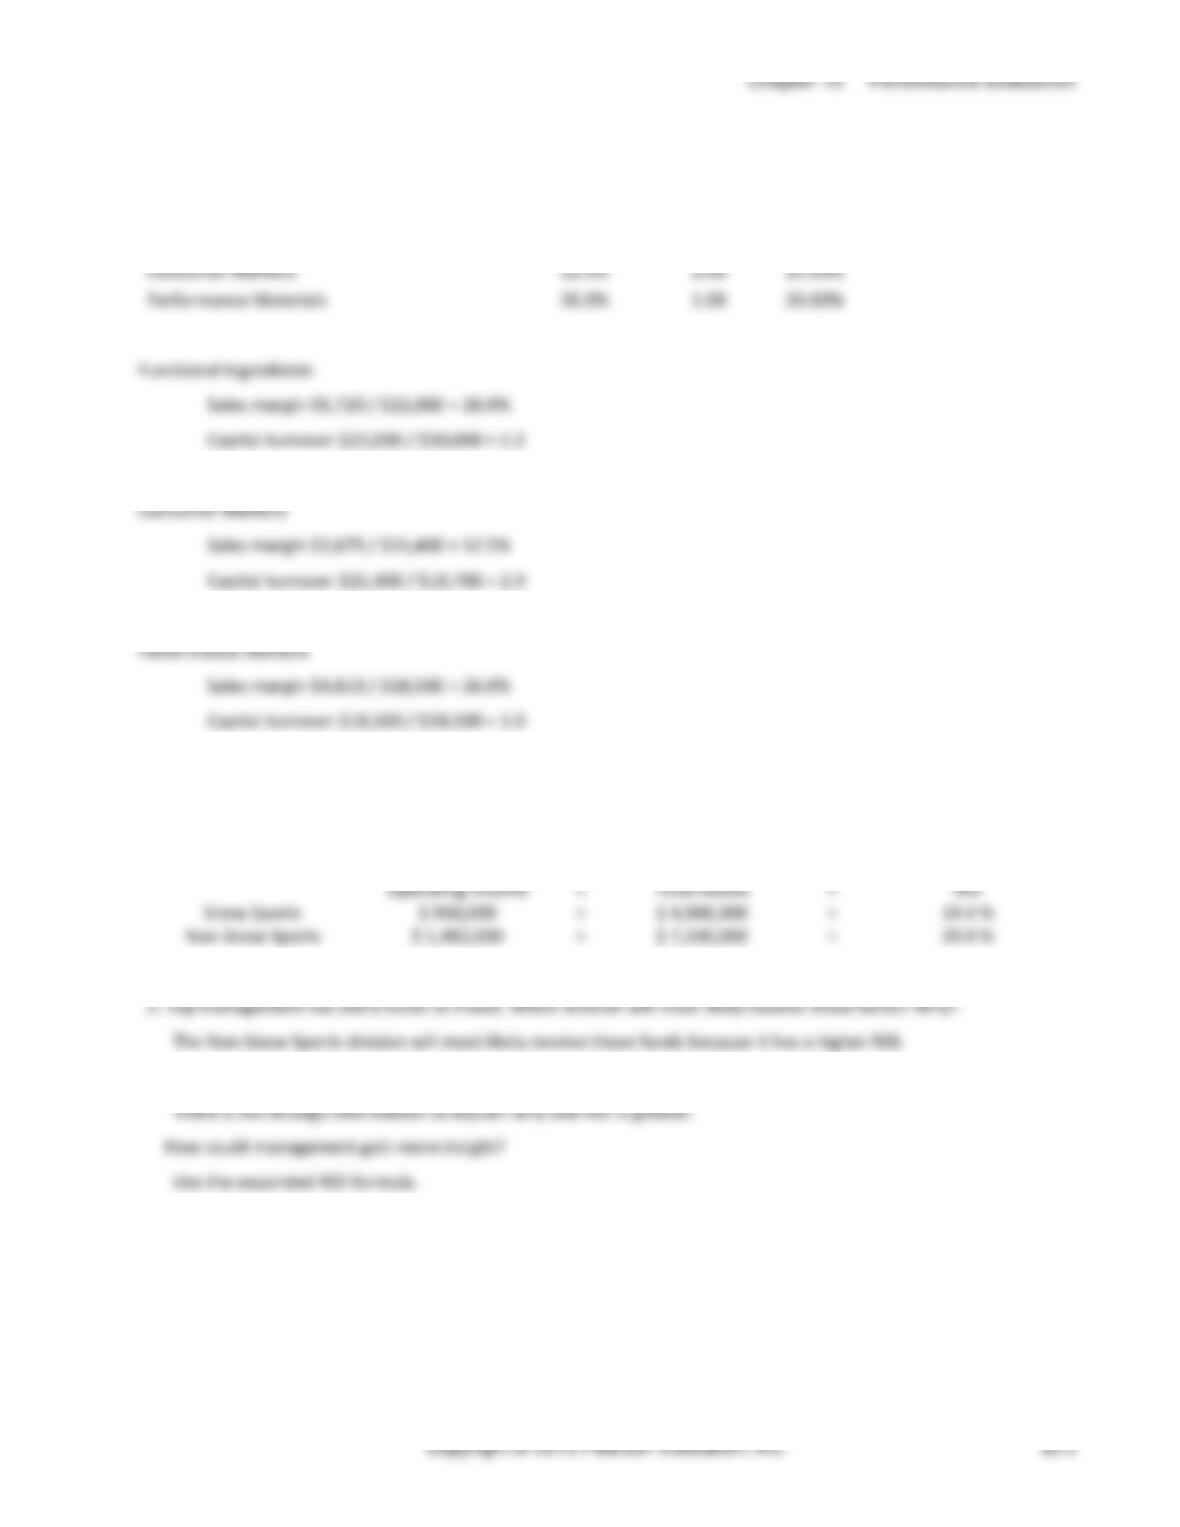
3. Can you explain why one division’s ROI is higher?
Managerial Accounting 4e Solutions Manual
(10 – 15 min.) S10-8
Req. 1
Snow Sports
Non-snow Sports
Operating income
$950,000
$1,482,000
÷ Sales
÷$5,000,000
÷$7,800,000
Sales margin
19%
19%
Based on the divisions’ sales margins, we know that the sales margin was not the reason the divisions had different
ROIs.
Req. 2
Snow Sports
Non-snow Sports
Sales
$5,000,000
$7,800,000
÷ Total assets
÷$4,900,000
÷$7,100,000
Capital turnover
1.02
1.10
Based on the divisions’ capital turnover rates, we know that the capital turnover rate was the reason that the divisions
had different ROIs.
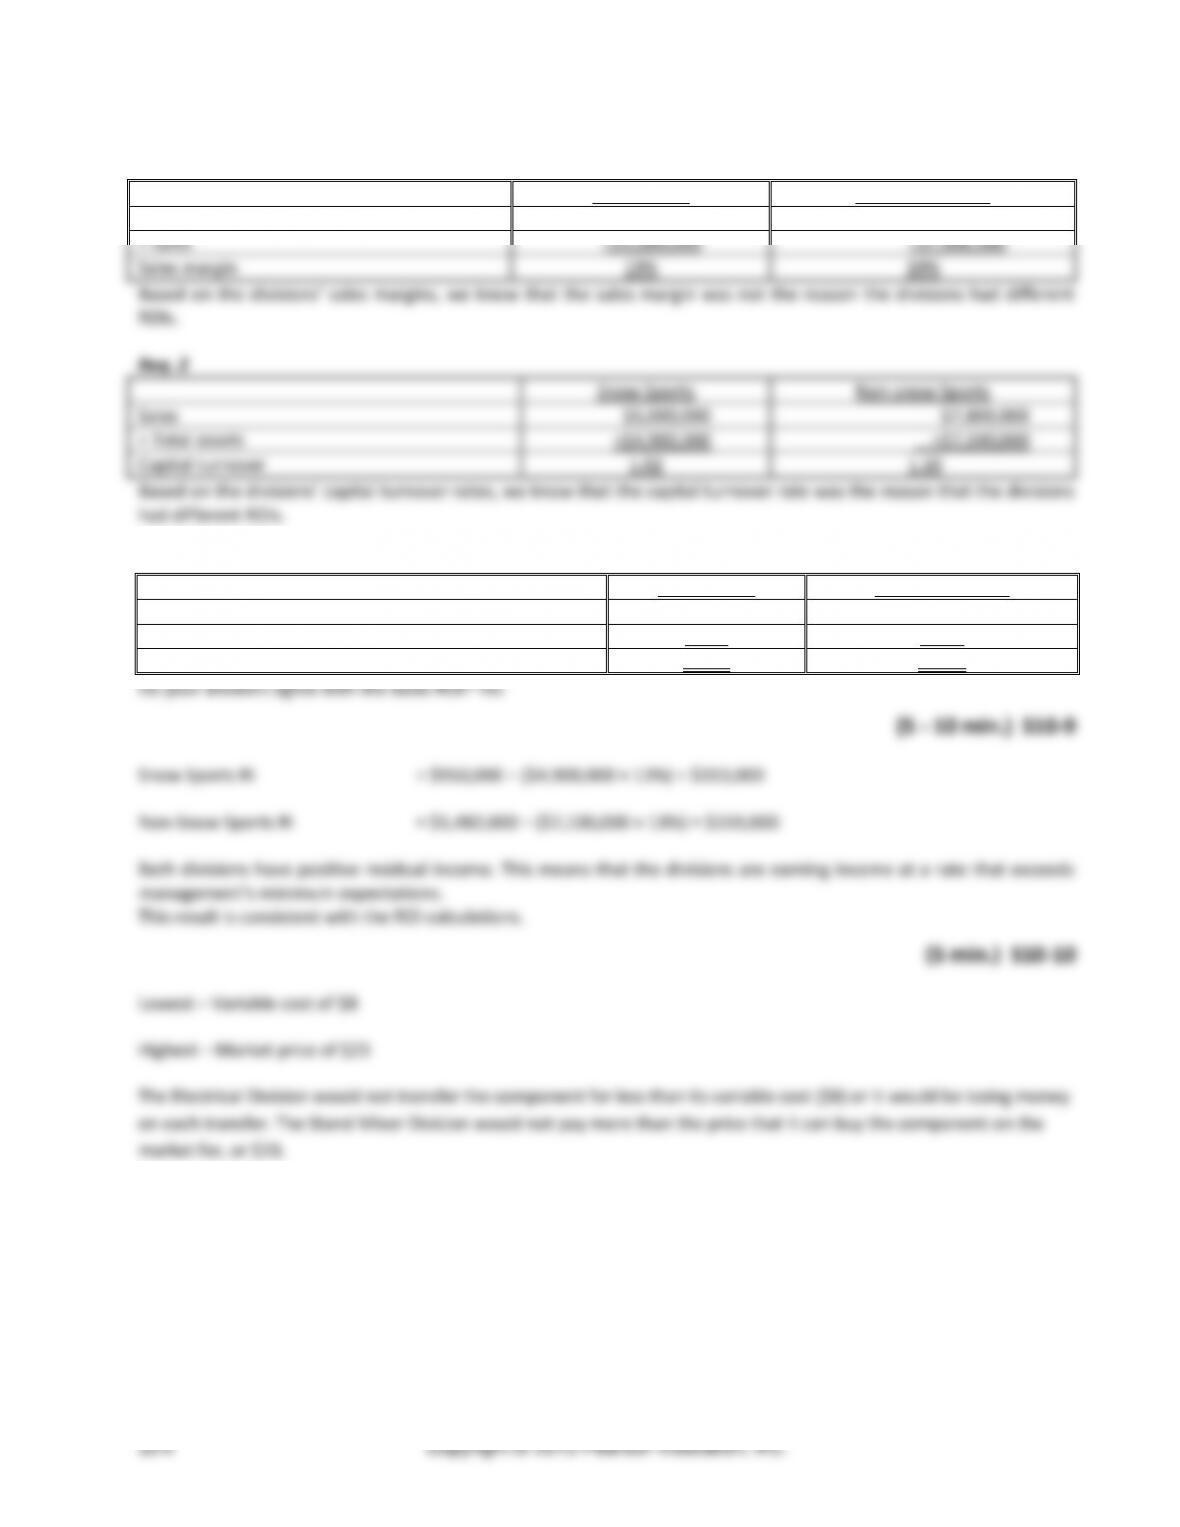
Req. 3
Snow Sports
Non-snow Sports
Sales margin (from S10-7)
19%
19%
× Capital turnover (from part 1)
×1.02
×1.10
ROI
19.4%
20.9%
Chapter 10 Performance Evaluation
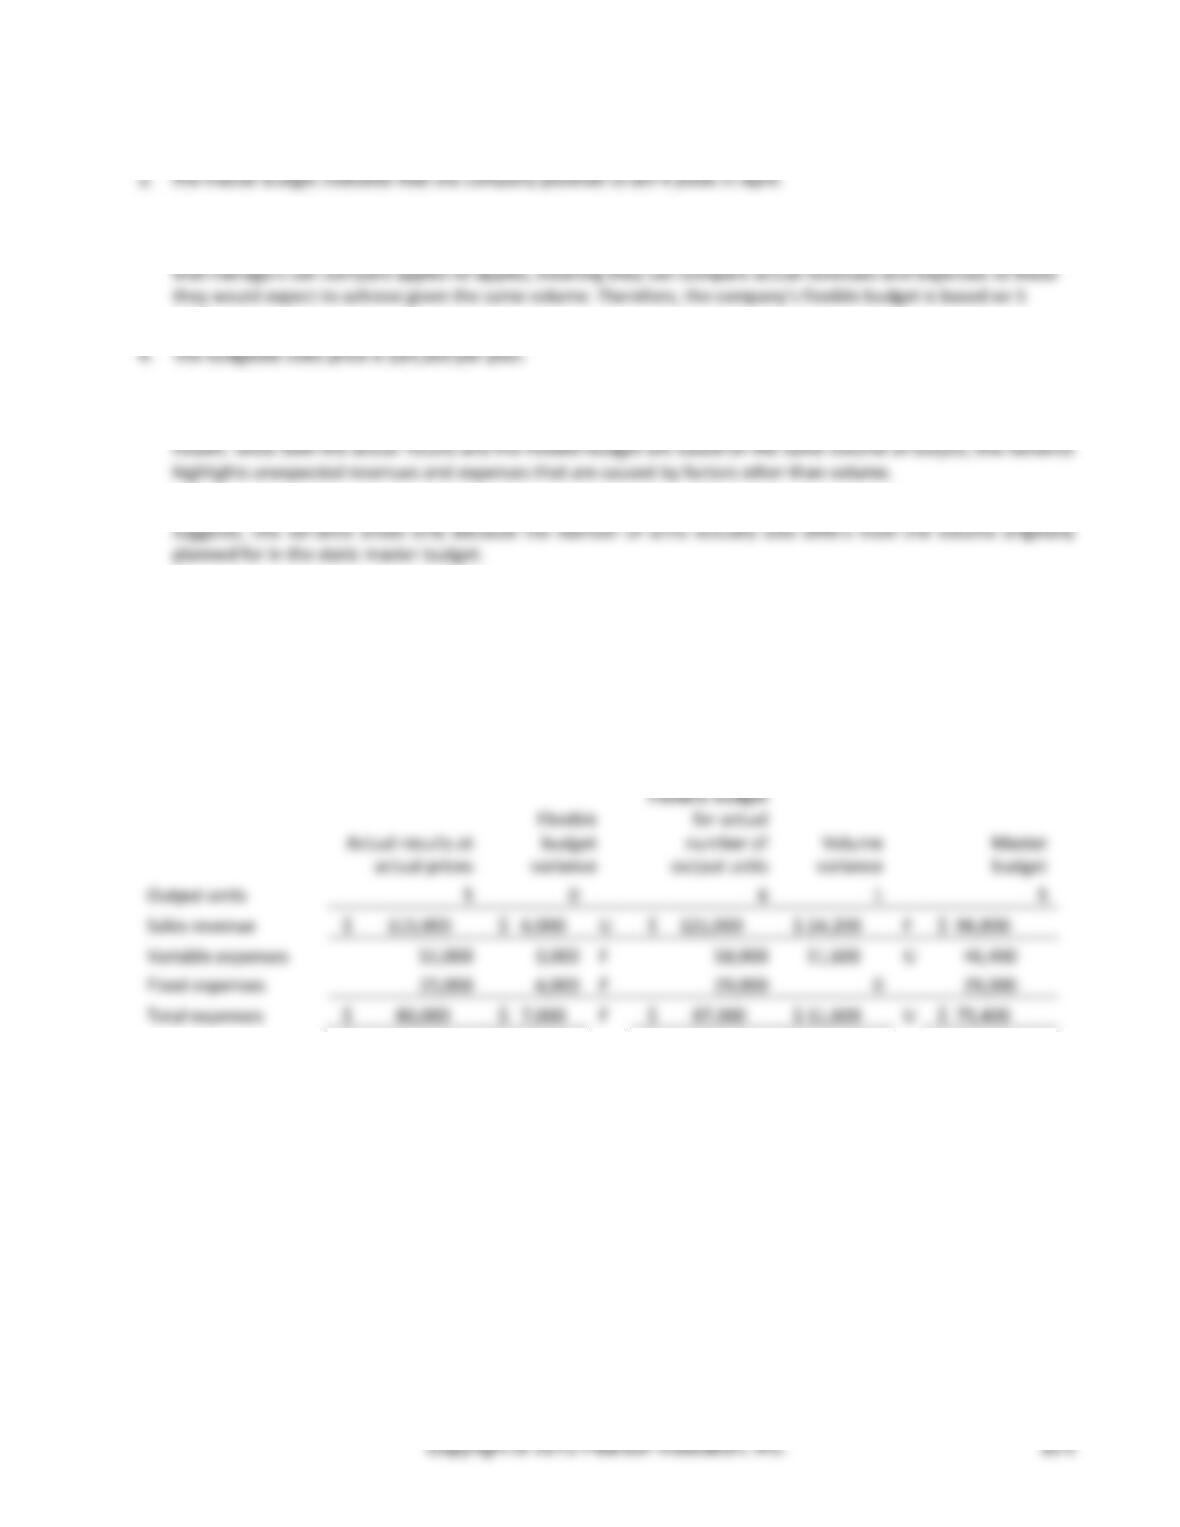
(10 – 15 min.) S10-11
2. The actual results indicate that the company sold 5 pools in April.
3. The flexible budget for performance reports is always based on the actual output for the month. This is done so
pools.
5. The budgeted variable cost is $11,600 per pool.
6. As the name suggests, the flexible budget variance is the difference between the flexible budget and the actual
7. The volume variance is the difference between the static (master) budget and the flexible budget. As the name
8. See completed Performance Report below.
Golden Pools
Income Statement Performance Report
Year Ended April 30
Actual results at
actual prices
Flexible
budget
variance
Flexible budget
for actual
number of
output units
Volume
variance
Master
budget
Output units
5
0
6
1
5
Sales revenue
$ 115,000
$ 6,000
U
$ 121,000
$ 24,200
F
$ 96,800
Variable expenses
55,000
3,000
F
58,000
11,600
U
46,400
Fixed expenses
25,000
4,000
F
29,000
0
29,000
Total expenses
$ 80,000
$ 7,000
F
$ 87,000
$ 11,600
U
$ 75,400
Managerial Accounting 4e Solutions Manual
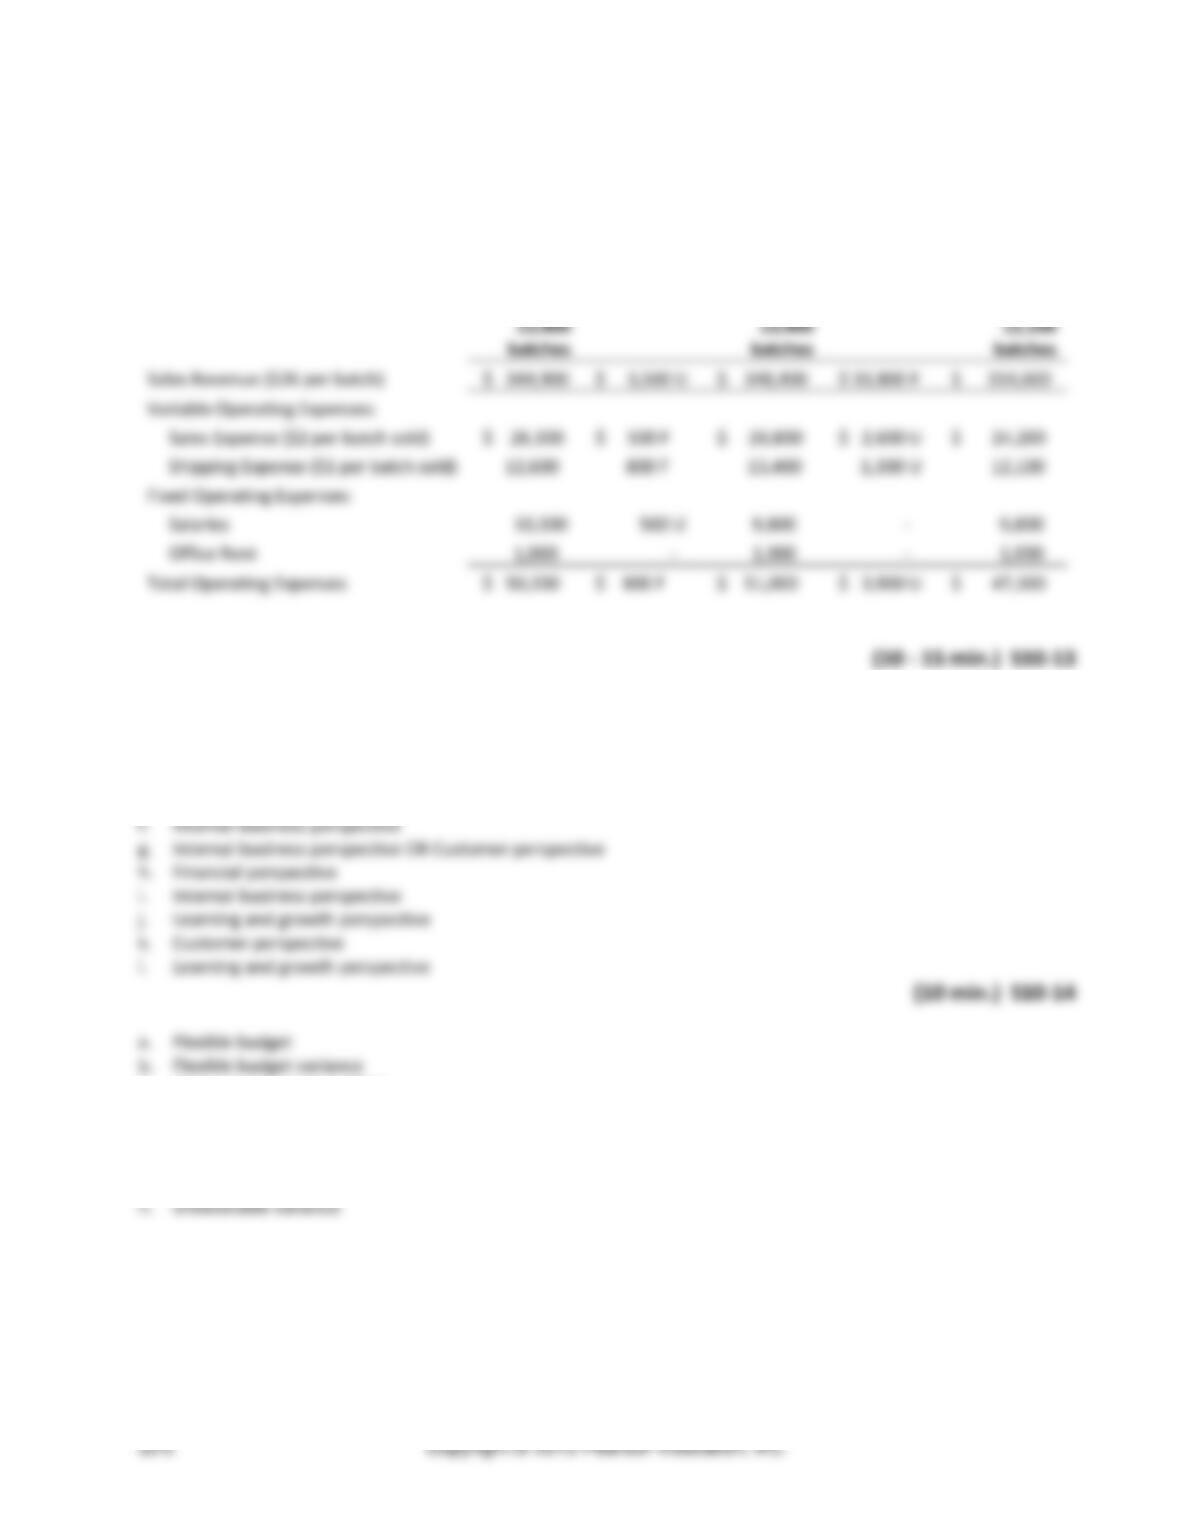
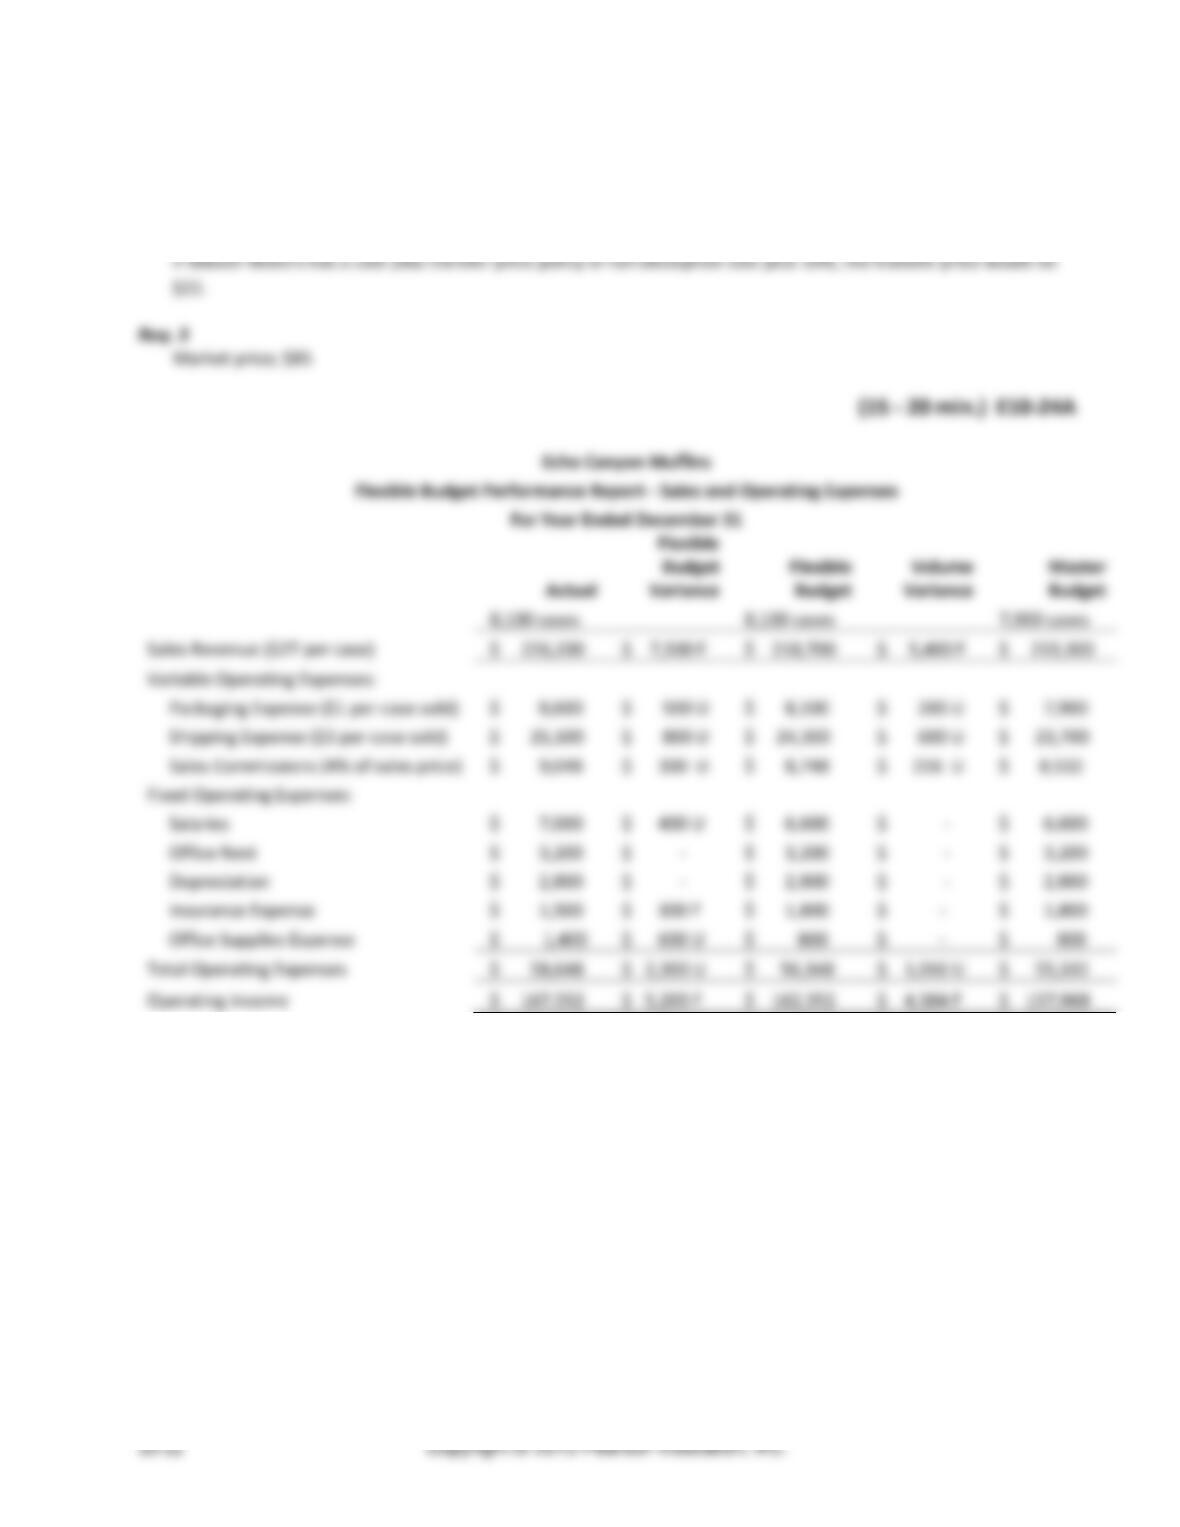
(10 -15 min.) S10-12
Sweet Earth Organic Chocolates
Master Budget Performance Report – Sales and Operating Expenses
For Year Ended December 31
Actual
Flexible
Budget
Variance
Flexible
Budget
Volume
Variance
Master
Budget
13,400
batches
13,400
batches
12,100
batches
Sales Revenue ($26 per batch)
$ 344,900
$ 3,500 U
$ 348,400
$ 33,800 F
$ 314,600
Variable Operating Expenses:
Sales Expense ($2 per batch sold)
$ 26,300
$ 500 F
$ 26,800
$ 2,600 U
$ 24,200
Shipping Expense ($1 per batch sold)
12,600
800 F
13,400
1,300 U
12,100
Fixed Operating Expenses:
Salaries
10,300
500 U
9,800
–
9,800
Office Rent
1,000
–
1,000
–
1,000
Total Operating Expenses
$ 50,200
$ 800 F
$ 51,000
$ 3,900 U
$ 47,100
(10 – 15 min.) S10-13
a. Financial perspective
b. Internal business perspective
c. Learning and growth perspective
d. Internal business perspective (post-sales service)
e. Customer perspective
c. Return on Investment (ROI)
d. Favorable variance
e. Revenue center
f. Volume variance
g. Capital turnover
Chapter 10 Performance Evaluation
(continued) S10-14
i. Management by exception
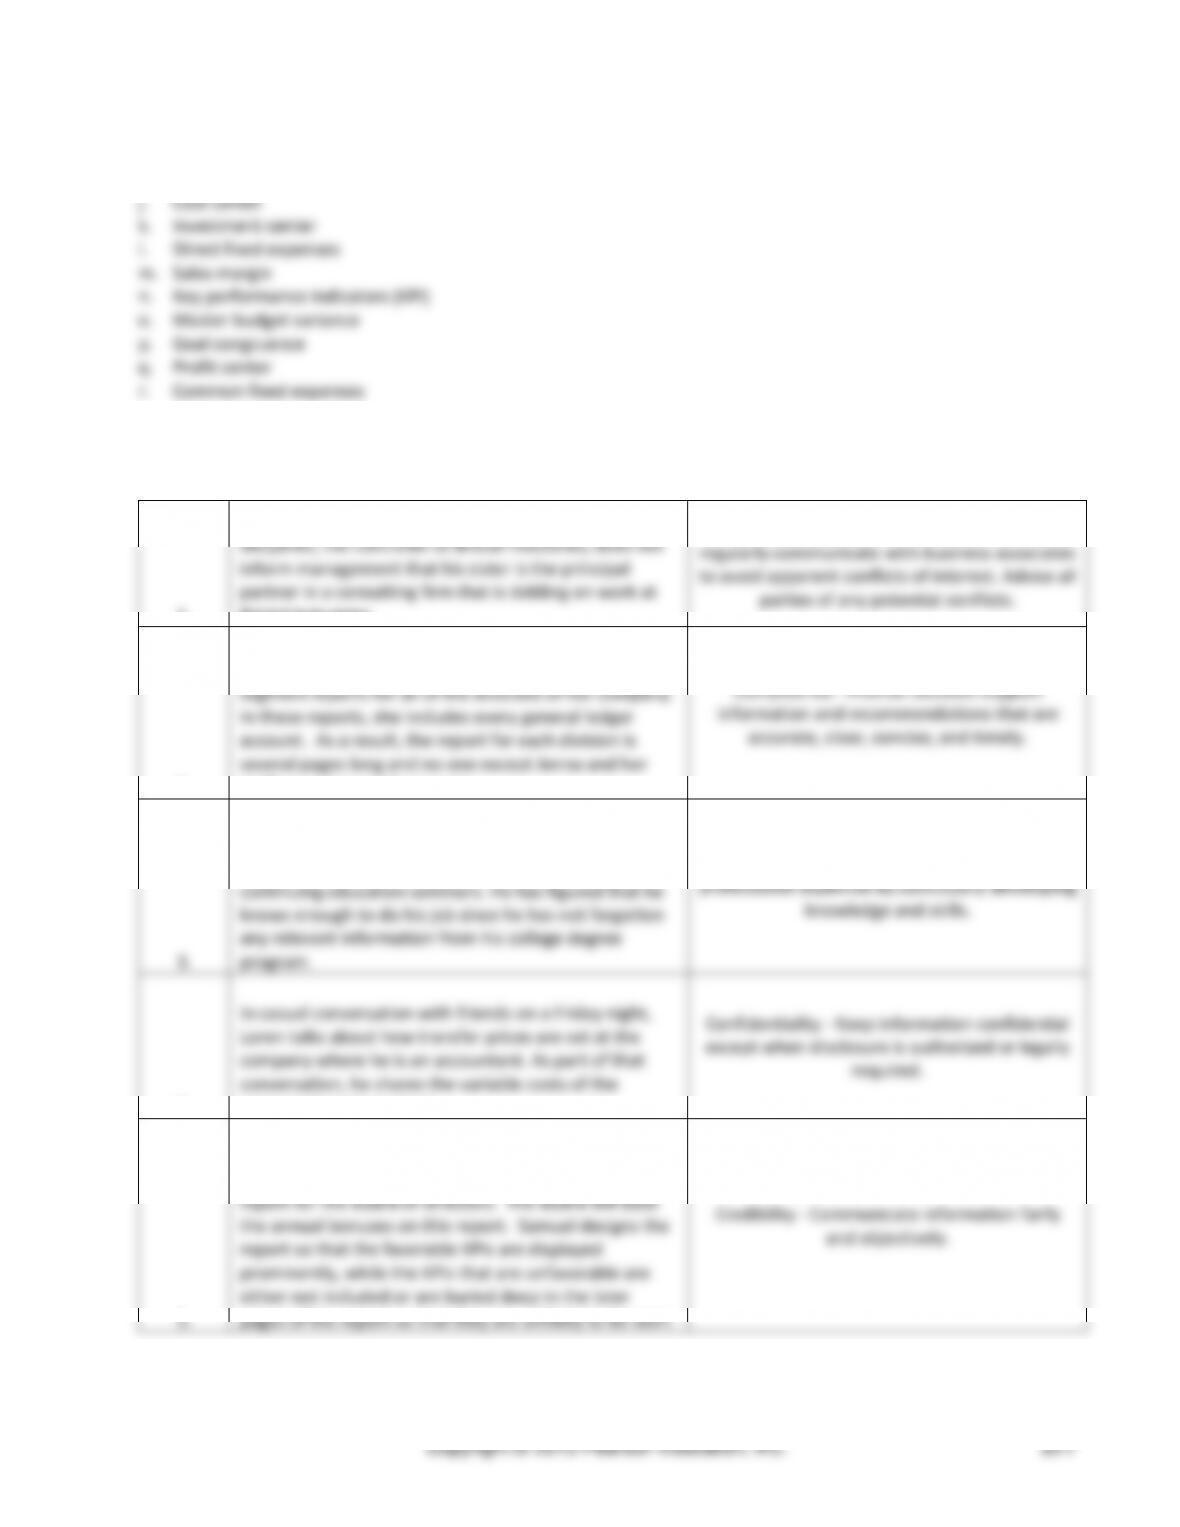
(10 min.) S10-15
1.
Benjamin, the controller at Bristal Industries, does not
inform management that his sister is the principal
partner in a consulting firm that is bidding on work at
Bristal Industries.
Integrity – Mitigate actual conflicts of interest,
regularly communicate with business associates
to avoid apparent conflicts of interest. Advise all
parties of any potential conflicts.
2.
Each month Jenna, a corporate controller, prepares
segment reports for all of the divisions of her company.
In these reports, she includes every general ledger
account. As a result, the report for each division is
several pages long and no one except Jenna and her
staff can interpret the reports.
Competence – Provide decision support
information and recommendations that are
accurate, clear, concise, and timely.
3.
In the past six years since he graduated with an
accounting degree, Joe has not attended any
continuing education seminars. He has figured that he
knows enough to do his job since he has not forgotten
any relevant information from his college degree
program.
Competence – Maintain an appropriate level of
professional expertise by continually developing
knowledge and skills.
4.
In casual conversation with friends on a Friday night,
Loren talks about how transfer prices are set at the
company where he is an accountant. As part of that
conversation, he shares the variable costs of the
company’s main product.
Confidentiality – Keep information confidential
except when disclosure is authorized or legally
required.
5.
In the year end report to the Board of Directors,
Samuel, the controller, prepares the performance
report for the board of directors. The board will base
the annual bonuses on this report. Samuel designs the
report so that the favorable KPIs are displayed
prominently, while the KPIs that are unfavorable are
either not included or are buried deep in the later
pages of the report so that they are unlikely to be seen.
Credibility – Communicate information fairly
and objectively.
Managerial Accounting 4e Solutions Manual
Exercises (Group A)
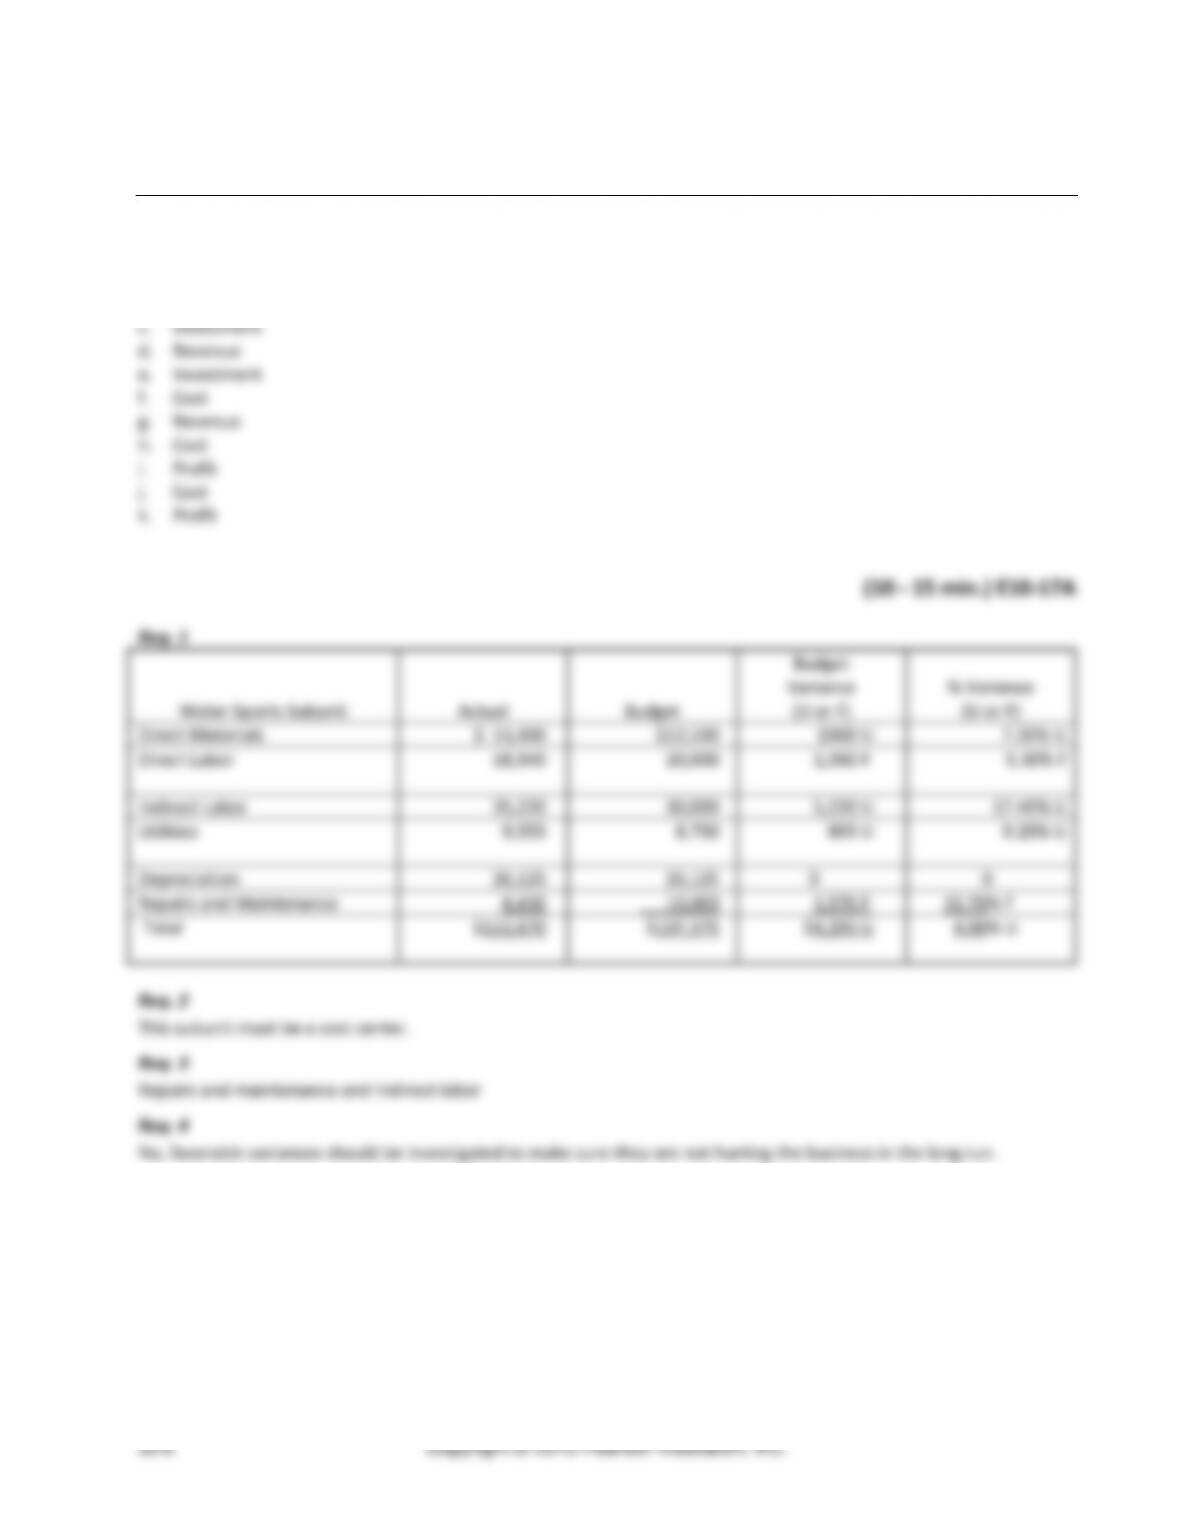
(5 – 10 min.) E10-16A
a. Investment
b. Profit
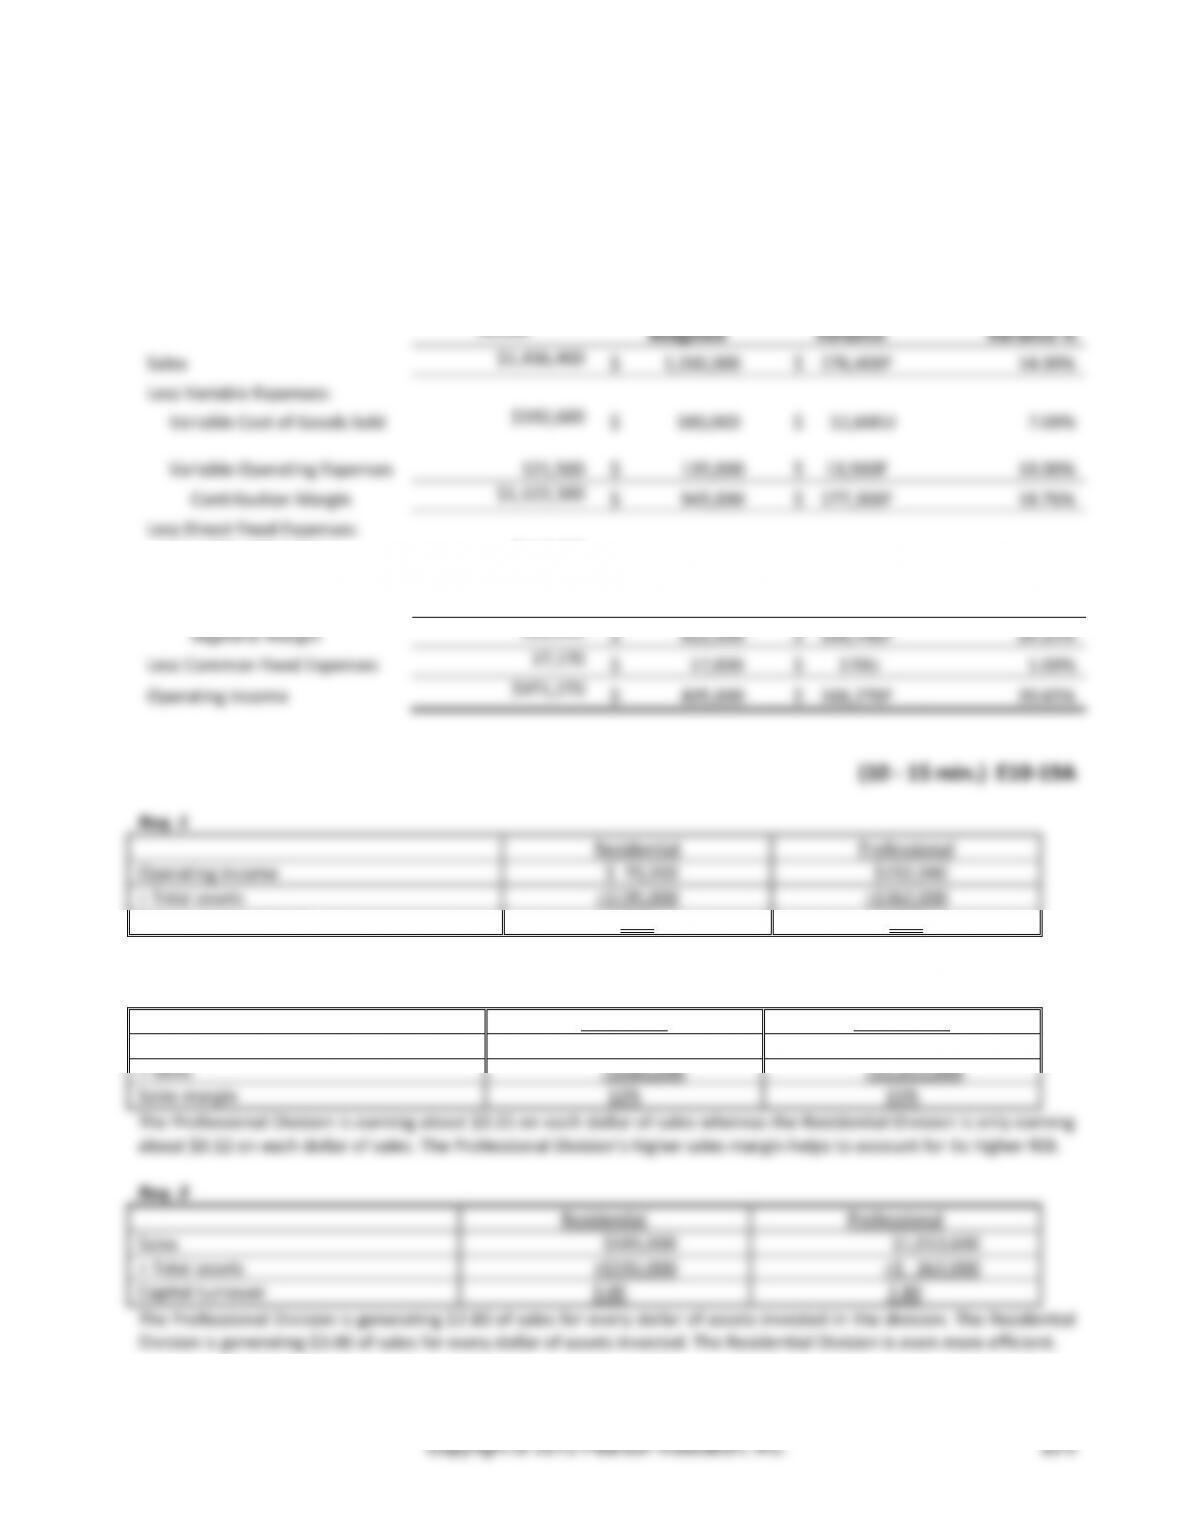
Chapter 10 Performance Evaluation
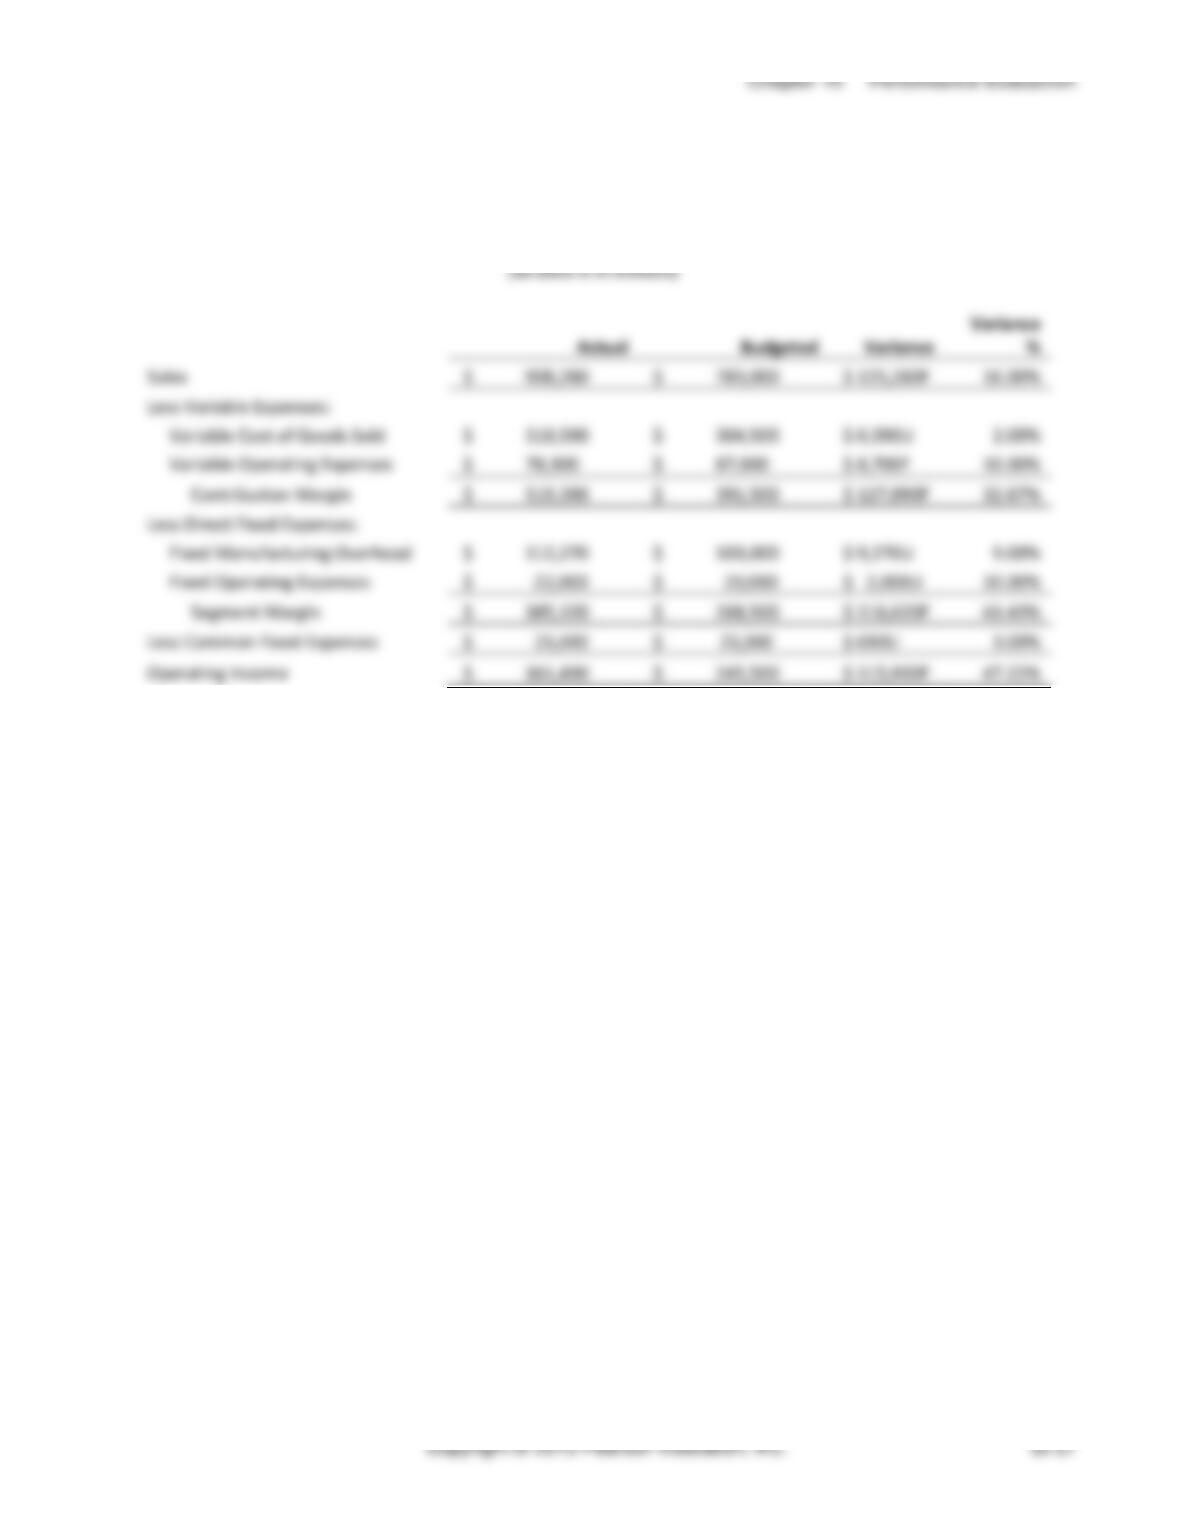
(15 min.) E10-18A
Performance Report
Crandell Industries – Pharmaceutical Segment
For Fiscal Year Ending December 31
(all data is in millions)
Actual
Budgeted
Variance
Variance %
Sales
$1,436,400
$ 1,260,000
$ 176,400F
14.00%
Less Variable Expenses:
Variable Cost of Goods Sold
$192,600
$ 180,000
$ 12,600U
7.00%
Variable Operating Expenses
121,500
$ 135,000
$ 13,500F
10.00%
Contribution Margin
$1,122,300
$ 945,000
$ 177,300F
18.76%
Less Direct Fixed Expenses:
Fixed Manufacturing
Overhead
$117,700
$ 107,000
$ 10,700U
10.00%
Fixed Operating Expenses
16,160
$ 16,000
$ 160U
1.00%
Segment Margin
988,440
$ 822,000
$ 166,440F
20.25%
Less Common Fixed Expenses
17,170
$ 17,000
$ 170U
1.00%
Operating Income
$971,270
$ 805,000
$ 166,270F
20.65%
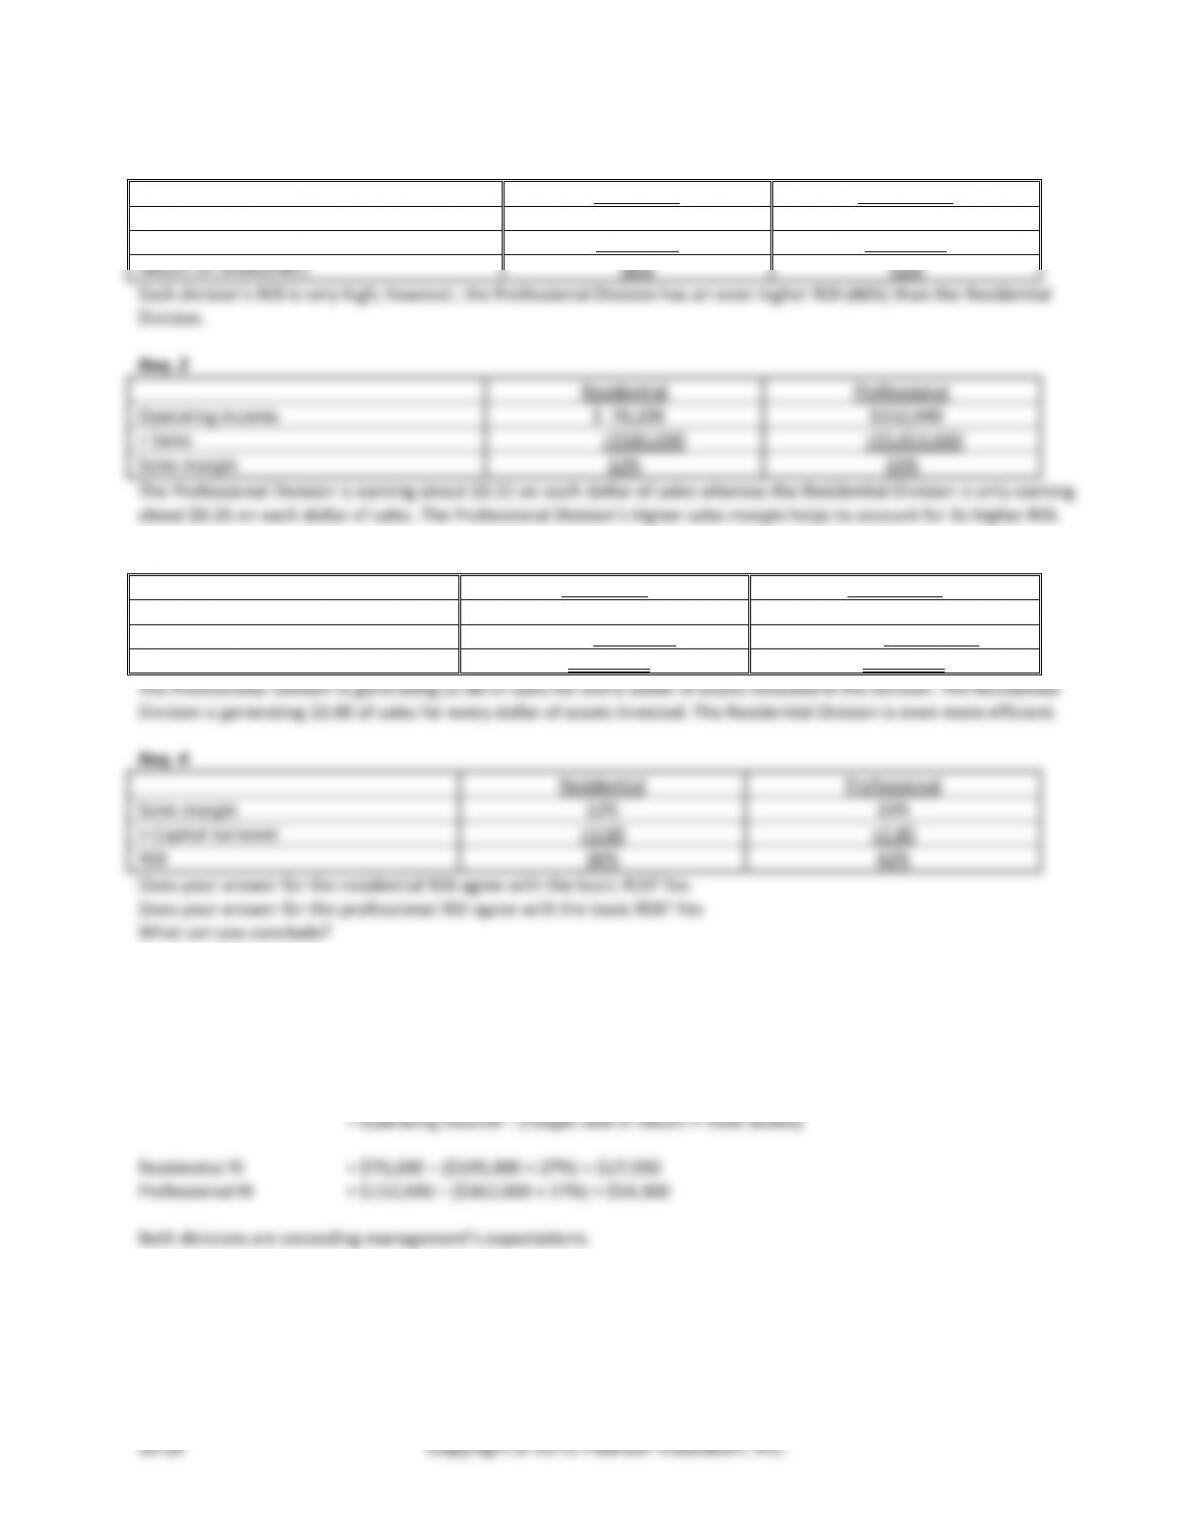
Residential
Professional
Operating income
$ 70,200
$152,040
÷ Total assets
÷$195,000
÷$362,000
Return on investment
36%
42%
Each division’s ROI is very high; however, the Professional Division has an even higher ROI than the Residential Division.
Req. 2
Residential
Professional
Operating income
$ 70,200
$152,040
÷ Sales
÷$585,000
÷$1,013,600
Sales margin
12%
15%
The Professional Division is earning about $0.15 on each dollar of sales whereas the Residential Division is only earning
about $0.12 on each dollar of sales. The Professional Division’s higher sales margin helps to account for its higher ROI.
Req. 3
Residential
Professional
Sales
$585,000
$1,013,600
÷ Total assets
÷$195,000
÷$ 362,000
Capital turnover
3.00
2.80
The Professional Division is generating $2.80 of sales for every dollar of assets invested in the division. The Residential
Division is generating $3.00 of sales for every dollar of assets invested. The Residential Division is even more efficient.
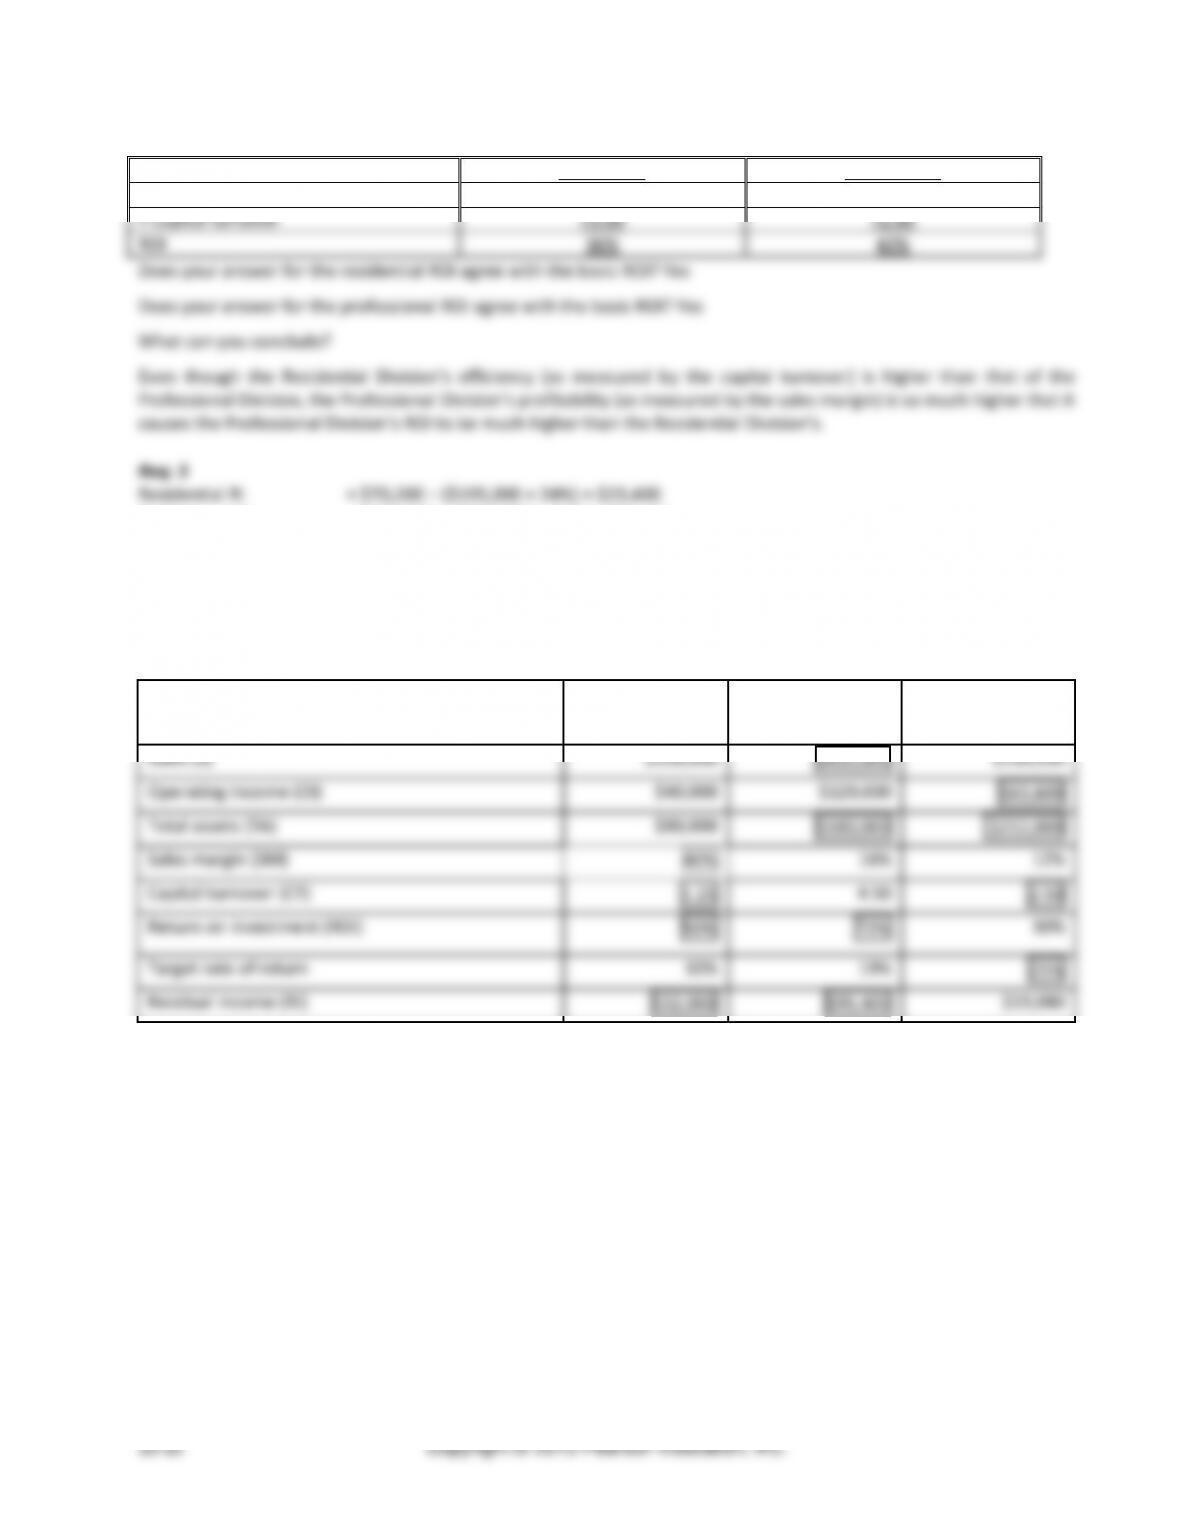
Managerial Accounting 4e Solutions Manual
(continued) E10-19A
Req. 4
Residential
Professional
Sales margin
12%
15%
× Capital turnover
×3.00
×2.80
ROI
36%
42%
Professional RI = $152,040 − ($362,000 × 24%) = $65,160
Both divisions are exceeding management’s expectations.
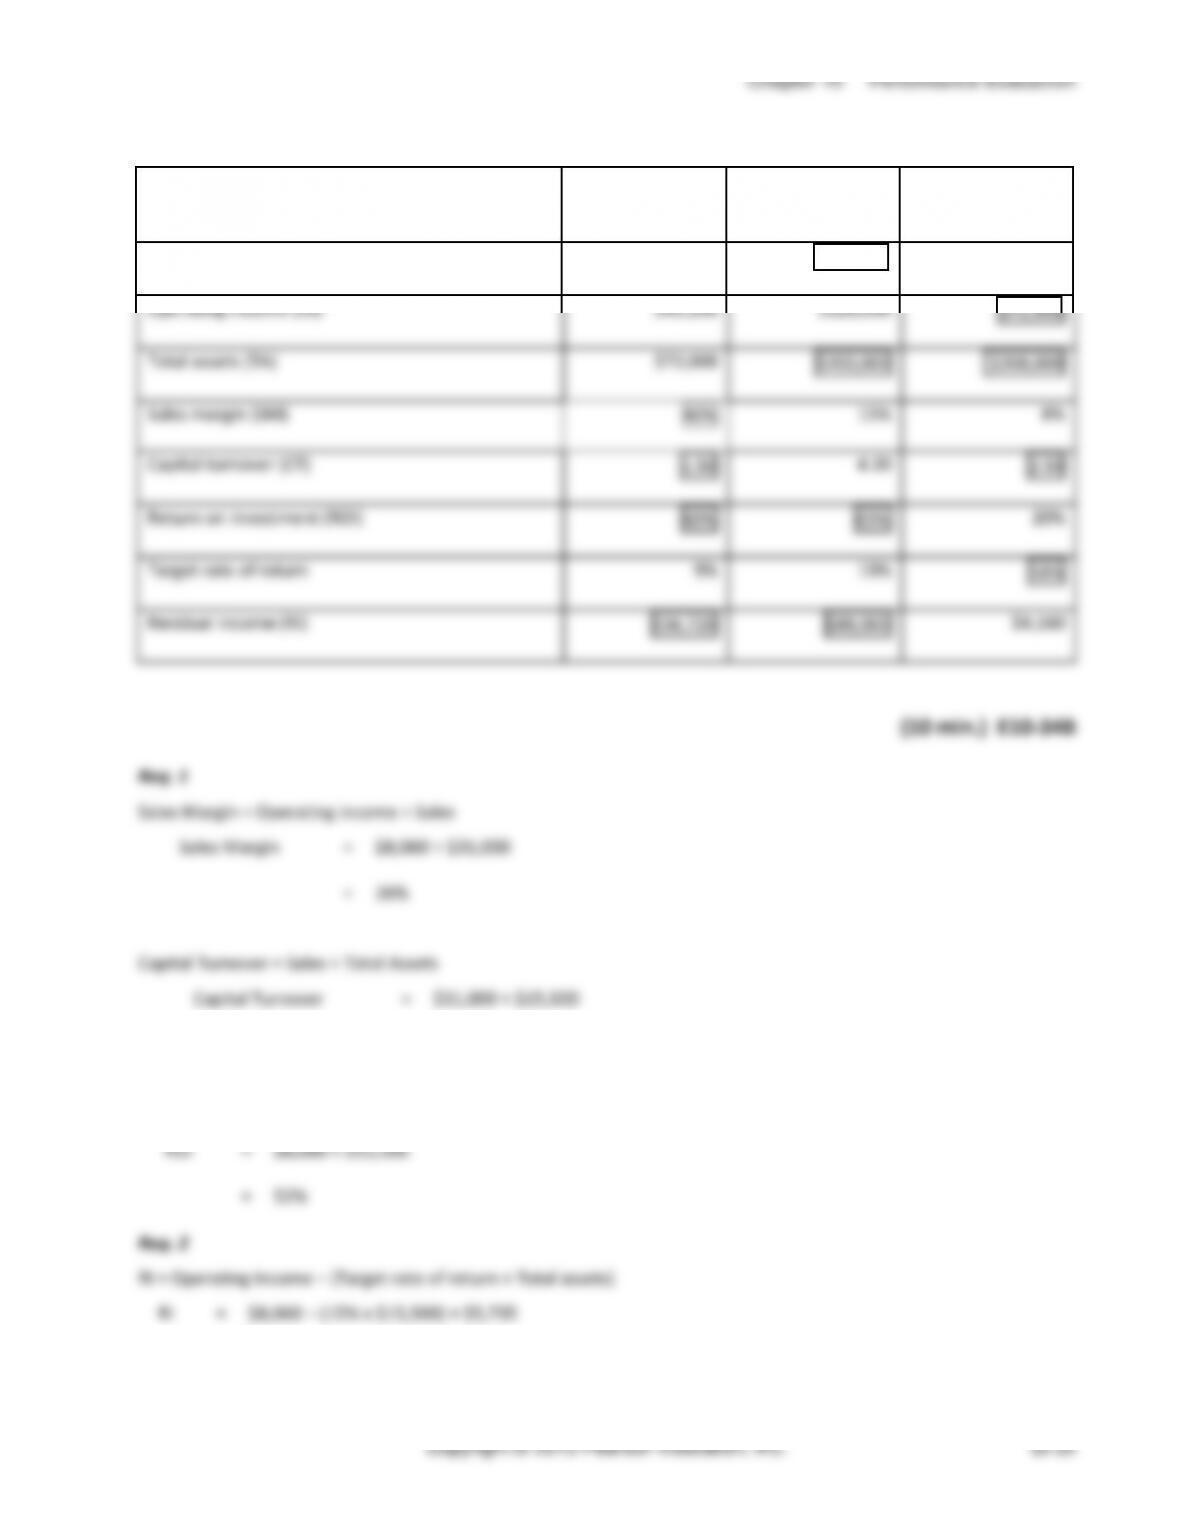
(10 – 15 min.) E10-20A
Kyler Company
Fielding Industries
Johnson, Inc.
Sales (S)
$100,000
$810,000
$530,000
Operating income (OI)
$40,000
$129,600
$63,600
Total assets (TA)
$80,000
$180,000
$212,000
Sales margin (SM)
40%
16%
12%
Capital turnover (CT)
1.25
4.50
2.50
Return on investment (ROI)
50%
72%
30%
Target rate of return
10%
19%
21%
Residual income (RI)
$32,000
$95,400
$19,080
(10 min.) E10-21A
Req. 1
Sales Margin
=
$7,560 ÷ $27,000
=
28%
=
$27,000 ÷ $12,000
=
2.25 times
=
$7,560 ÷ $12,000
=
63%
Managerial Accounting 4e Solutions Manual
(10 min.) E10-23A
Req. 1
Lowest – Variable cost of $18 ($17 + $1.) Highest – Market price of $85
Req. 2
Chapter 10 Performance Evaluation
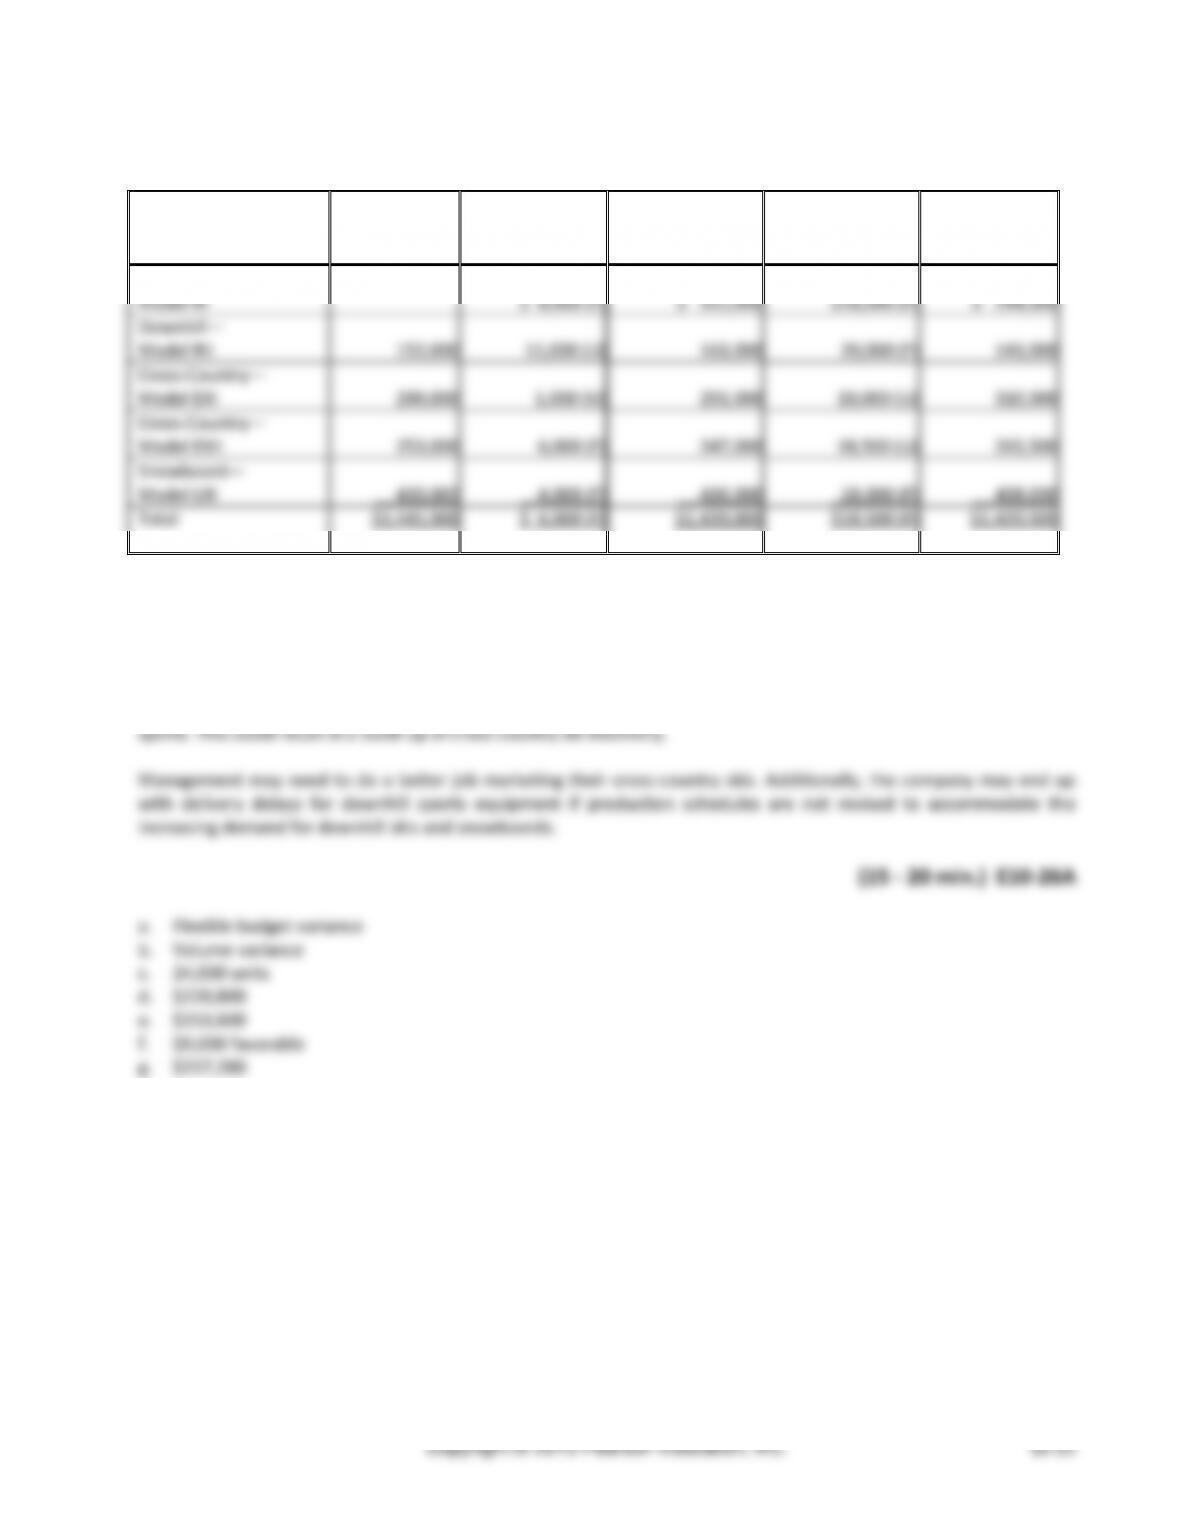
(15-20 min.) E10-25A
Req. 1
Ski Products-Subunit X
Revenue by Product
Actual
Flexible
Budget
Variance
Flexible Budget
Sales Volume
Variance
Static
(Master)
Budget
Downhill—
Model RI
$ 320,000
$ 8,000 (F)
$ 312,000
$18,000 (F)
$ 294,000
Downhill—
Model RII
152,000
11,000 (U)
163,000
20,000 (F)
143,000
Cross-Country—
Model EXI
290,000
1,000 (U)
291,000
19,000 (U)
310,000
Cross-Country—
Model EXII
253,000
6,000 (F)
247,000
18,500 (U)
265,500
Snowboard—
Model LXI
430,000
4,000 (F)
426,000
18,000 (F)
408,000
Total
$1,445,000
$ 6,000 (F)
$1,439,000
$18,500 (F)
$1,420,500
Req. 2
This subunit is a revenue center.
Req. 3
The sales volume variance is always due strictly to volume — therefore, the number of units sold was different than
budgeted for every model. The company sales mix appears to be shifting in the direction of downhill ski and snowboard
Managerial Accounting 4e Solutions Manual
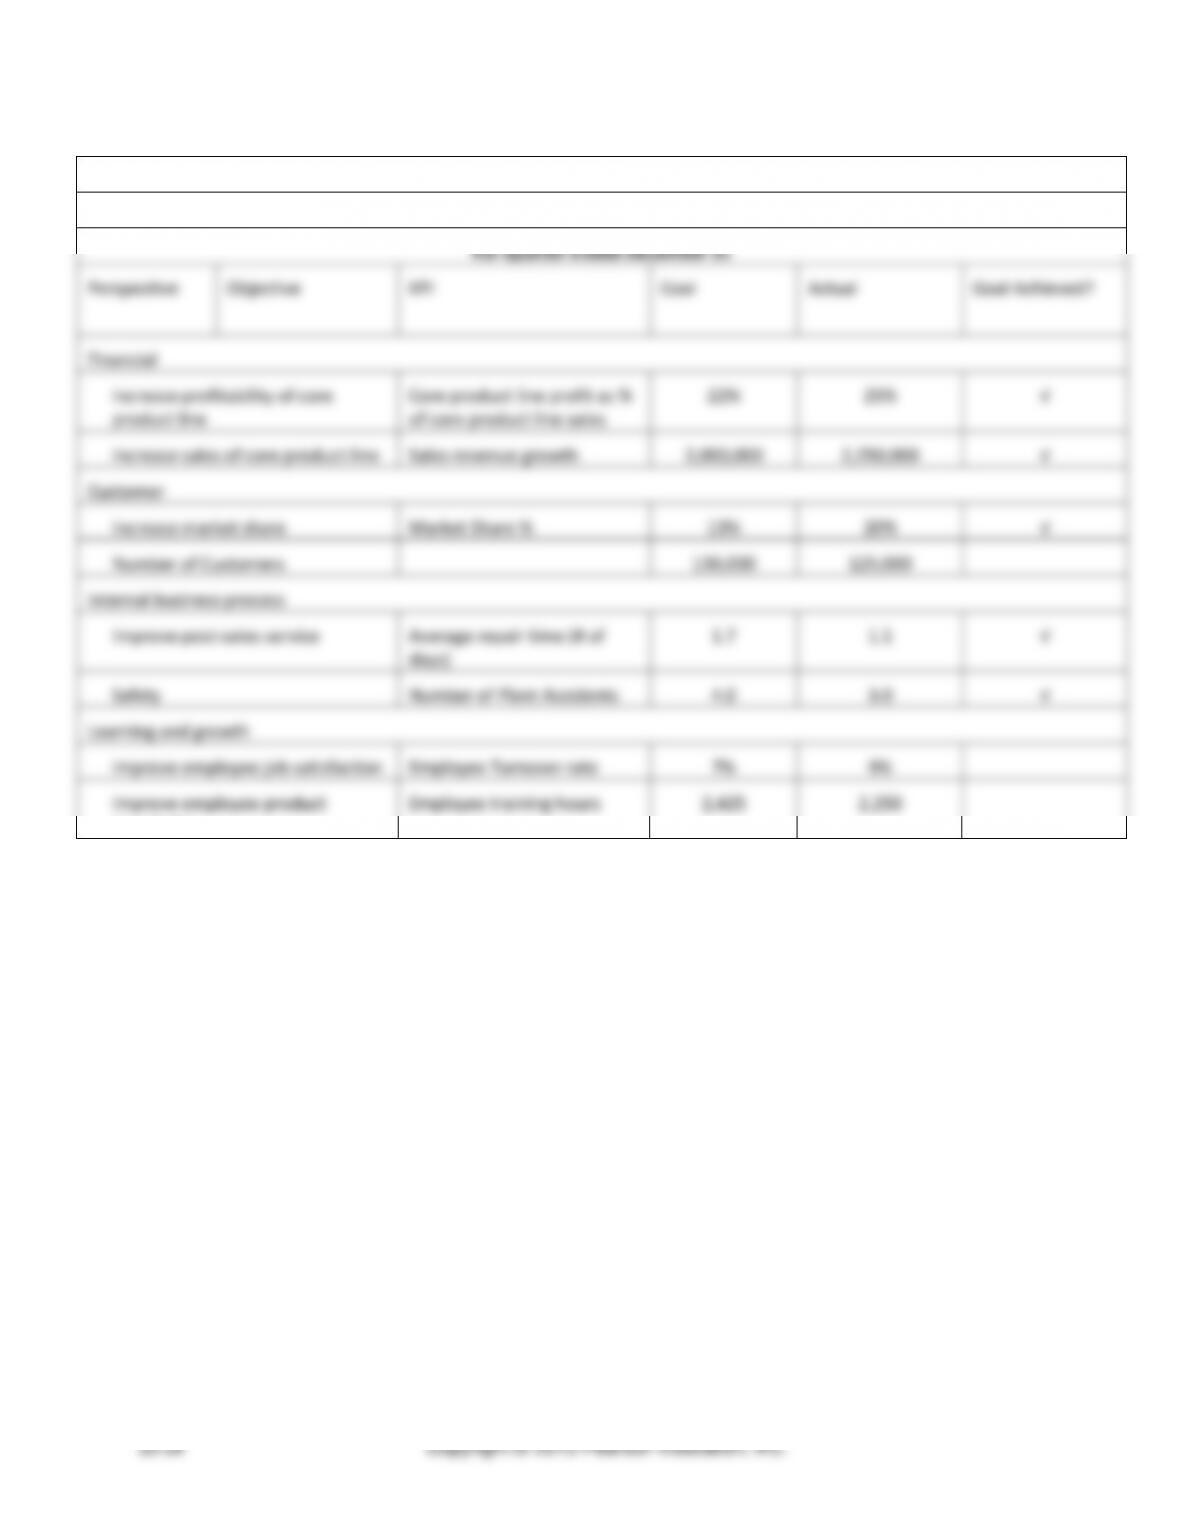
(15 – 20 min.) E10-27A
Mancato Corporation
Balanced Scorecard Report
For Quarter Ended December 31
Perspective
Objective
KPI
Goal
Actual
Goal Achieved?
Financial
Increase profitability of core
product line
Core product line profit as %
of core product line sales
22%
25%
√
Increase sales of core product line
Sales revenue growth
2,000,000
2,250,000
√
Customer
Increase market share
Market Share %
13%
20%
√
Number of Customers
130,000
125,000
Internal business process
Improve post-sales service
Average repair time (# of
days)
1.7
1.1
√
Safety
Number of Plant Accidents
4.0
3.0
√
Learning and growth
Improve employee job satisfaction
Employee Turnover rate
7%
9%
Improve employee product
knowledge
Employee training hours
2,425
2,250
Chapter 10 Performance Evaluation
(15 – 20 min.) E10-28A
a. Financial
b. Internal business
c. Learning and growth
Managerial Accounting 4e Solutions Manual
Exercises (Group B)
(5 – 10 min.) E10-29B
a. Profit
b. Cost
c. Revenue
d. Cost
(15 min.) E10-31B
Performance Report
Clayton Industries – Pharmaceutical Segment
For Fiscal Year Ending December 31
(all data is in millions)
Actual
Budgeted
Variance
Variance
%
Sales
$ 908,280
$ 783,000
$ 125,280F
16.00%
Less Variable Expenses:
Variable Cost of Goods Sold
$ 310,590
$ 304,500
$ 6,090U
2.00%
Variable Operating Expenses
$ 78,300
$ 87,000
$ 8,700F
10.00%
Contribution Margin
$ 519,390
$ 391,500
$ 127,890F
32.67%
Less Direct Fixed Expenses:
Fixed Manufacturing Overhead
$ 112,270
$ 103,000
$ 9,270U
9.00%
Fixed Operating Expenses
$ 22,000
$ 20,000
$ 2,000U
10.00%
Segment Margin
$ 385,120
$ 268,500
$ 116,620F
43.43%
Less Common Fixed Expenses
$ 23,690
$ 23,000
$ 690U
3.00%
Operating Income
$ 361,430
$ 245,500
$ 115,930F
47.22%
Managerial Accounting 4e Solutions Manual
(10-15 min.) E10-32B
Req. 1
Residential
Professional
Operating income
$ 70,200
$152,040
÷ Total assets
÷$195,000
÷$362,000
Return on investment
36%
42%
Each division’s ROI is very high; however, the Professional Division has an even higher ROI (46%) than the Residential
Division.
Req. 2
Residential
Professional
Operating income
$ 70,200
$152,040
÷ Sales
÷$585,000
÷$1,013,600
Sales margin
12%
15%
The Professional Division is earning about $0.15 on each dollar of sales whereas the Residential Division is only earning
about $0.15 on each dollar of sales. The Professional Division’s higher sales margin helps to account for its higher ROI.
Req. 3
Residential
Professional
Sales
$585,000
$1,013,600
÷ Total assets
÷$195,000
÷$ 362,000
Capital turnover
3.00 times
2.80 times
Sales margin
× Capital turnover
ROI
(10 min.) E10-33B
Osborne
Company
Plumb Industries
Calloway Inc.
Sales (S)
$108,000
$840,000
$520,000
Operating income (OI)
$43,200
$126,000
$41,600
Total assets (TA)
$72,000
$200,000
$208,000
Sales margin (SM)
40%
15%
8%
Capital turnover (CT)
1.50
4.20
2.50
Return on investment (ROI)
60%
63%
20%
Target rate of return
9%
19%
18%
Residual income (RI)
$36,720
$88,000
$4,160
(10 min.) E10-34B
Req. 1
Sales Margin = Operating income ÷ Sales
Sales Margin
=
$8,060 ÷ $31,000
=
26%
Capital Turnover = Sales ÷ Total Assets
Capital Turnover
=
$31,000 ÷ $15,500
=
2.00 times
ROI = Operating income ÷ Total Assets
ROI
=
$8,060 ÷ $15,500
=
52%
Req. 2
RI = Operating Income − (Target rate of return × Total assets)
RI
=
$8,060 − (15% x $15,500) = $5,735
Managerial Accounting 4e Solutions Manual
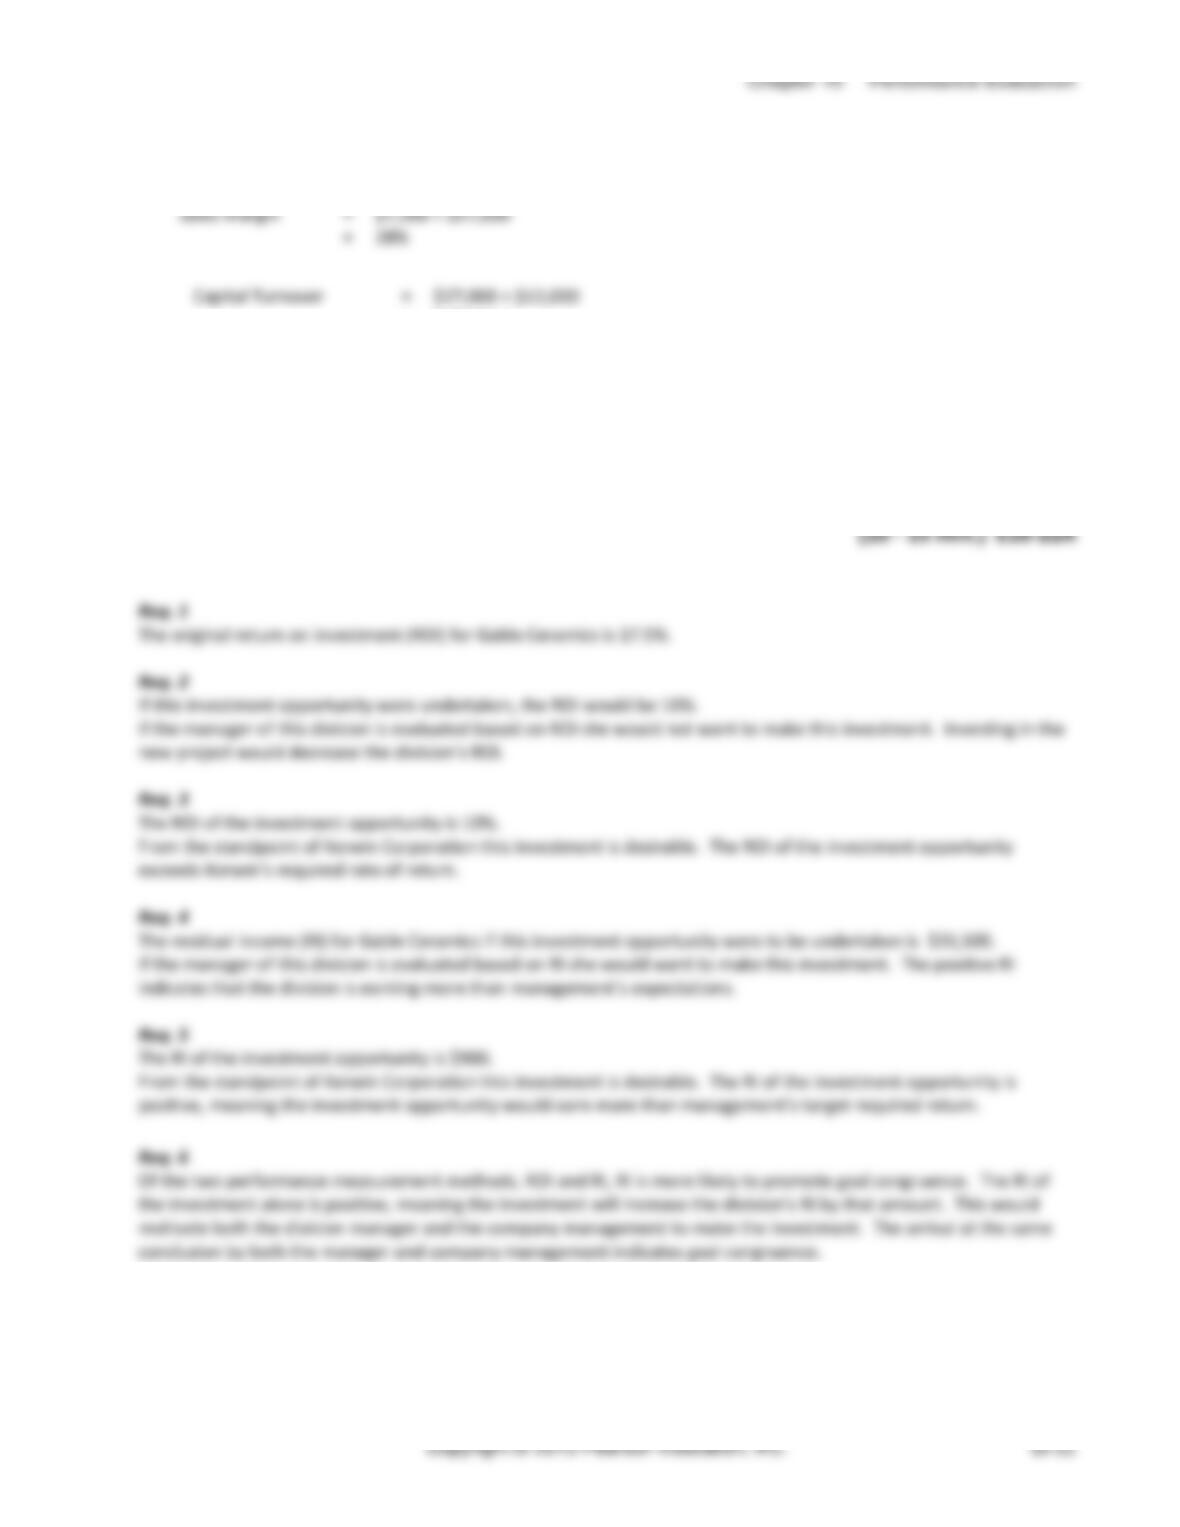
(10-15 min.) E10-35B
Req. 1
The original return on investment (ROI) for the Cleary Ceramics division before the additional investment is 17.5%.
Req. 2
If this investment opportunity were undertaken the ROI would be 16.4%.
(10 min.) E10-36B
Req. 1