(continued) Ethical Issue 2
4. The FASB and IASB are working on a proposed new lease standard
that removes the mechanical criteria for lease capitalization discussed in
Focus on Financials: Amazon.com, Inc.
(20 min.)
Req. 1
Amazon.com, Inc.’s accounts payable increased from $11,145 million in
2011 to $13,318 million in 2012, an increase of about 19.5 percent.
Accordingly, Account Payable Turnover is:
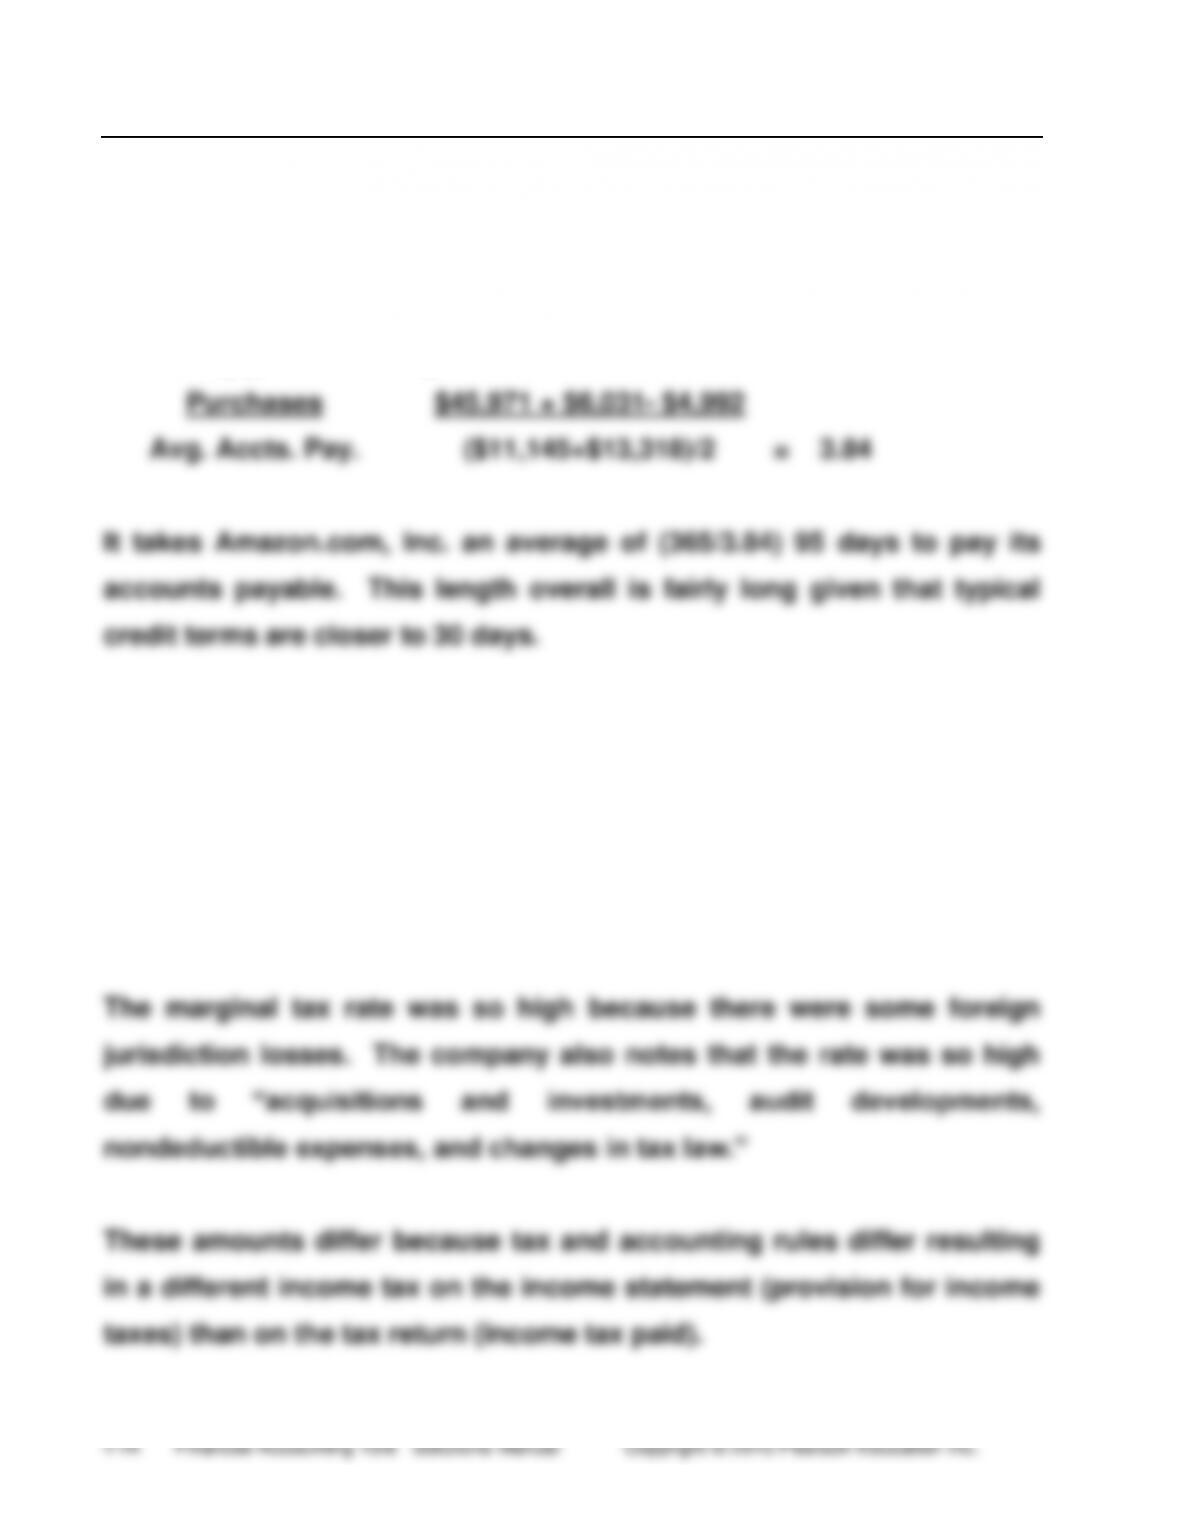
Purchases
Avg. Accts. Pay.
$45,971 + $6,031- $4,992
($11,145+$13,318)/2
= 3.84
It takes Amazon.com, Inc. an average of (365/3.84) 95 days to pay its
accounts payable. This length overall is fairly long given that typical
credit terms are closer to 30 days.
Req. 2
Provision for income taxes $428 million
Income taxes paid 112 million
Marginal tax rate 78.6%
(continued) Amazon.com
Req. 3
Refer to Note 6—Long Term Debt. Based on this information, the
company’s long term debt (after current maturities) increased from $255
million in 2011 to $3,112 million in 2012. From this increase, you can tell
Req. 4
Refer to Note 8—Commitments and Contingencies.
The footnotes disclose commitments of $2,496 million for 2013. Some of
(continued) Amazon.com
The footnotes also include a discussion of various legal proceedings
against Amazon. These legal proceedings are of the nature of
“disclosed” loss contingencies, as discussed in the chapter, and
therefore, are not included in the financial statements. The criteria for
disclosure of these contingent liabilities is that it is reasonably possible
that the company will have an obligation from the lawsuit in the future. It
is also possible that the contingencies are probable but they cannot
estimate the amount of the loss.
Req. 5
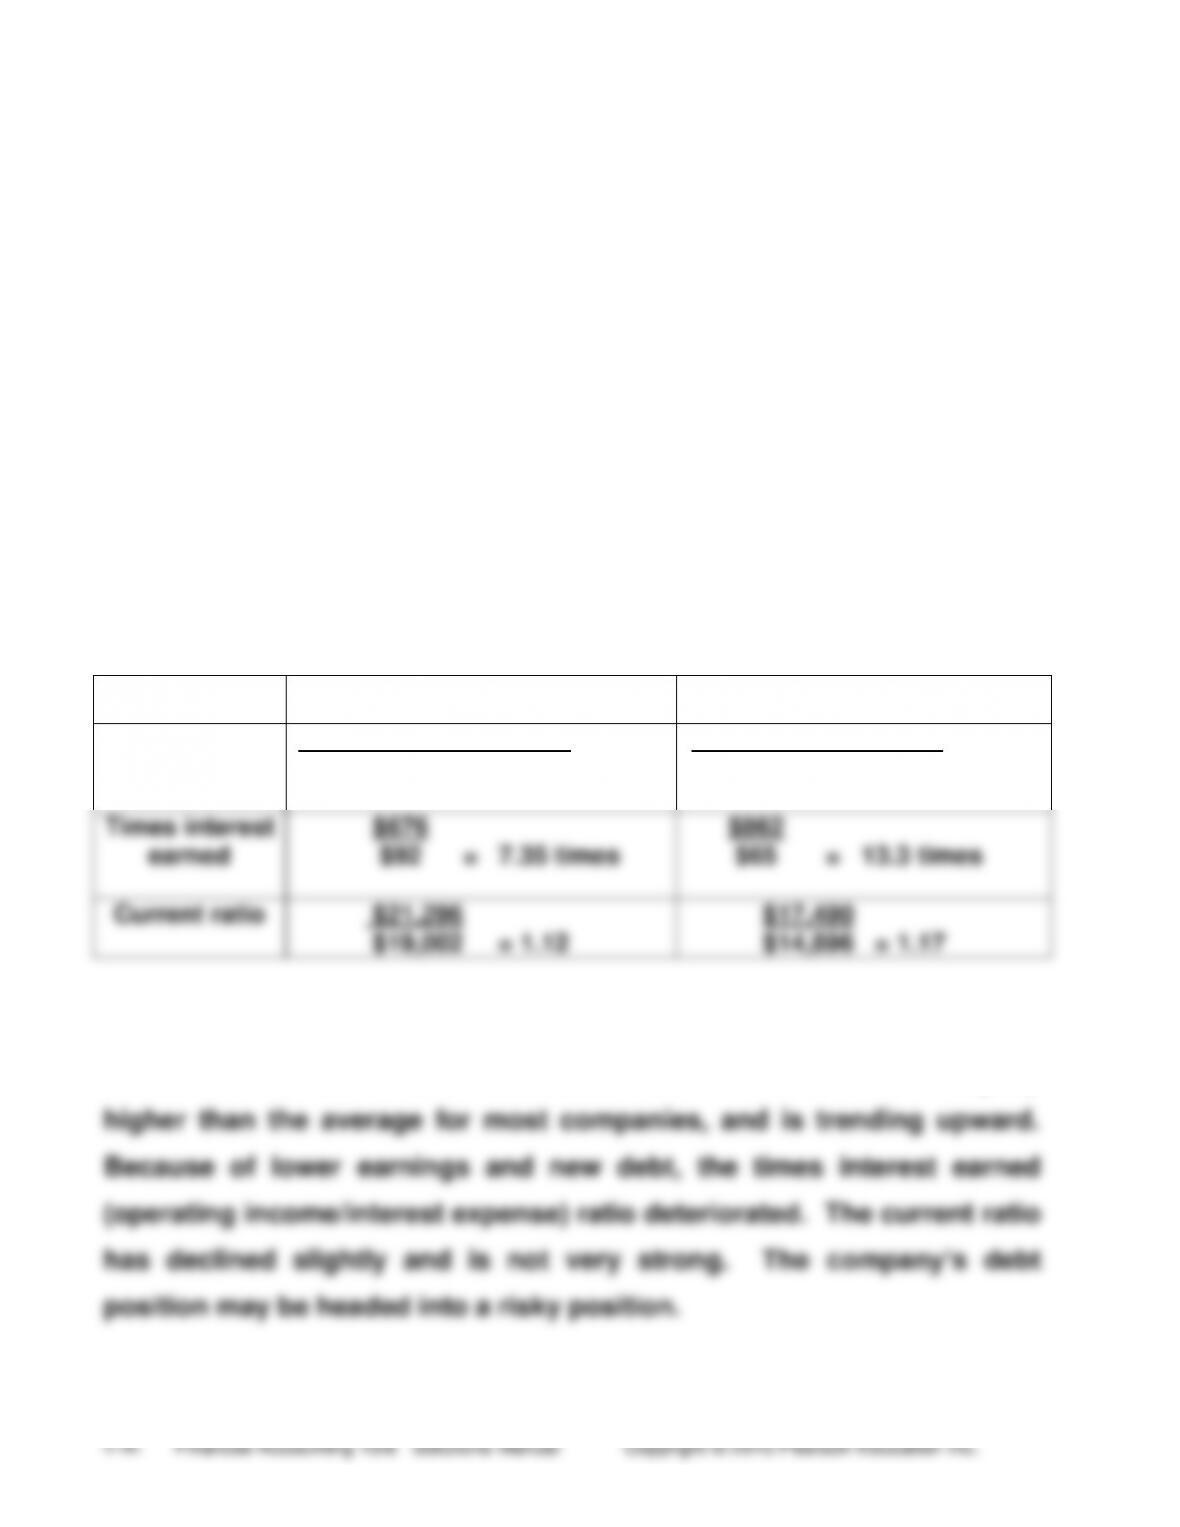
Ratio
2012
2011
Debt ratio
$19,002 + 3,084 + 2,277 =74.8%
$32,555
$14,896 + 255 + 2,370 =69.3%
$25,278
Times interest
earned
$676
$92 = 7.35 times
$862
$65 = 13.3 times
Current ratio
$21,296
$19,002 = 1.12
$17,490
$14,896 = 1.17
Amazon.com, Inc.’s debt ratio increased during 2012, as reflected in the
increase of its debt to total asset ratios from 2011 to 2012. It is slightly
(continued) Amazon.com
Focus on Financials: YUM! Brands, Inc.
(20 min.)
Req. 1
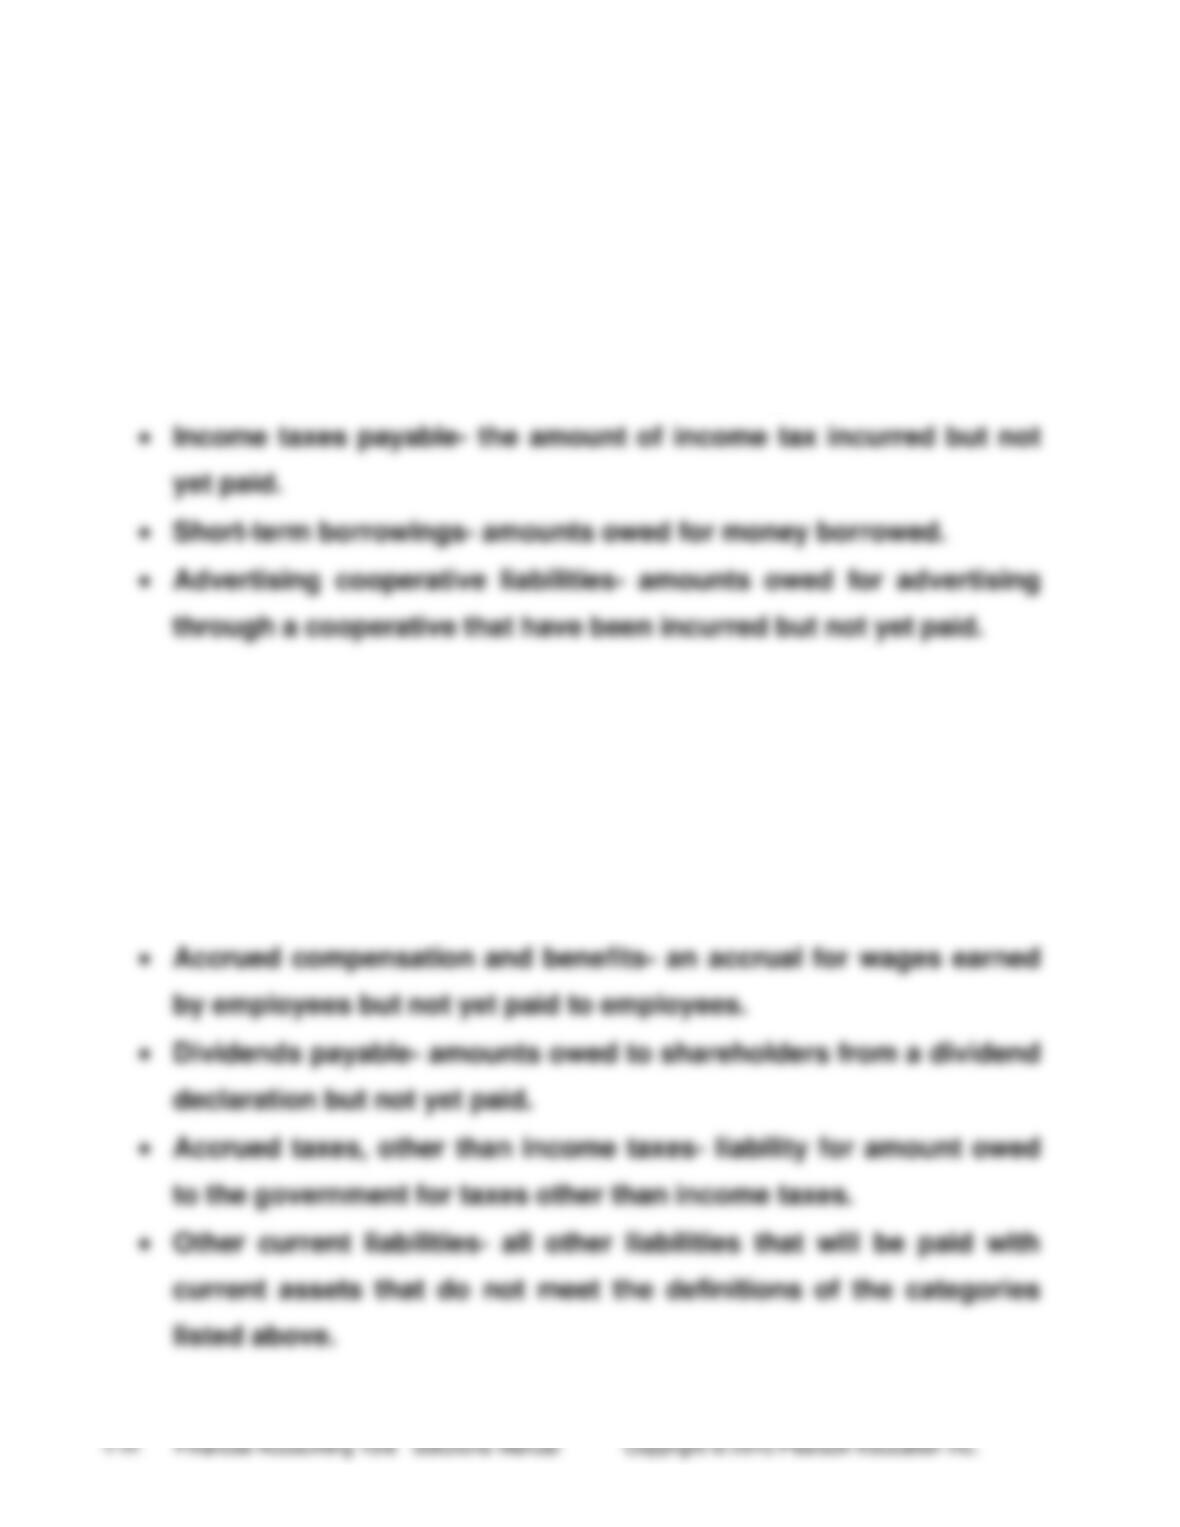
• Accounts payable and other current liabilities- the amount owed for
products or services purchased on account and other current
liabilities owed that do not fit in the below categories.
Req. 2
• Accounts payable- the amount owed for products or services
purchased on account.
• Accrued capital expenditures- amounts owed for capital
expenditures but not yet paid.
(continued) YUM! Brands, Inc.
Req. 3
AP
Turnover
Purchases
Avg. Accts.Pay.
$3,874 + $313 – $273
($684 + $712)/2
5.6
Days in
AP
365
AP Turnover
365
5.6
65
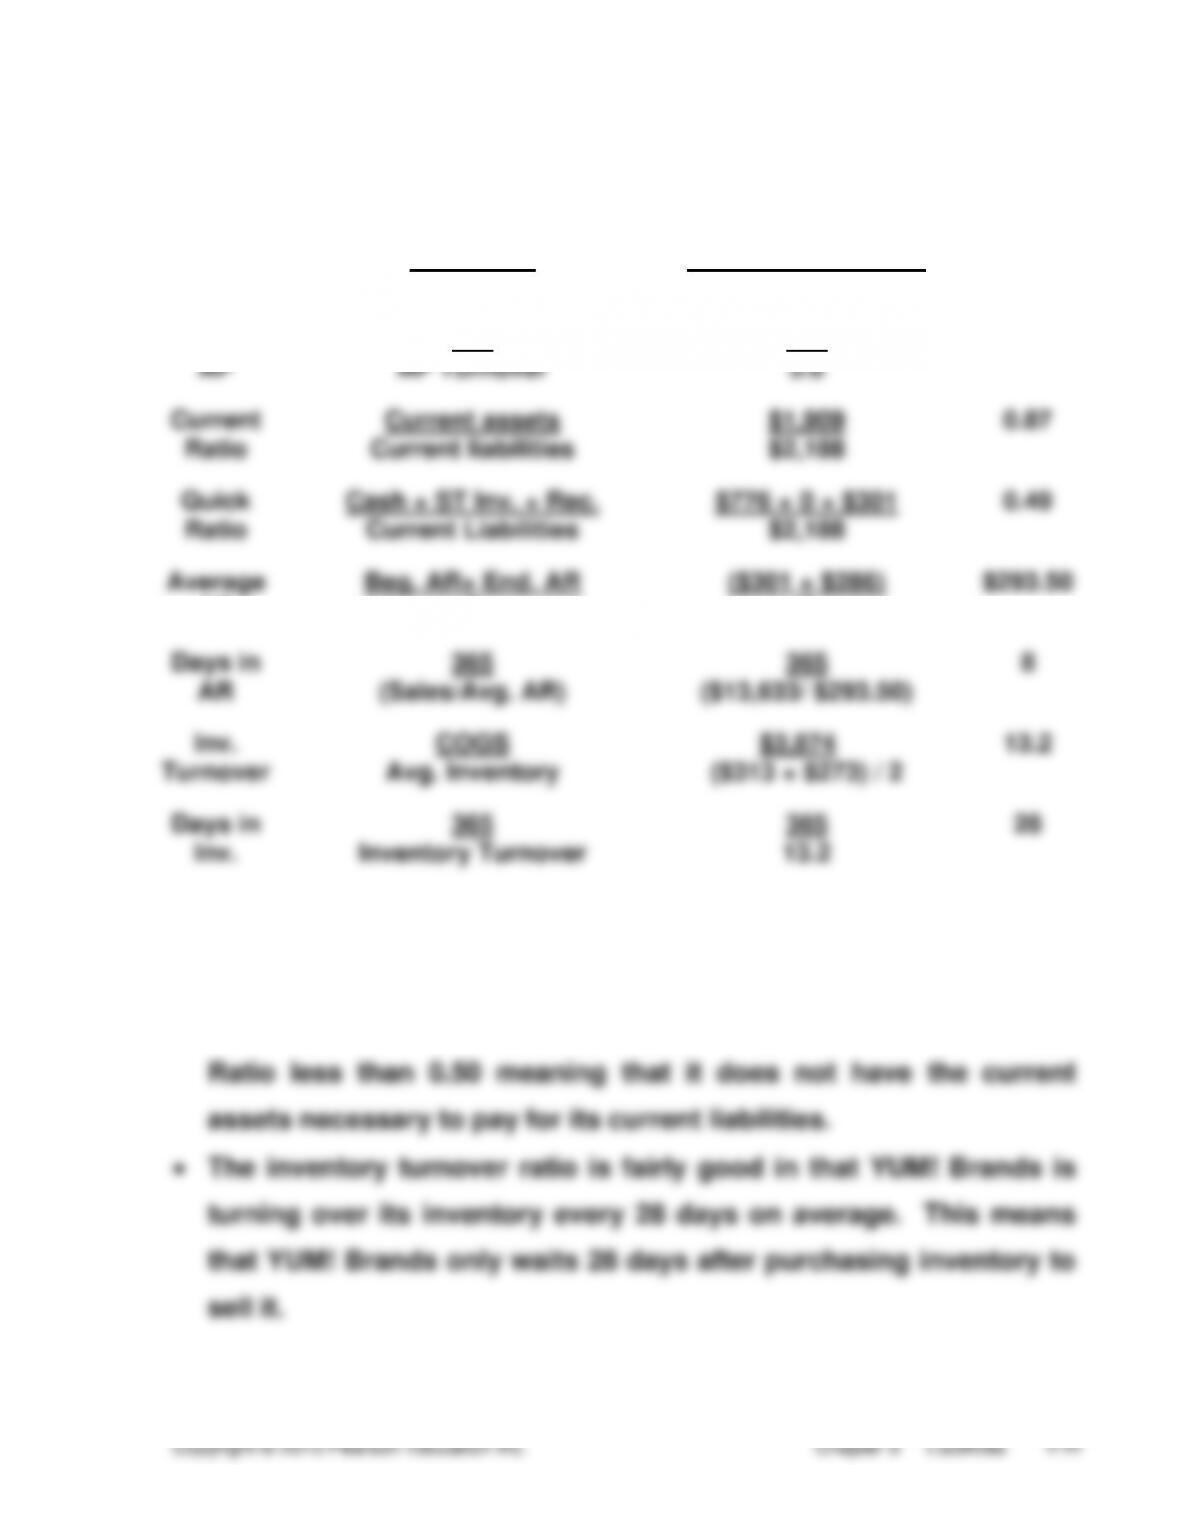
Current
Ratio
Current assets
Current liabilities
$1,909
$2,188
0.87
Quick
Ratio
Cash + ST Inv. + Rec.
Current Liabilities
$776 + 0 + $301
$2,188
0.49
Average
AR
Beg. AR+ End. AR
2
($301 + $286)
2
$293.50
Days in
AR
365
(Sales/Avg. AR)
365
($13,633/ $293.50)
8
Inv.
Turnover
COGS
Avg. Inventory
$3,874
($313 + $273) / 2
13.2
Days in
Inv.
365
Inventory Turnover
365
13.2
28
• The company is currently able to pay its accounts within an
average of about 65 days which is longer than optimal.
• The company has a weak Current Ratio less than 1 and a Quick
(continued) YUM! Brands, Inc.
• YUM! Brands is in a great position as it turns inventory purchases
Overall, it appears that YUM! Brands, Inc. has some liquidity problems.
The low current ratio and the low quick ratio are troublesome. Another
red flag is the slow accounts payable turnover.
Req. 4
The note has the following items:
Current maturities of long-term debt
Capital lease obligations
Unsecured revolving credit facility
(continued) YUM! Brands, Inc.
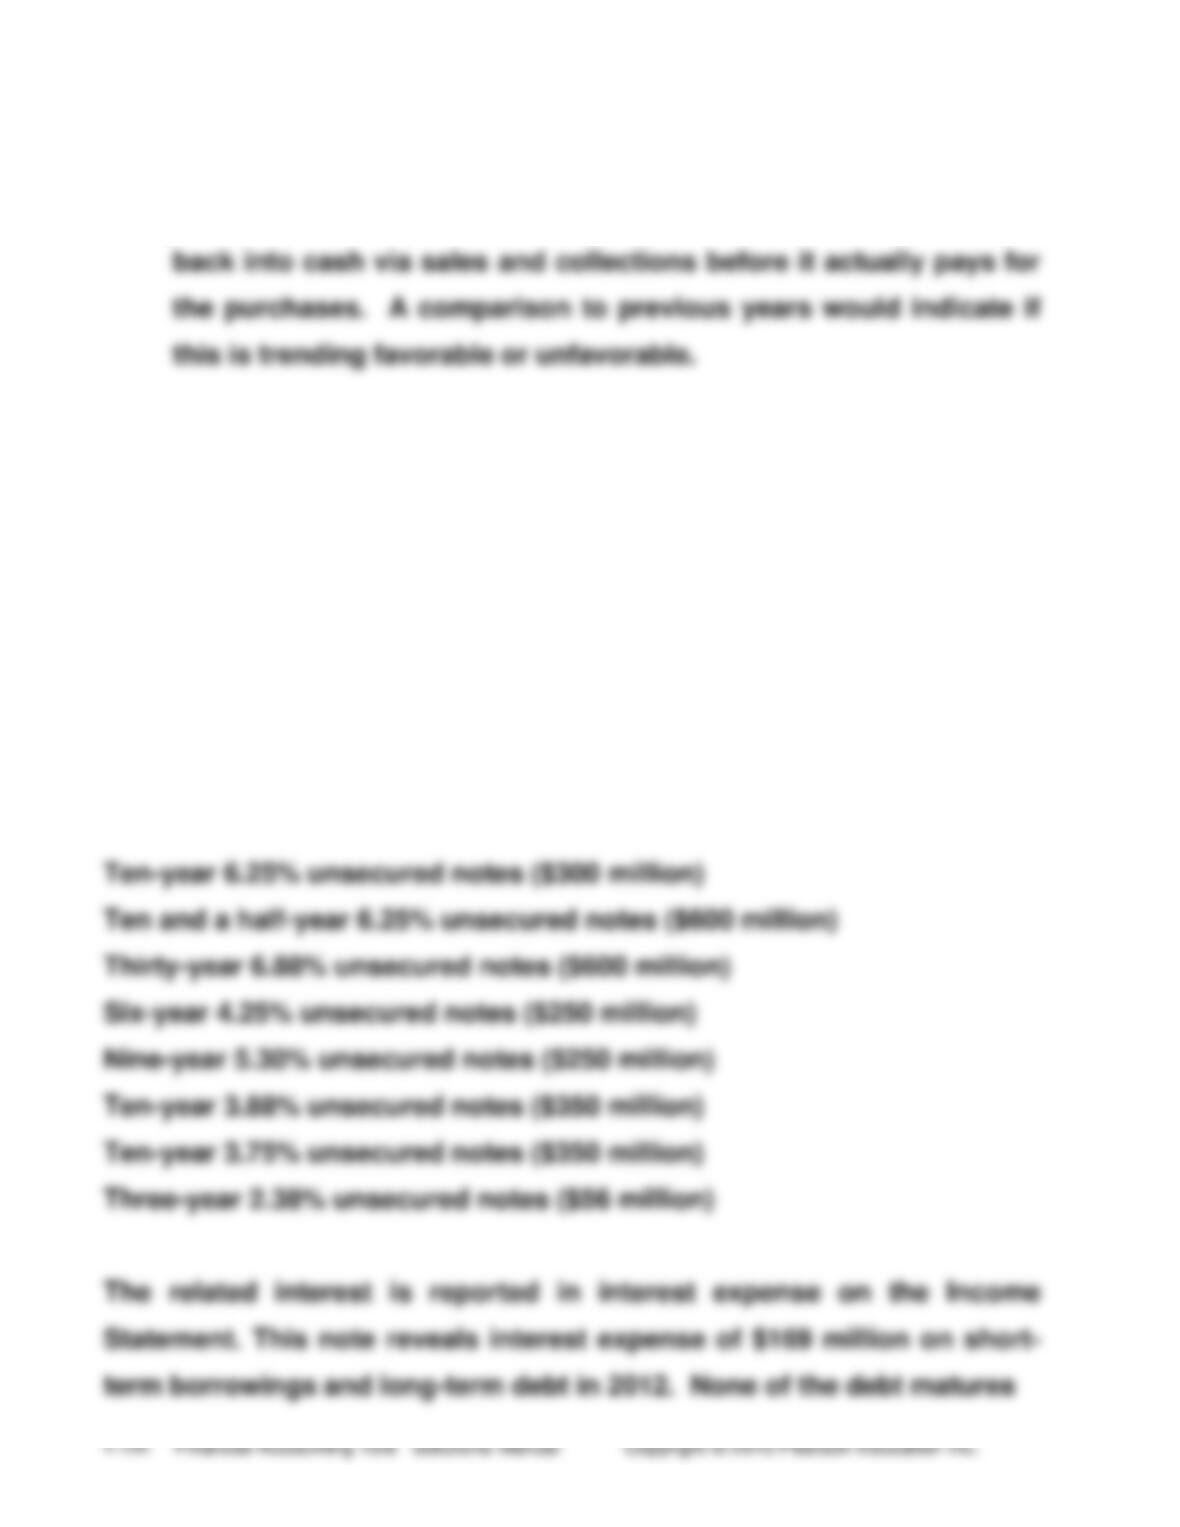
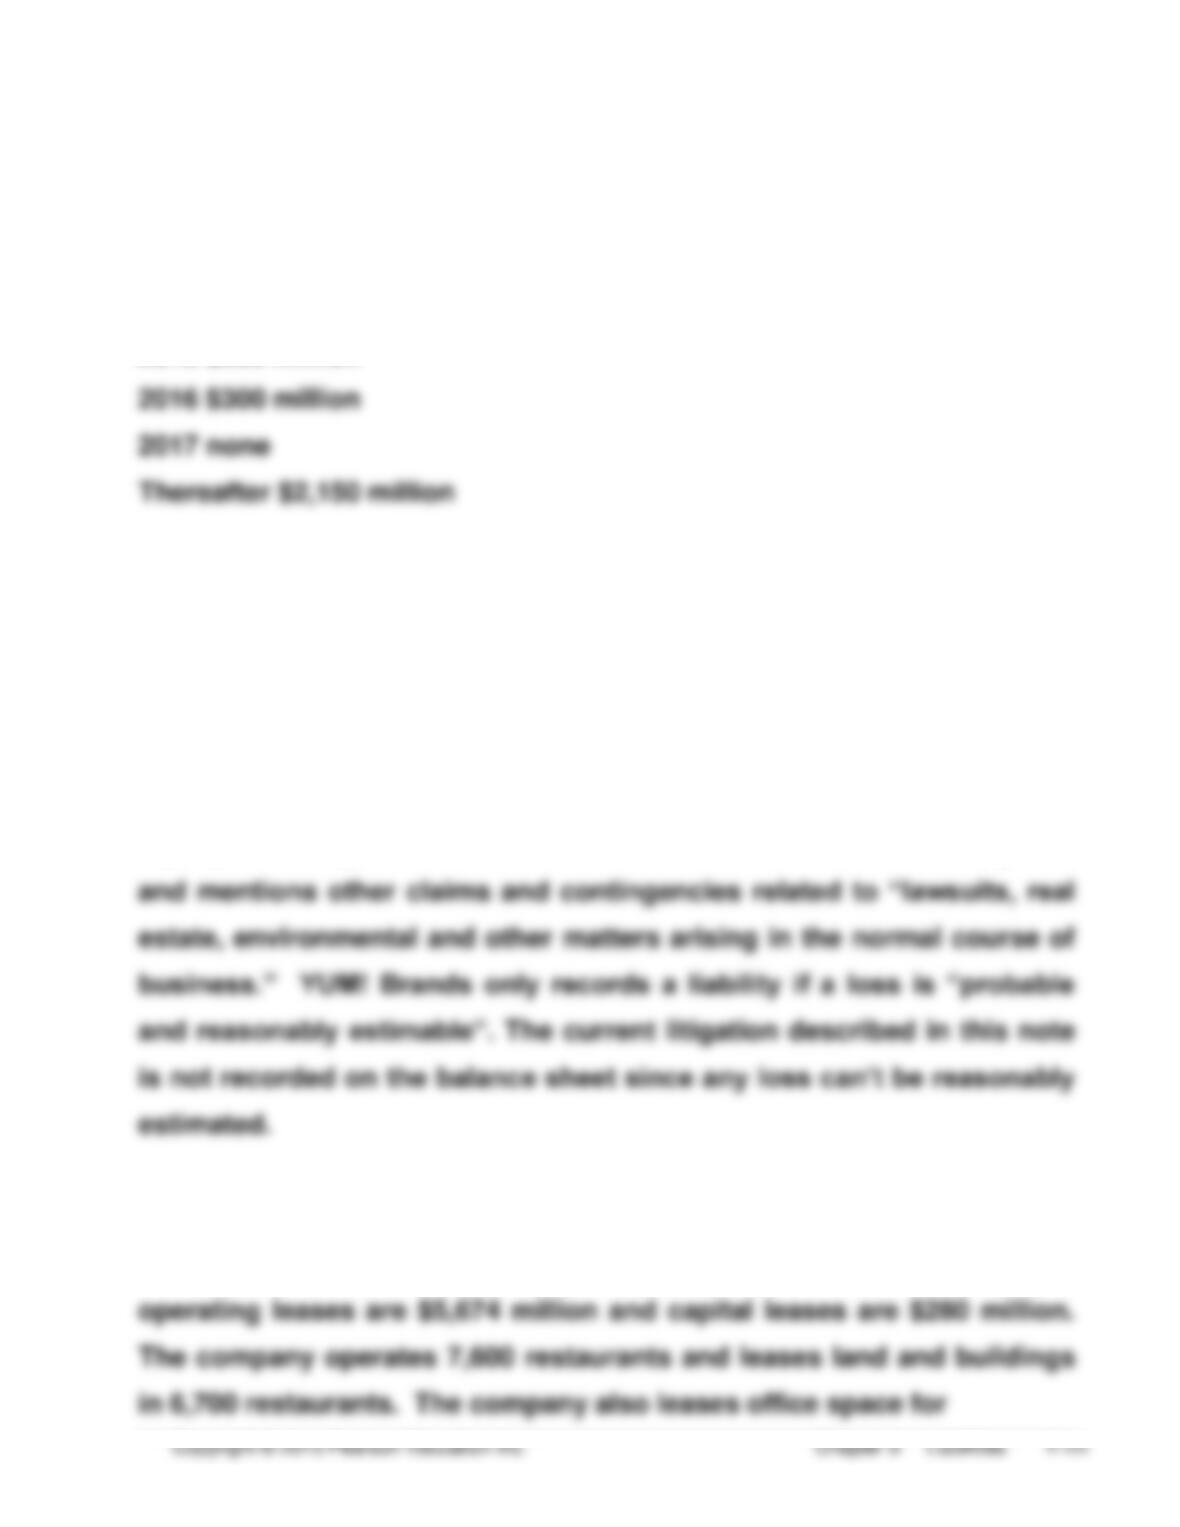
in 2013. The note provides a schedule of annual maturities of short-term
borrowings and long-term debt as of December 31, 2012 as follows:
2014 $56 million
2015 $250 million
Req. 5
In Note 19—Contingencies, there is information about: (1) lease
guarantees, (2) franchise loan pool and equipment guarantees, (3)
unconsolidated affiliates guarantees, (4) insurance programs and (5)
legal proceedings.YUM! Brands discloses facts about current litigation
Req. 6
Operating leases dominate capital leases. At December 29, 2012,
(continued) YUM! Brands, Inc.
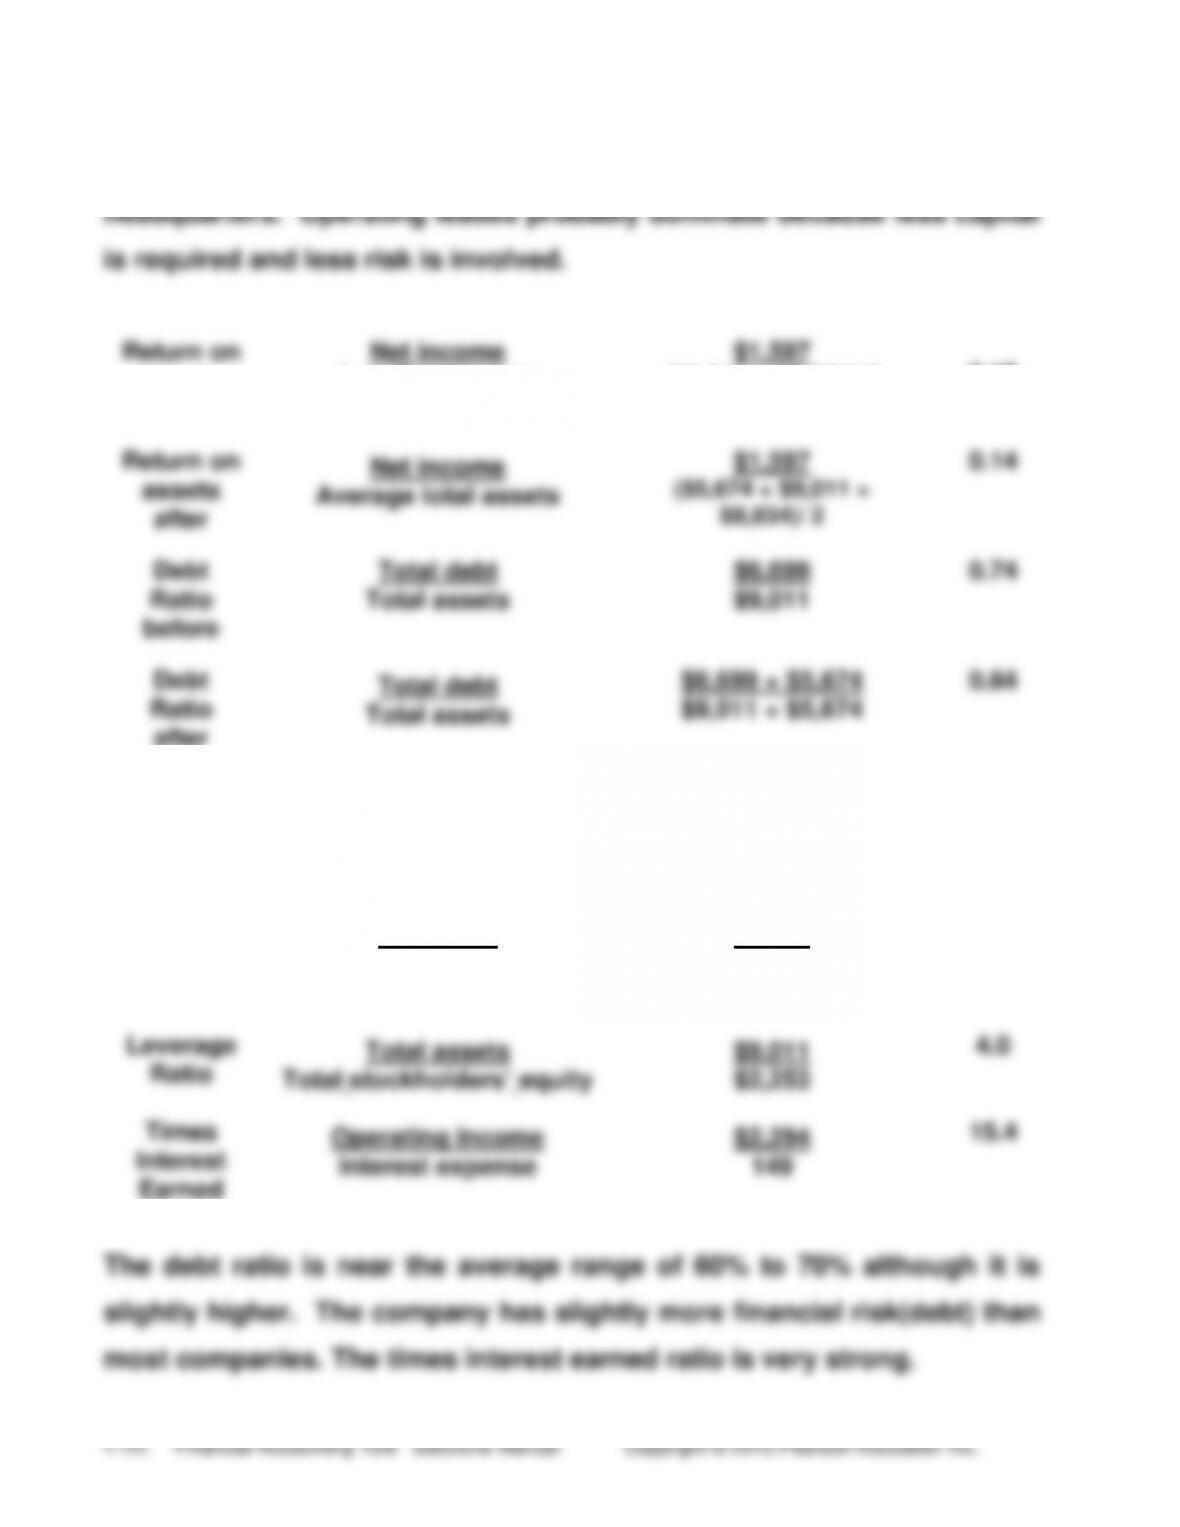
Req. 8
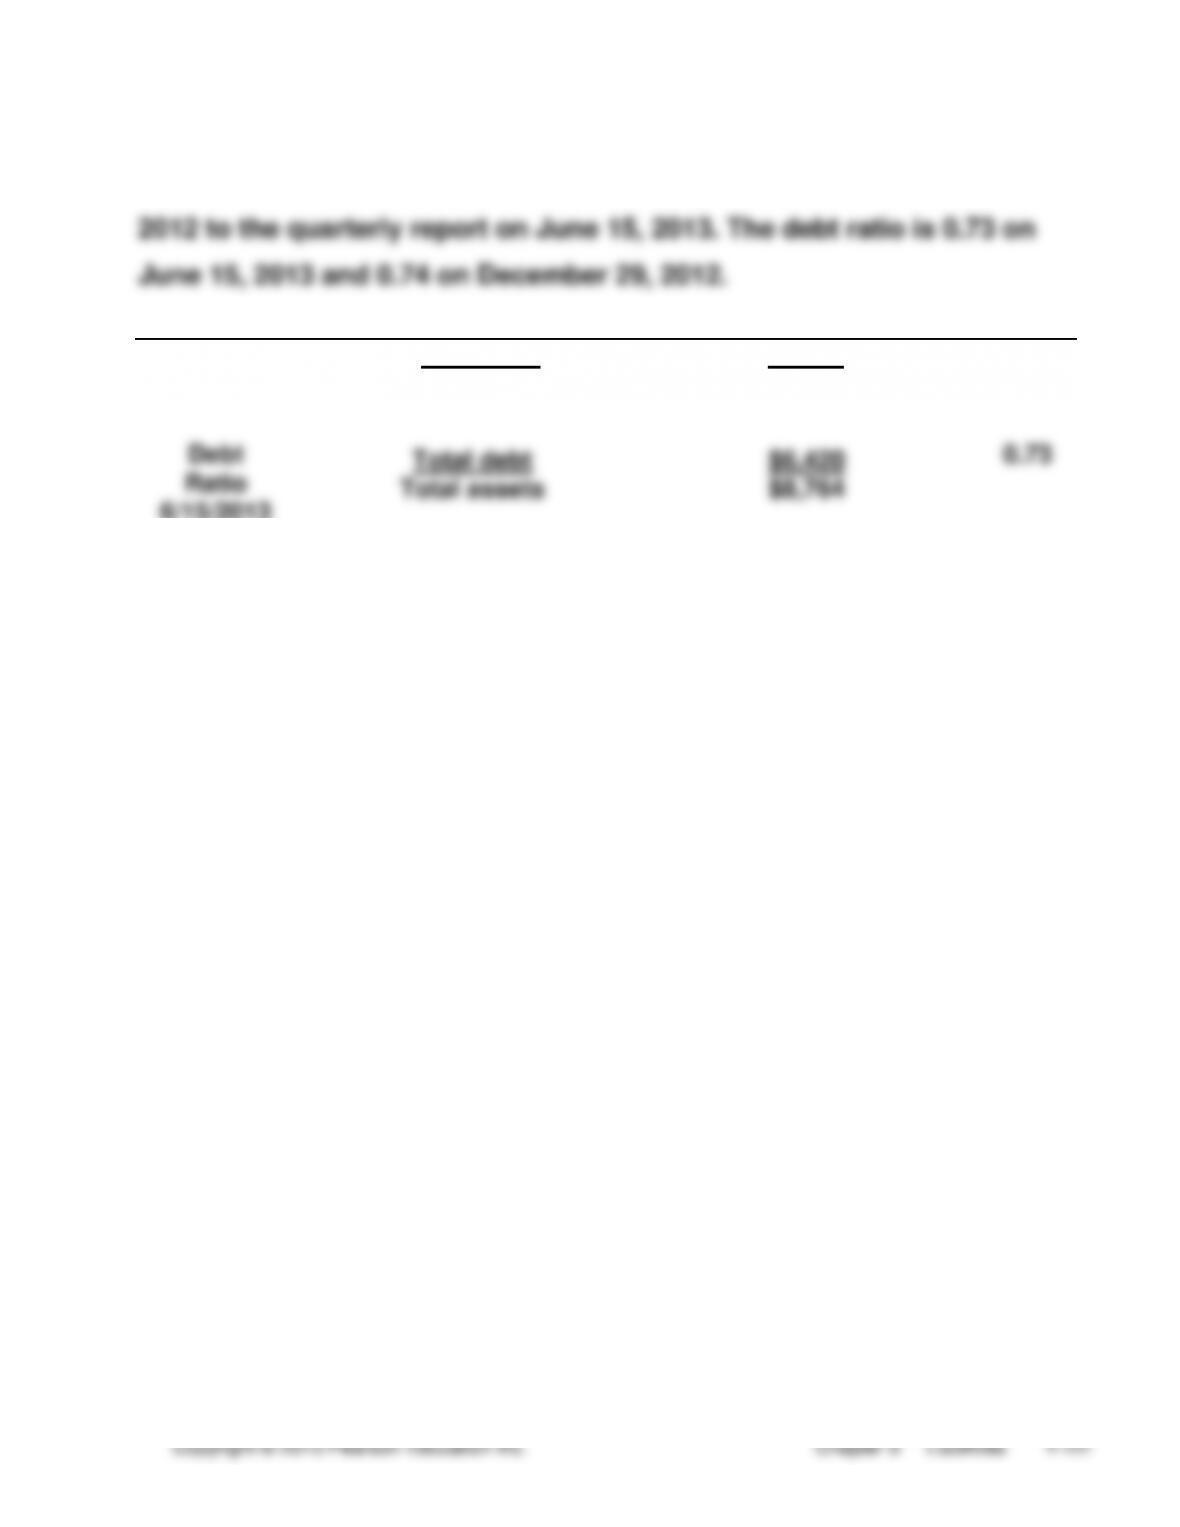
The debt ratio is unchanged from the fiscal year end of December 29,
Debt Ratio
12/29/2012
Total debt
Total assets
$6,699
$9,011
0.74
Debt
Ratio
6/15/2013
Total debt
Total assets
$6,420
$8,764
0.73
Group Projects