(25-35 min.) P 7-60A
Journal
DATE
ACCOUNT TITLES
DEBIT
CREDIT
Jan.
3
Equipment (new) ………………………………..
175,000
Accumulated Depreciation —
Equipment …………………………………………
68,000
Equipment (old) ………………………………
131,000
Cash ………………………………………………
104,000
Gain on Trade-in of Equipment
[$71,000 – ($131,000 − $68,000)] ………
8,000
June
30
Depreciation Expense — Building
[($640,000 − $240,000) / 40 x 6/12] ……….
5,000
Accumulated Depreciation —
Building ………………………………………..
5,000
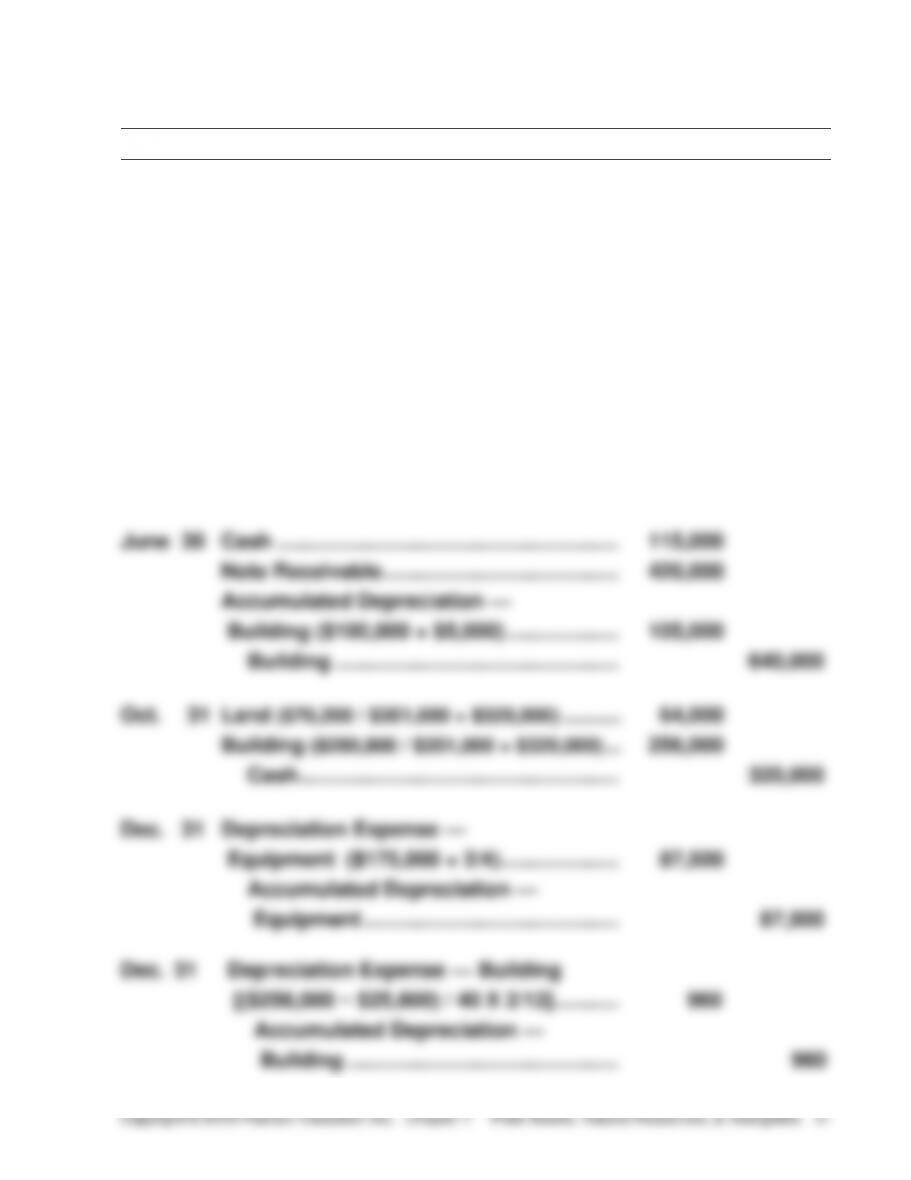
June
30
Cash ………………………………………………….
115,000
Note Receivable ………………………………….
420,000
Accumulated Depreciation —
Building ($100,000 + $5,000) ……………….
105,000
Building …………………………………………
640,000
Oct.
31
Land ($70,200 / $351,000 × $320,000) ………..
64,000
Building ($280,800 / $351,000 × $320,000) …
256,000
Cash ………………………………………………
320,000
Dec.
31
Depreciation Expense —
Equipment ($175,000 × 2/4) ………………..
87,500
Accumulated Depreciation —
Equipment …………………………………….
87,500
Dec.
31
Depreciation Expense — Building
[($256,000 − $25,600) / 40 X 2/12] ………..
960
Accumulated Depreciation —
Building ……………………………………….
960
(30-40 min.) P 7-61A
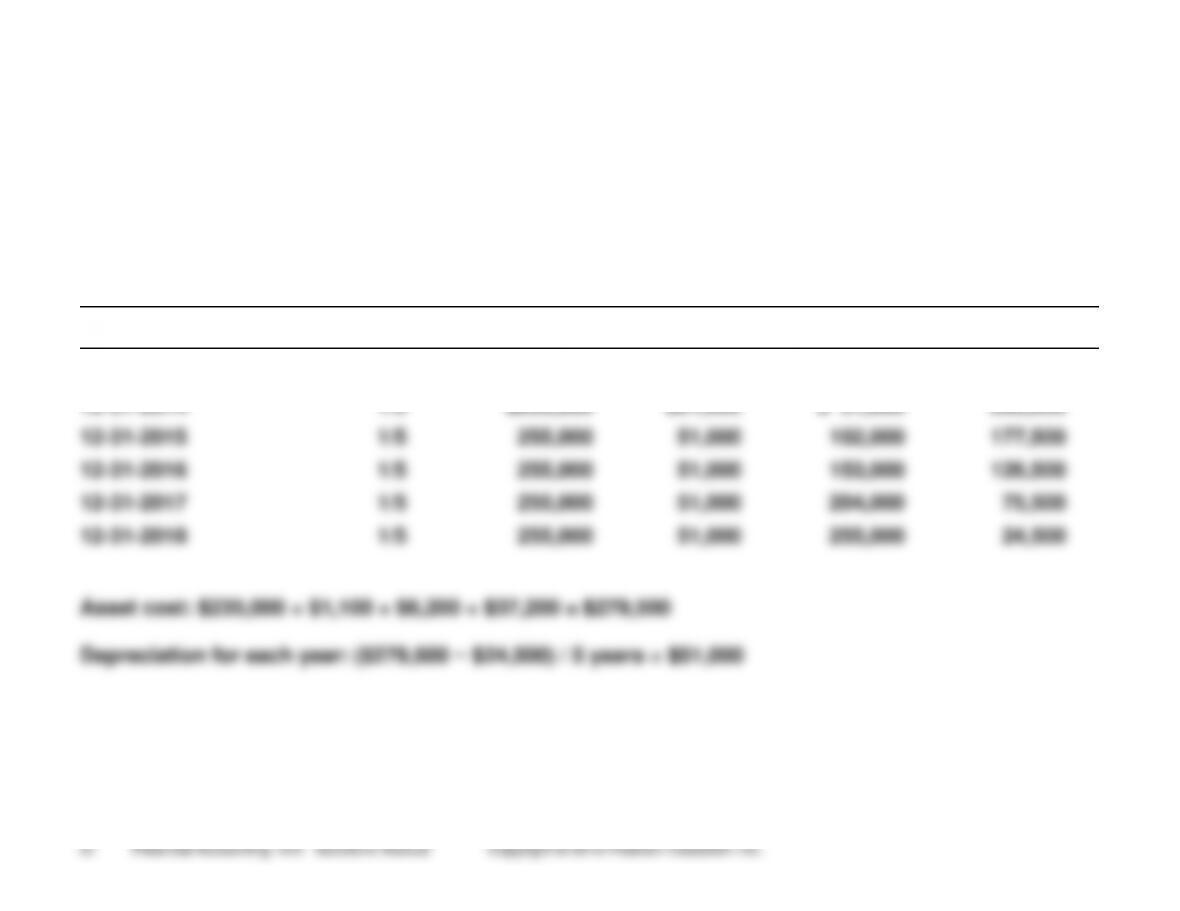
Req. 1
Straight-Line Depreciation Schedule
Depreciation for the Year
DATE
ASSET
COST
DEPRECIATION
RATE ×
DEPRECIABLE
COST =
DEPRECIATION
EXPENSE
ACCUMULATED
DEPRECIATION
ASSET BOOK
VALUE
1-04–2014
$279,500
$279,500
12–31–2014
1/5
$255,000
$51,000
$ 51,000
228,500
12–31–2015
1/5
255,000
51,000
102,000
177,500
12–31–2016
1/5
255,000
51,000
153,000
126,500
12–31–2017
1/5
255,000
51,000
204,000
75,500
12–31–2018
1/5
255,000
51,000
255,000
24,500
(continued) P 7-61A
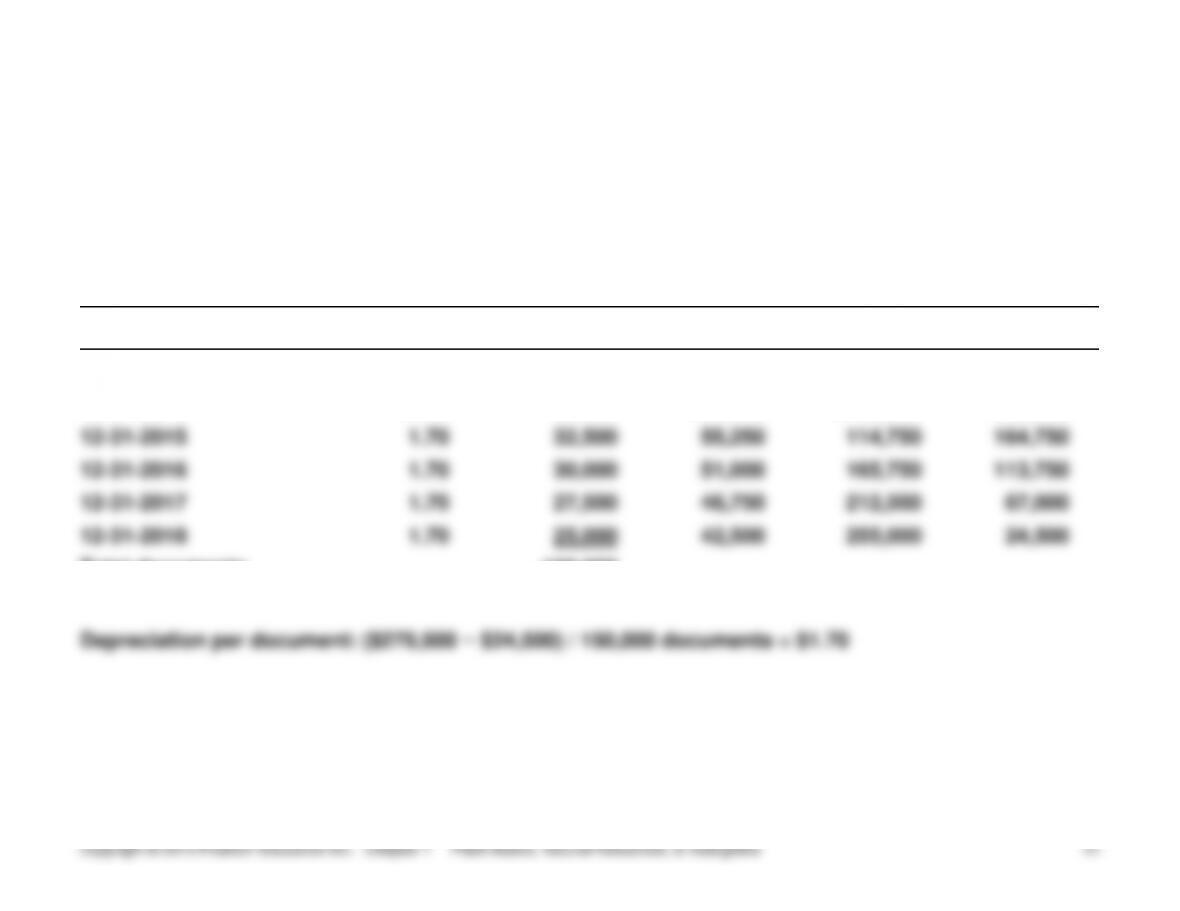
Req. 1
Units-of-Production Depreciation Schedule
Depreciation for the Year
DATE
ASSET
COST
DEPRECIATION
PER DOCUMENT x
NUMBER OF
DOCUMENTS=
DEPRECIATION
EXPENSE
ACCUMULATED
DEPRECIATION
ASSET BOOK
VALUE
1-04–2014
$279,500
$279,500
12–31–2014
$1.70
35,000
$59,500
$ 59,500
220,000
12–31–2015
1.70
32,500
55,250
114,750
164,750
12–31–2016
1.70
30,000
51,000
165,750
113,750
12–31–2017
1.70
27,500
46,750
212,500
67,000
12–31–2018
1.70
25,000
42,500
255,000
24,500
Total documents
150,000
(continued) P 7-61A
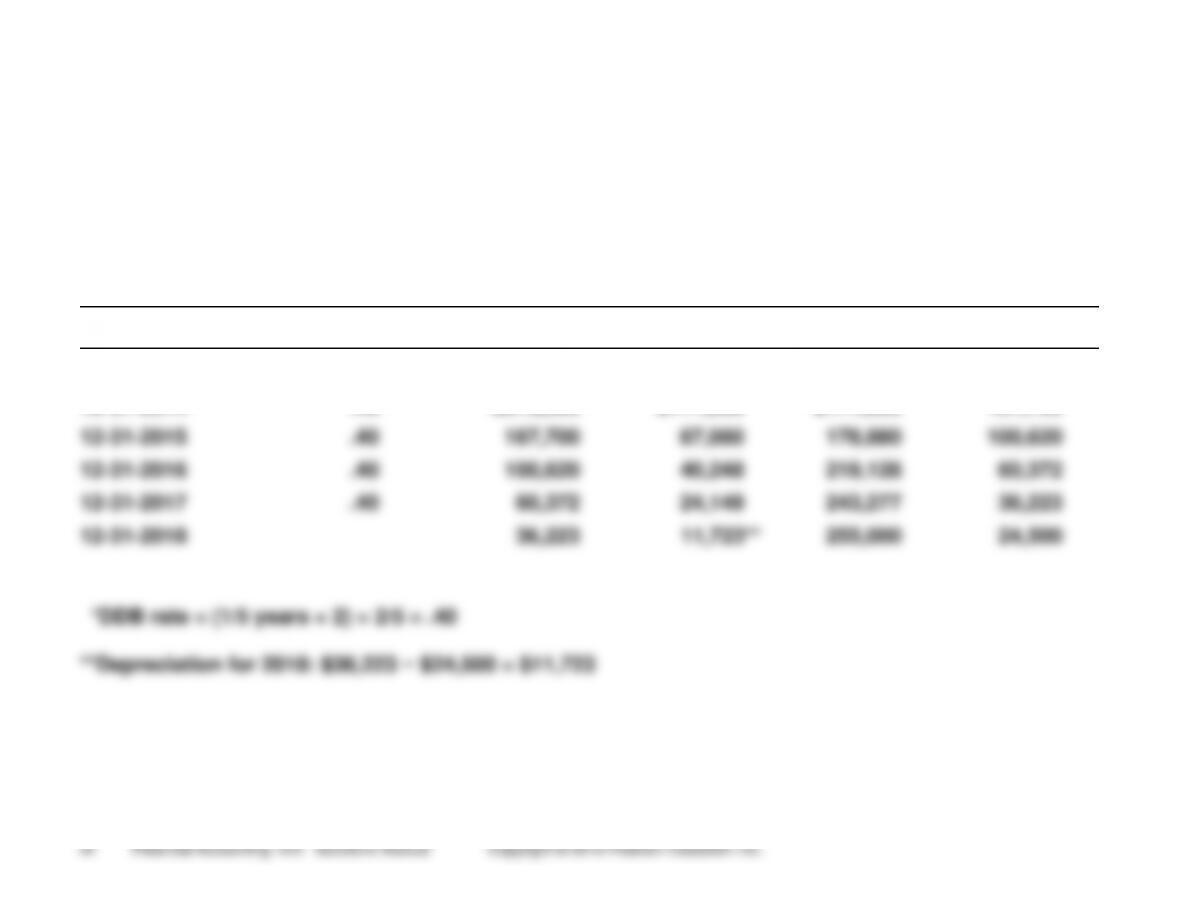
Req. 1
Double-Declining-Balance Depreciation Schedule
Depreciation for the Year
DATE
ASSET
COST
DDB RATE ×
ASSET BOOK
VALUE =
DEPRECIATION
EXPENSE
ACCUMULATED
DEPRECIATION
ASSET BOOK
VALUE
1-04–2014
$279,500
$279,500
12–31–2014
.40*
$279,500
$111,800
$111,800
167,700
12–31–2015
.40
167,700
67,080
178,880
100,620
12–31–2016
.40
100,620
40,248
219,128
60,372
12–31–2017
.40
60,372
24,149
243,277
36,223
12–31–2018
36,223
11,723**
255,000
24,500
(continued) P 7-61A
Req. 2
The depreciation method that maximizes reported income in the first
Req. 3
DEPRECIATION METHOD
THAT IN THE EARLY
YEARS
MAXIMIZES
REPORTED
INCOME
MINIMIZES
INCOME TAX
PAYMENTS
Net income for first year:
SL
DDB
Cash provided by operations before income tax
$154,000
$154,000
Depreciation expense
51,000
111,800
Income before income tax
103,000
42,200
Income tax expense (40%)
41,200
16,880
Net income
$ 61,800
$ 25,320
Net income advantage of SL over DDB $36,480
Cash flow analysis for first year:
Cash provided by operations before
income tax
$154,000
$154,000
Income tax paid
(41,200)
(16,880)
Cash provided by operations
(called “cash flow”)
$112,800
$137,120
Cash flow advantage of DDB over SL
$24,320
(20-25 min.) P 7-62A
Req. 1
Millions
Cost of plant assets ……………………………..
$5,631
Less: Accumulated depreciation ……………
(2,124)
Book value, net …………………………………….
$3,507
Req. 2
Evidences of the purchase of plant assets and goodwill:
1. Property, plant, and equipment increased on the balance sheet.
Req. 3
Property, Plant, and Equipment
Accumulated Depreciation
2/28/13 Bal.
4,997
Cost of
Accum. depr.
2/28/13 Bal.
1,729
Purchased
assets sold
of assets sold
Depr. during
during 2014
913
in 2014
279
in 2014
165
2014
560
2/28/14 Bal.
5,631
2/28/14 Bal.
2,124
Goodwill
2/28/13 Bal.
612
Purchased
during 2014
43*
2/28/14 Bal.
655
_____
*Determined by deduction, since there was no loss on goodwill.
Req. 4
2014
Cash ……………………………………………….
125
Accumulated Depreciation ……………….
Gain on Sale of Equipment ………….
Property, Plant & Equipment ……….
165
11
279
(20-30 min.) P 7-63A
Req. 1
Journal
DATE
ACCOUNT TITLES
DEBIT
CREDIT
Iron Ore …………………………………………………
2,550,000
Cash …………………………………………………
2,550,000
Iron Ore …………………………………………………
63,000
Cash …………………………………………………
63,000
Iron Ore …………………………………………………
71,000
Cash …………………………………………………
71,000
Iron Ore …………………………………………………
34,100
Note Payable ……………………………………..
34,100
Iron Ore Inventory ………………………………….
620,330*
Iron Ore ……………………………………………
620,330
Accounts Receivable (37,000 × $33) ………..
1,221,000
Sales Revenue …………………………………..
1,221,000
Cost of Iron Ore Sold (37,000 × $13.94) ……
515,780
Iron Ore Inventory ……………………………..
515,780
Operating Expenses ……………………………….
327,000
Cash …………………………………………………
327,000
Income Tax Expense (see Req. 2) ……………
105,902
Income Tax Payable …………………………..
105,902
*$2,550,000 + $63,000 +$71,000 + $34,100 = $2,718,100;
$2,718,100 / 195,000 = $13.94 x 44,500 = $620,330
(continued) P 7-63A
Req. 2
Mid Pacific Energy Company
Income Statement — Iron Ore Operations
Year 1
Sales revenue ………………………………………
$1,221,000
Cost of iron ore sold …………………………….
$515,780
Other operating expenses …………………….
327,000
842,780
Income before tax ………………………………..
378,220
Income tax expense (28%) ……………………
105,902
Net income ………………………………………….
$ 272,318
Req. 3
Iron ore inventory ($620,330 − $515,780) ……………………
$ 104,550
Iron ore ($2,718,100 − $620,330) ………………………………..
2,097,770
Accounts receivable ………………………………………………..
1,221,000
Income taxes payable …………………………..………………….
105,902
Note payable …………………………………………………………..
34,100
(30-40 min.) P 7-64A
Req. 1
To determine the gain or loss on the sale of a plant asset, compare the
cash received to the asset’s book value, as follows:
Billions
Cash received from sale of asset …………………………
$ 0.9
Book value of asset sold:
Cost ………………………………………………………………
$ 1.8
Less: Accumulated depreciation ……………………..
(1.2)
(0.6)
Gain (Loss) on sale ……………………………………………..
$ 0.3
Req. 2
Balance sheet at December 31, 2014:
Property, plant, and equipment ($4.1 + $1.7 − $1.8) ………………
$ 4.0
Less: Accumulated depreciation ($2.9 + $1.5 − $1.2) …………….
(3.2)
Property, plant, and equipment, net (book value) …………………
$ 0.8
Req. 3
Statement of cash flows for 2014:
Cash flows from operating activities:
Net income ($26.6 − $21.7) ………………………………………………
$ 4.9
Reconciliation of net income to
net cash provided by operations:
Depreciation ……………………………………………………….…..
1.5
Cash flows from investing activities:
Purchases of property, plant, and equipment ……………………….
(1.7)
Sales of property, plant, and equipment ……………………………….
0.9
(20-30 min.) P 7-65A
Req. 1
Feb. 2, 2013 Jan. 28, 2012
Net income
$ 2,999
$2,929
÷ Net revenue
÷ $73,301
÷ $69,865
= Net profit
margin ratio
= 4.09%
= 4.19%
Req. 2
Feb. 2, 2013 Jan. 28, 2012
Sales
$73,301
$69,865
÷ Average total assets
÷ $47,397
÷ $45,168
= Asset turnover
= 1.55
= 1.55
Req. 3
Feb. 2, 2013 Jan. 28, 2012
Net income
$ 2,999
$2,929
÷ Average total assets
÷ $47,397
÷ $45,168
= Return on assets
= 6.33%
= 6.48%
Req. 4
The following contributed to the decrease in ROA during the most
recent year.
(20-30 min.) P 7-66A
Req. 1
(amounts in millions)
Property & Equipment
Accumulated Depreciation
12/31/13 Bal.
22,011
X =
Cost of
Accum. depr.
= X
12/31/13 Bal.
12,087
Purchased
assets sold
of assets sold
Depr. during
during 2014
2,510
in 2014
in 2014
2014
1,546
12/31/14 Bal.
24,073
12/31/14 Bal.
13,306
X = $448, cost of P & Eq. sold
X = $327, accumulated depreciation on
P & Eq. sold
Req. 2
Cost
$448
– Acc. Depr.
–327
= Book value of assets sold
$121
Sales price
$ 48
Book value
121
= Loss on sale
$ 73
There is a loss because the sales price (proceeds) is less than the book
value.
(continued) P 7-66A
Req. 3
Cash ………………………………………………………………………………
48
Accumulated Depreciation – Prop. & Equipment ……………….
327
Loss on the Sale of Prop. & Equipment …………………………….
73
Property & Equipment …………………………………………………
448
Assets decrease, liabilities unaffected, and stockholders’ equity
decreases; revenues unaffected, expenses (losses) increase, and net
income decreases.
The total book value of $121 ($448 − $327) is $73 more than the sales
price of $48. This is the same calculation as in Req. 2.
Req. 4
Property & Equipment, net
12/31/13 Bal.
9,924
121
Book value, assets sold
Purchases
2,510
1,546
Depreciation
12/31/14 Bal.
10,767
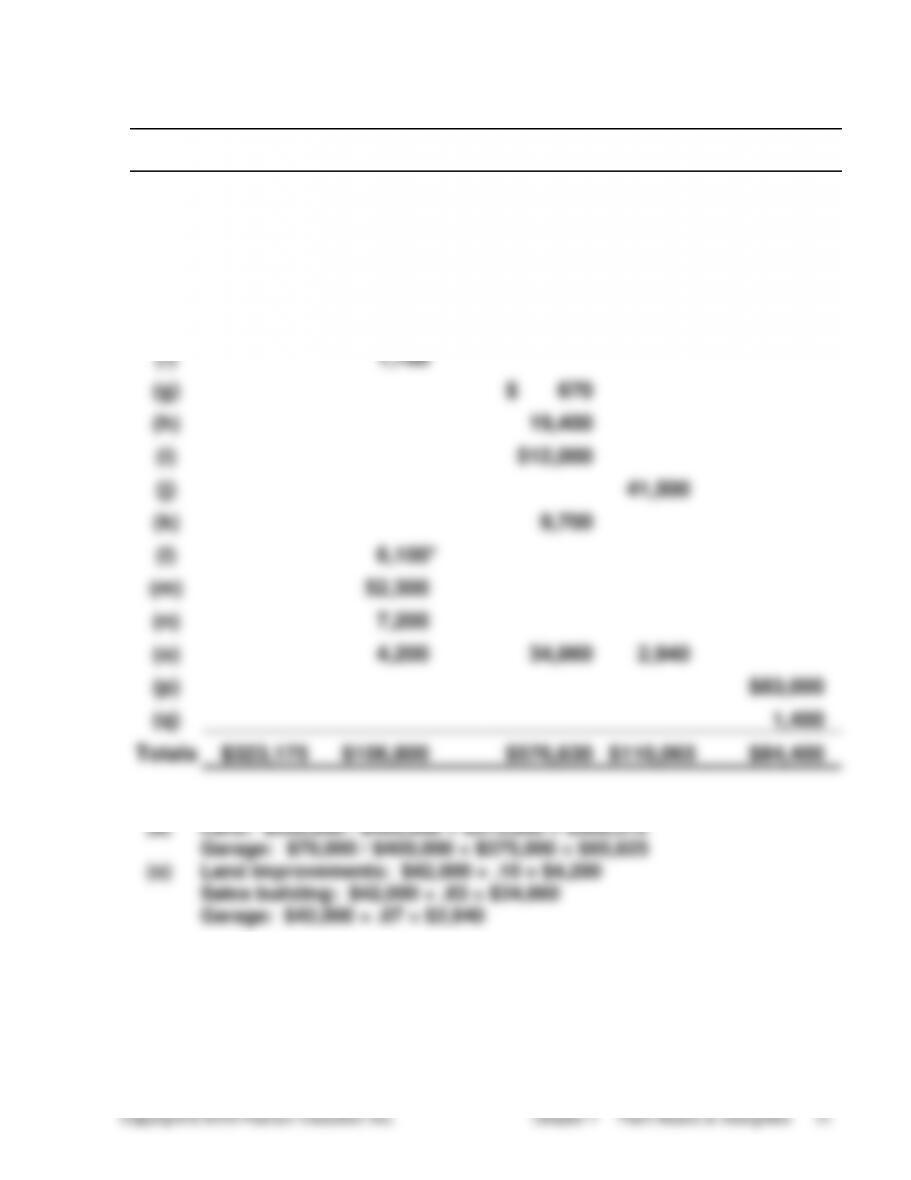
(20-30 min.) P 7-67B
Req. 1
ITEM
LAND
LAND
IMPROVEMENTS
SALES
BUILDING
GARAGE
FURNITURE
(a)
$309,375
$ 65,625
(b)
8,000
(c)
$ 35,300
(d)
600
(e)
5,200
(f)
1,700
(g)
$ 670
(h)
19,400
(i)
512,000
(j)
41,500
(k)
9,700
(l)
6,100*
(m)
52,300
(n)
7,200
(o)
4,200
34,860
2,940
(p)
$83,000
(q)
1,400
Totals
$323,175
$106,800
$576,630
$110,065
$84,400
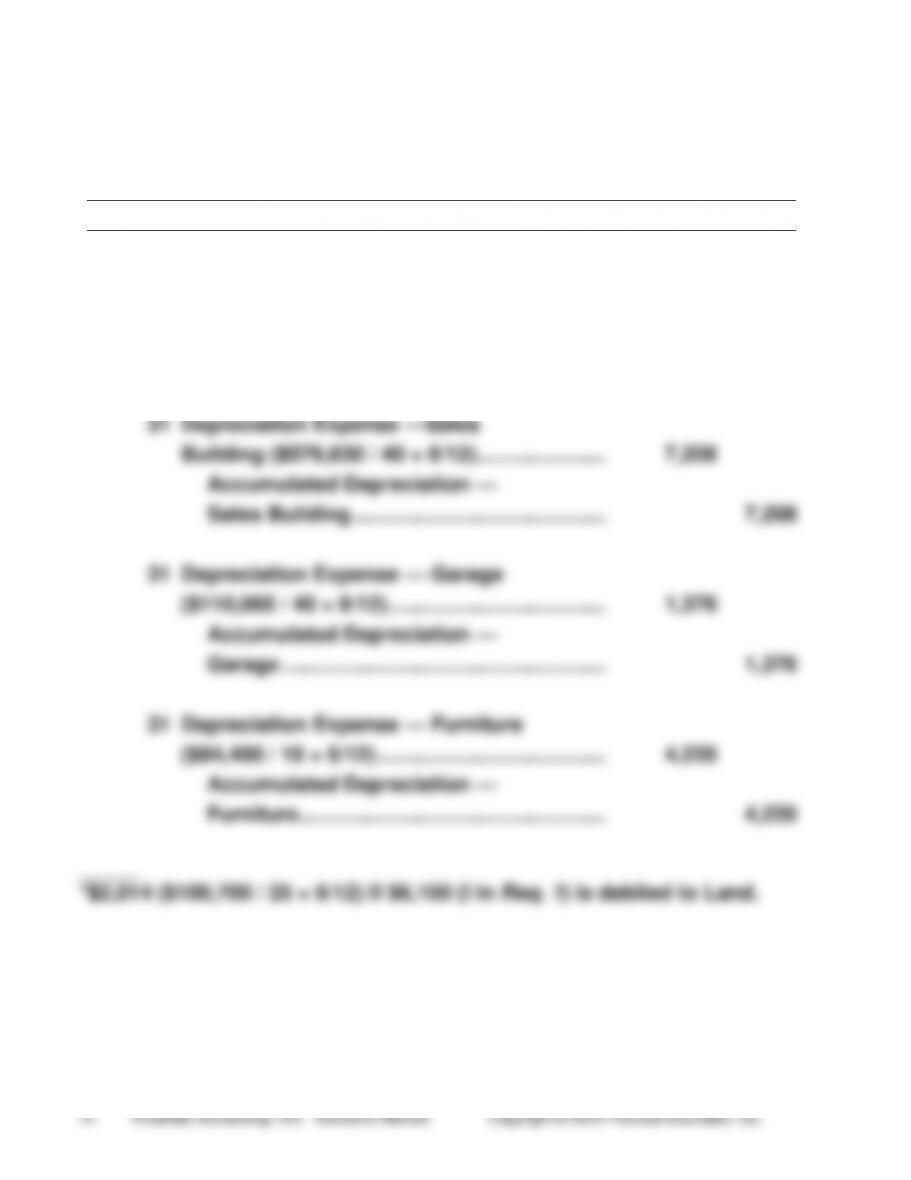
Computations:
_____
*Some accountants would debit this cost to the Land account.
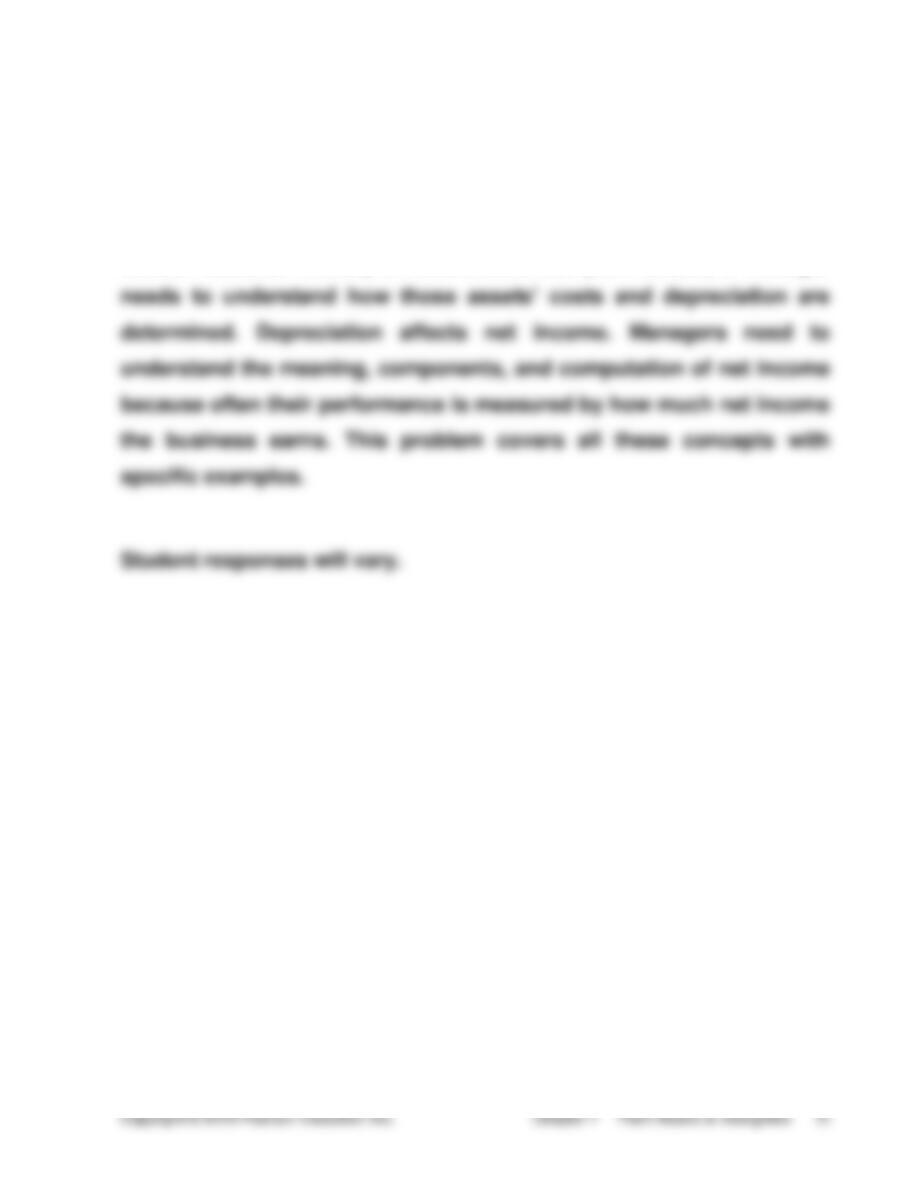
(continued) P 7-67B
Req. 2
Journal
DATE
ACCOUNT TITLES
DEBIT
CREDIT
Dec.
31
Depreciation Expense — Land
Improvements ($106,800 / 25 × 6/12) …………
2,136*
Accumulated Depreciation —
Land Improvements …………………………….
2,136
31
Depreciation Expense —Sales
Building ($576,630 / 40 × 6/12) ………………….
7,208
Accumulated Depreciation —
Sales Building …………………………………….
7,208
31
Depreciation Expense — Garage
($110,065 / 40 × 6/12) ……………………………….
1,376
Accumulated Depreciation —
Garage ……………………………………………….
1,376
31
Depreciation Expense — Furniture
($84,400 / 10 × 6/12) …………………………………
4,220
Accumulated Depreciation —
Furniture …………………………………………….
4,220
_____
*$2,014 ($100,700 / 25 × 6/12) if $6,100 (l in Req. 1) is debited to Land.
(continued) P 7-67B
Req. 3
This problem shows how to determine the cost of a plant asset. It also
demonstrates the computation of depreciation for a variety of plant
assets. Because virtually all businesses use plant assets, a manager
(15 min.) P7–68B
Req. 1
Journal
ACCOUNT TITLES
DEBIT
CREDIT
Equipment …………………………………………………………..
135,000
Cash ……………………………………………………………….
135,000
Depreciation Expense — Buildings ………………………
32,800*
Accumulated Depreciation — Buildings ……………
32,800
Depreciation Expense — Equipment …………………….
42,700**
Accumulated Depreciation — Equipment ………….
42,700
*($741,000 − $85,000) / 20 = $32,800]
**[($410,000 − $264,000) × 2/10] + ($135,000 × 2/10 × 6/12) = $42,700]
Req. 2
BALANCE SHEET
Property, plant, and equipment:
Land ………………………………………………………..
$ 156,000
Buildings …………………………………………………
$741,000
Less: Accumulated Depreciation
($344,000 + $32,800) ………………………..
(376,800)
364,200
Equipment ($410,000 + $135,000) ………………
$545,000
Less: Accumulated Depreciation
($264,000 + $42,700) ………………………..
(306,700)
238,300
Total property, plant, and equipment ……………..
$758,500
(25-35 min.) P 7-69B
Journal
DATE
ACCOUNT TITLES
DEBIT
CREDIT
Jan.
4
Equipment (new) …………………………………………
175,000
Accumulated Depreciation —
Equipment ………………………………………………….
64,000
Equipment (old) ………………………………………
134,000
Cash ………………………………………………………
103,000
Gain on Trade-in of Equipment ………………..
2,000
[$72,000 − ($134,000 − $64,000)]
June
29
Depreciation Expense — Building
[($650,000 − $220,000) / 40 × 6/12] ………………..
5,375
Accumulated Depreciation —
Building ………………………………………………….
5,375
29
Cash ………………………………………………………….
125,000
Note Receivable ………………………………………….
379,625
Accumulated Depreciation —
Building ($140,000 + $5,375) ………………………..
145,375
Building ………………………………………………….
650,000
Oct.
30
Land [$160,800 / ($160,800 + $241,200) × $360,000] …
144,000
Building
[$241,200 / ($160,800 + $241,200) × $360,000] …….
216,000
Cash ………………………………………………………
360,000
Dec.
31
Depreciation Expense —
Equipment ($175,000 × 2/8) ………………………….
43,750
Accumulated Depreciation —
Equipment ……………………………………………..
43,750
31
Depreciation Expense — Buildings
[($216,000 − (30% × $216,000)) / 40 × 2/12] …….
630
Accumulated Depreciation —
Buildings …………………………..……………………
630
(30-40 min.) P 7-70B
Req. 1
Straight-Line Depreciation Schedule
Depreciation for the Year
DATE
ASSET
COST
DEPRECIATION
RATE
DEPRECIABLE
COST =
DEPRECIATION
EXPENSE
ACCUMULATED
DEPRECIATION
ASSET BOOK
VALUE
1-07-2014
$277,000
$277,000
12–31–2014
1/5
$252,000
$50,400
$ 50,400
226,600
12–31–2015
1/5
252,000
50,400
100,800
176,200
12–31–2016
1/5
252,000
50,400
151,200
125,800
12–31–2017
1/5
252,000
50,400
201,600
75,400
12–31–2018
1/5
252,000
50,400
252,000
25,000
Asset cost: $240,000 + $1,400 + $6,500 + $29,100 = $277,000
Depreciation for each year: ($277,000 − $25,000) / 5 years = $50,400
(continued) P 7-70B
Req. 1
Units-of-Production Depreciation Schedule
Depreciation for the Year
DATE
ASSET
COST
DEPRECIATION
PER DOCUMENT
NUMBER OF
DOCUMENTS =
DEPRECIATION
EXPENSE
ACCUMULATED
DEPRECIATION
ASSET BOOK
VALUE
1-07-2014
$277,000
$277,000
12–31–2014
$1.12
50,000
$56,000
$ 56,000
221,000
12–31–2015
1.12
47,500
53,200
109,200
167,800
12–31–2016
1.12
45,000
50,400
159,600
117,400
12–31–2017
1.12
42,500
47,600
207,200
69,800
12–31–2018
1.12
40,000
44,800
252,000
25,000
Total documents
225,000
(continued) P 7-70B
Req. 1
Double-Declining-Balance Depreciation Schedule
Depreciation for the Year
DATE
ASSET
COST
DDB RATE
ASSET BOOK
VALUE =
DEPRECIATION
EXPENSE
ACCUMULATED
DEPRECIATION
ASSET BOOK
VALUE
1-07-2014
$277,000
$277,000
12–31–2014
.40*
$277,000
$110,800
$ 110,800
166,200
12–31–2015
.40
166,200
66,480
177,280
99,720
12–31–2016
.40
99,720
39,888
217,168
59,832
12–31–2017
.40
59,832
23,933
241,101
35,899
12–31–2018
35,899
10,899**
252,000
25,000
* DDB rate: (1/5 years × 2) = 2/5 = .40
** Depreciation for 2018: $35,899 − $25,000 = $10,899