(20-30 min.) E 13-62
ORDER OF
COMPUTATION
Millions
5
Sales ($1,700 ÷ 0.25) …………………………………………
$6,800
6
Operating expenses ($6,800 − $1,700) ……………….
5,100
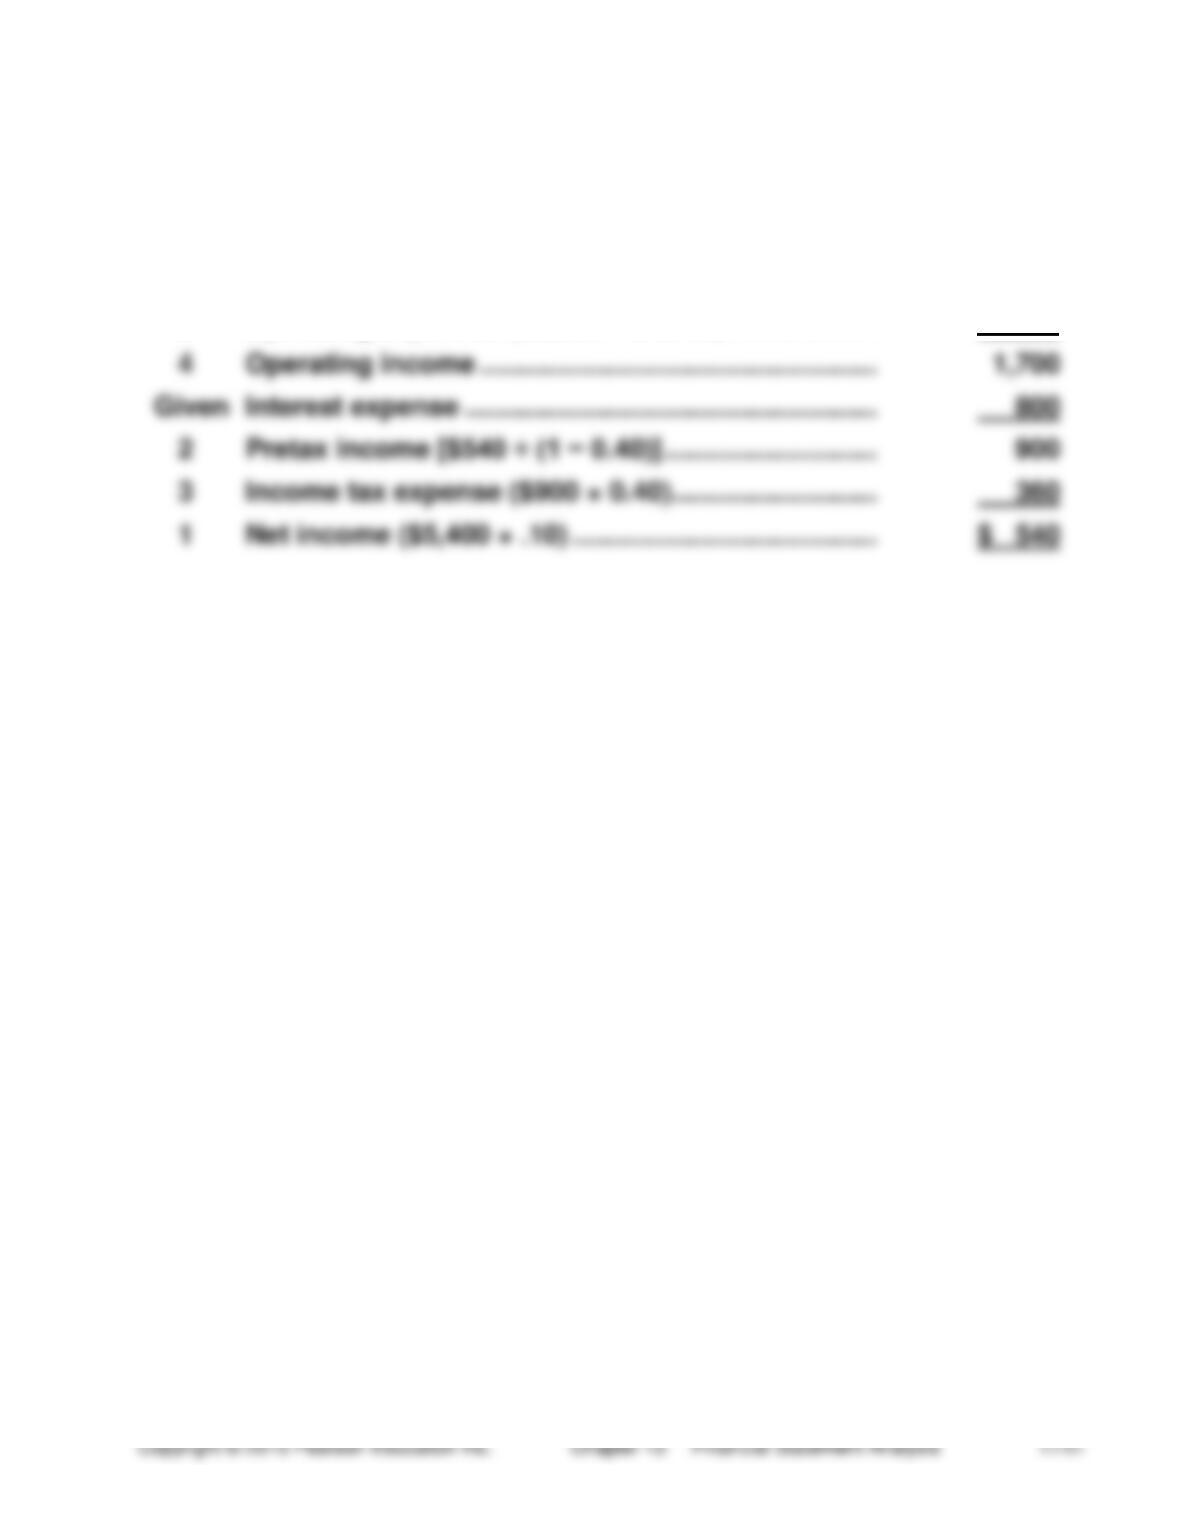
4
Operating income …………………………………………….
1,700
Given
Interest expense ………………………………………………
800
2
Pretax income [$540 ÷ (1 − 0.40)] ……………………….
900
3
Income tax expense ($900 × 0.40) ………………………
360
1
Net income ($5,400 × .10) ………………………………….
$ 540
(30-40 min.) P 13–63
Amherst Corporation
Comparative Income Statements
Years Ended December 31, 2014 and 2013
2014 2013
Sales revenue ………………………………… $2,100,000
$2,000,000
Cost of goods sold (a) …………………….. 1,365,000
1,400,000
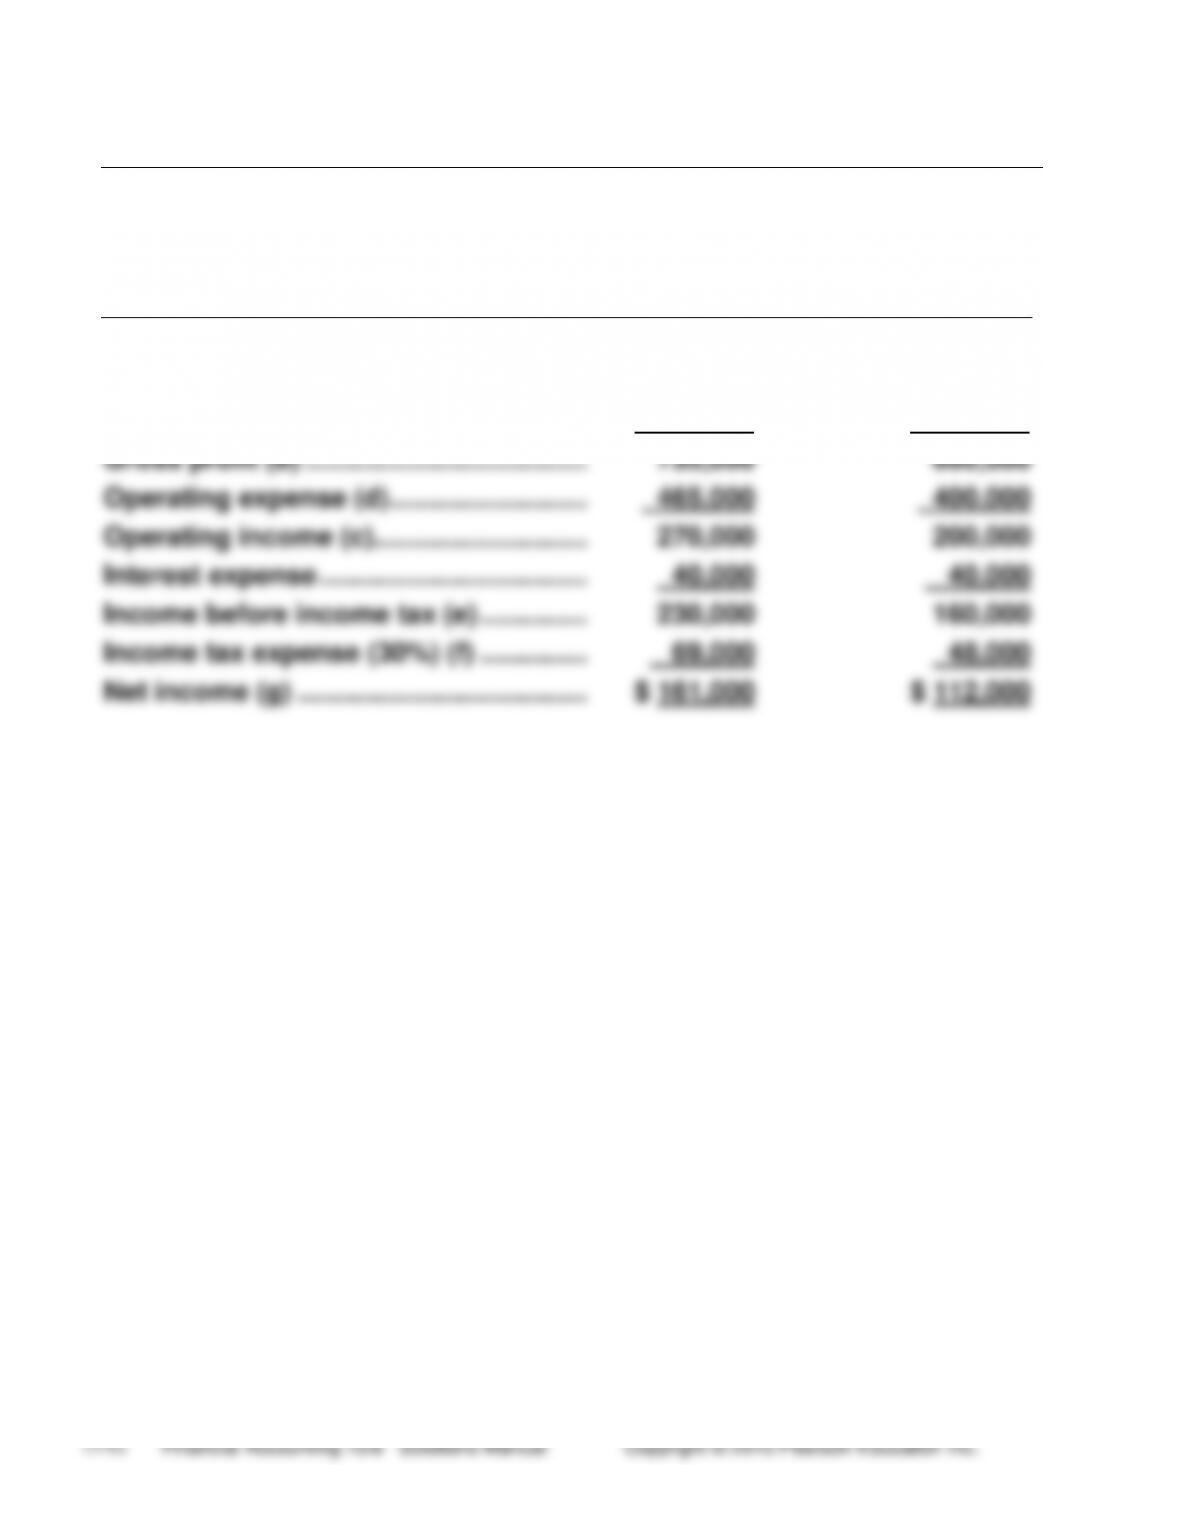
Gross profit (b) ………………………………. 735,000
600,000
Operating expense (d) …………………….. 465,000
400,000
Operating income (c)………………………. 270,000
200,000
Interest expense …………………………….. 40,000
40,000
Income before income tax (e) ………….. 230,000
160,000
Income tax expense (30%) (f) ………….. 69,000
48,000
Net income (g) ……………………………….. $ 161,000
$ 112,000
(continued) P 13-63
Amherst Corporation
Comparative Balance Sheets
December 31, 2014 and 2013
2014 2013
ASSETS
Current:
Cash (l) ……………………………………………. $ 35,000
$ 30,000
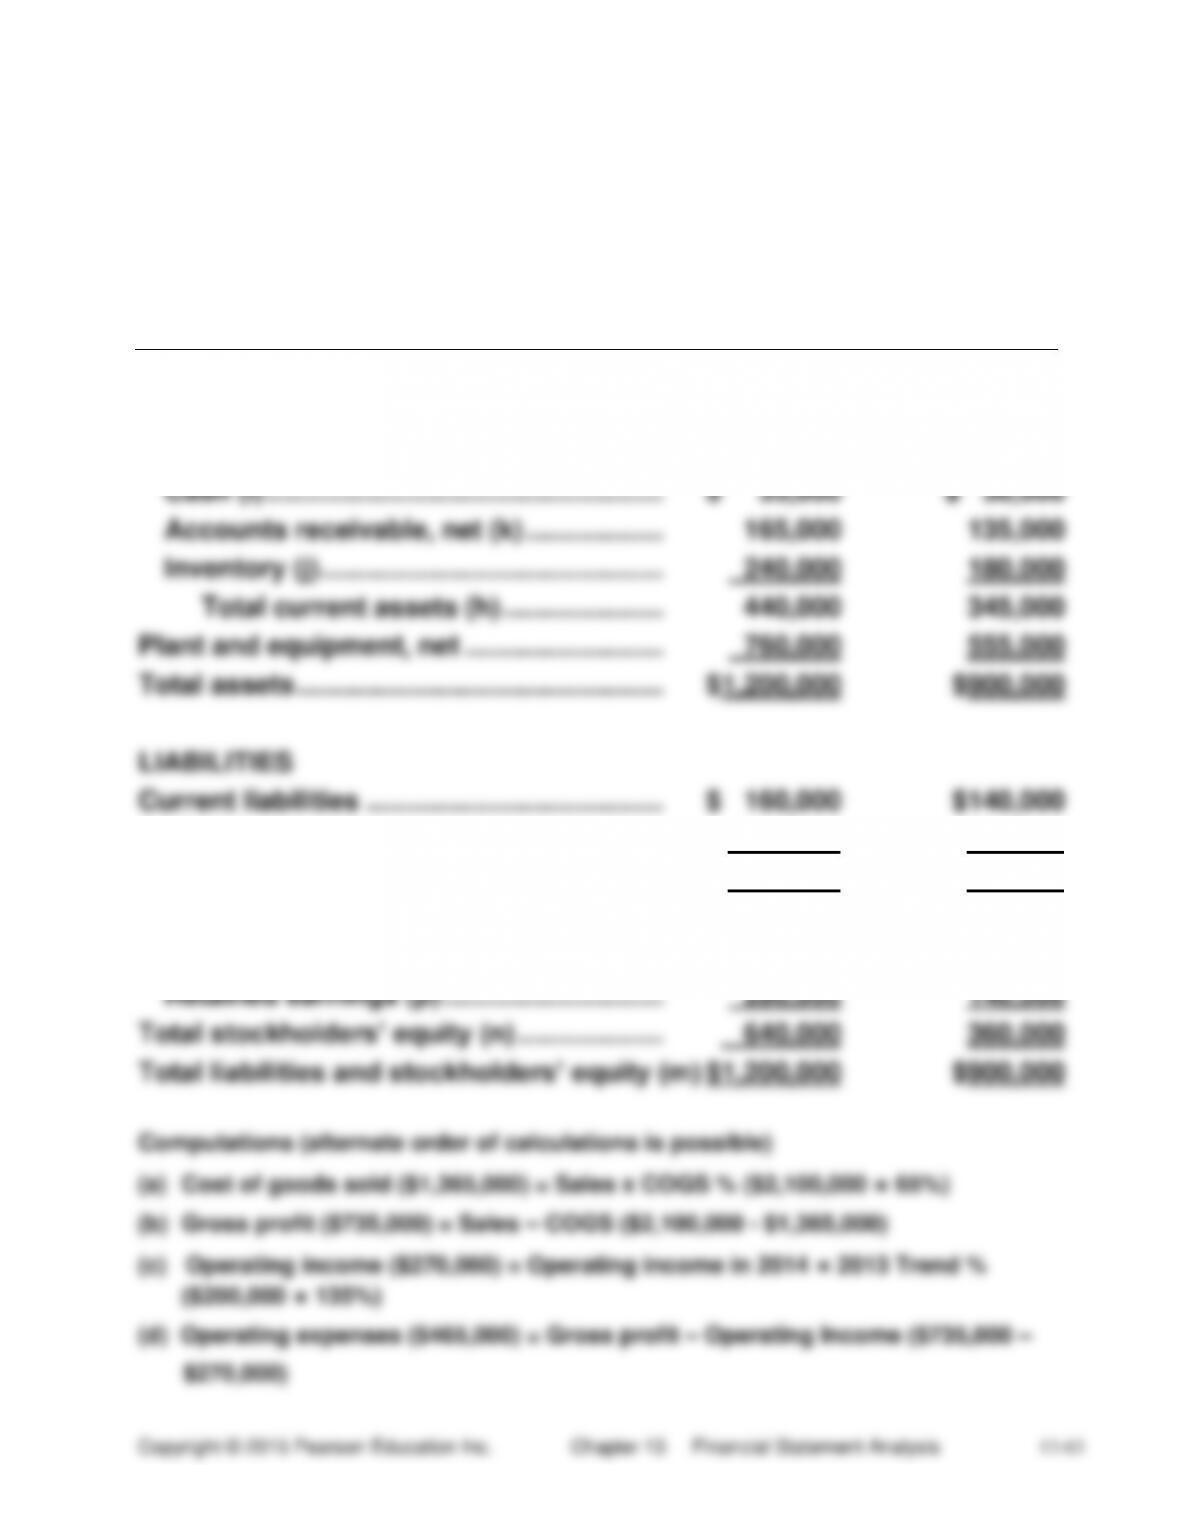
Accounts receivable, net (k) ……………… 165,000
135,000
Inventory (j) ……………………………………… 240,000
180,000
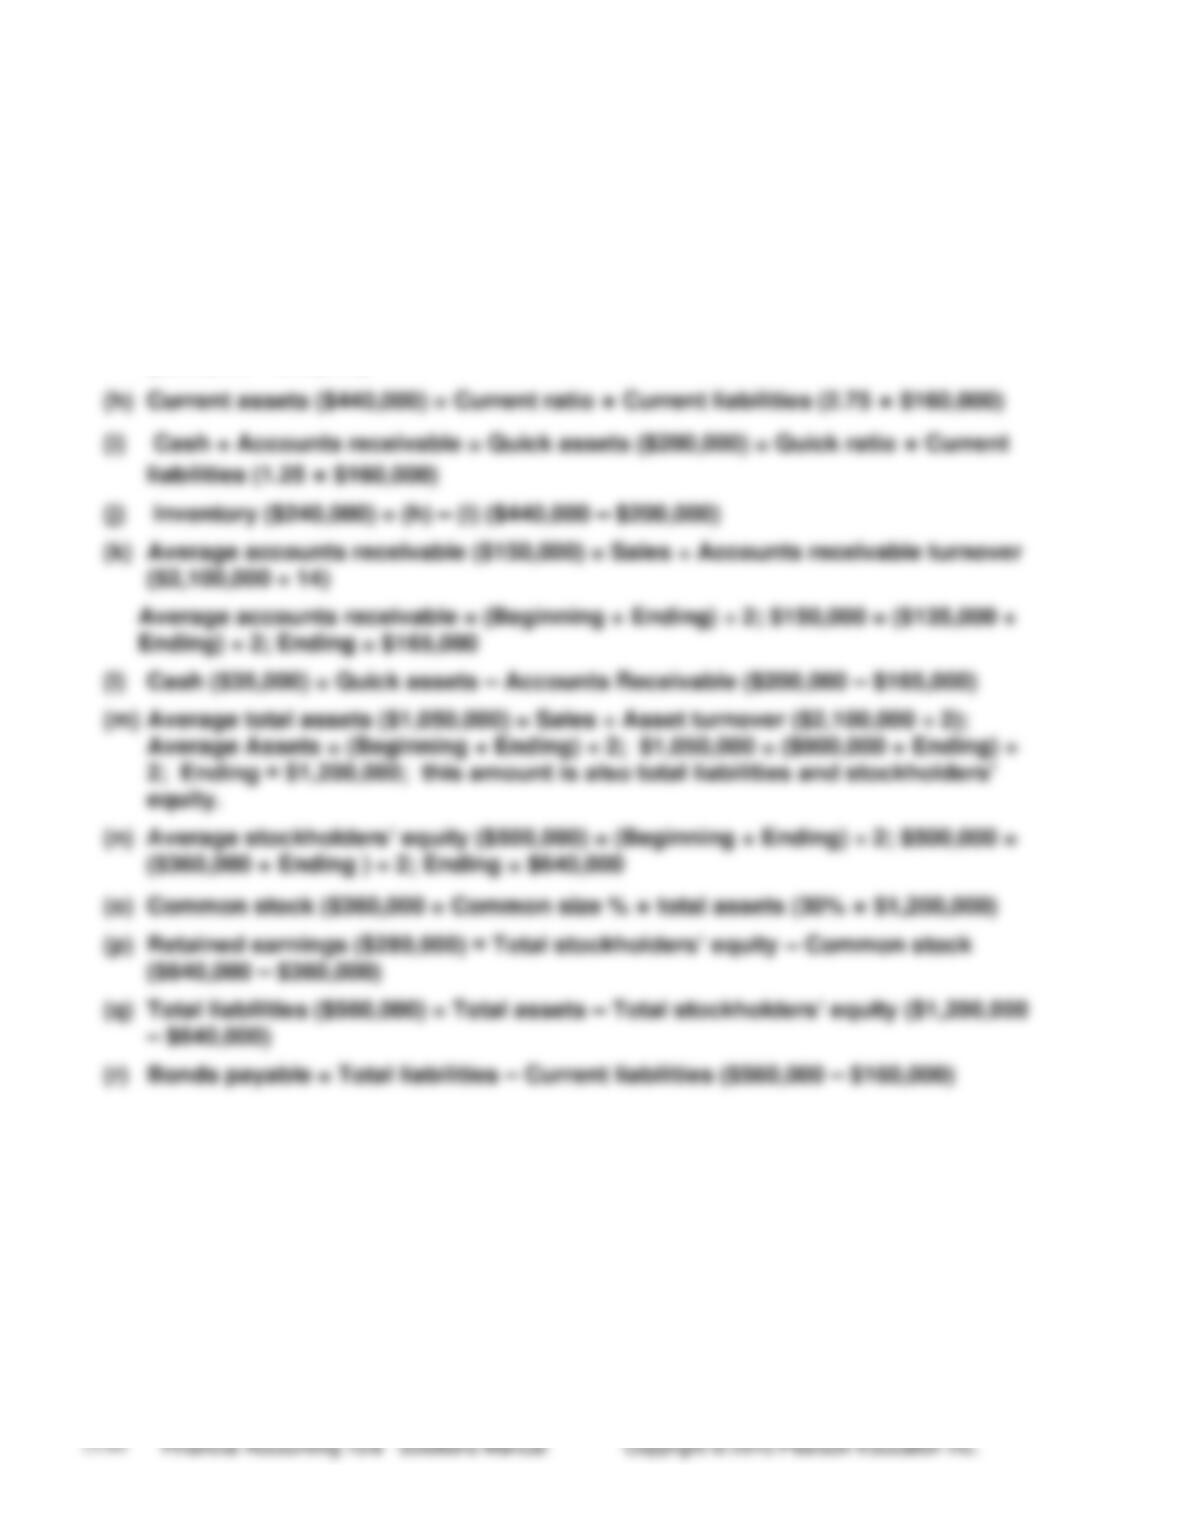
Total current assets (h) ………………… 440,000
345,000
Plant and equipment, net …………………….. 760,000
555,000
Total assets ………………………………………… $1,200,000
$900,000
LIABILITIES
Current liabilities ………………………………… $ 160,000
$140,000
10% Bonds payable (r) ………………………… 400,000
400,000
Total liabilities (q) ……………………………….. 560,000
540,000
STOCKHOLDERS’ EQUITY
Common stock, $5 par (o)…………………. 360,000
220,000
Retained earnings (p) ……………………….. 280,000
Total stockholders’ equity (n) ………………. 640,000
140,000
360,000
Total liabilities and stockholders’ equity (m) $1,200,000
$900,000
Computations (alternate order of calculations is possible)
(a) Cost of goods sold ($1,365,000) = Sales x COGS % ($2,100,000 × 65%)
(b) Gross profit ($735,000) = Sales – COGS ($2,100,000 – $1,365,000)
(c) Operating income ($270,000) = Operating income in 2014 × 2013 Trend %
($200,000 × 135%)
(d) Operating expenses ($465,000) = Gross profit – Operating Income ($735,000 –
$270,000)
(continued) P 13–63
(e) Income before income tax ($230,000) = Operating income – Interest expense
($270,000 – $40,000)
(f) Income tax expense ($69,000) = Income before income tax × tax rate ($230,000 ×
30%)
(g) Net income ($161,000) = Income before income tax – Income tax expense
($230,000 – $69,000)
Decision Cases
(30 min.) Decision Case 1
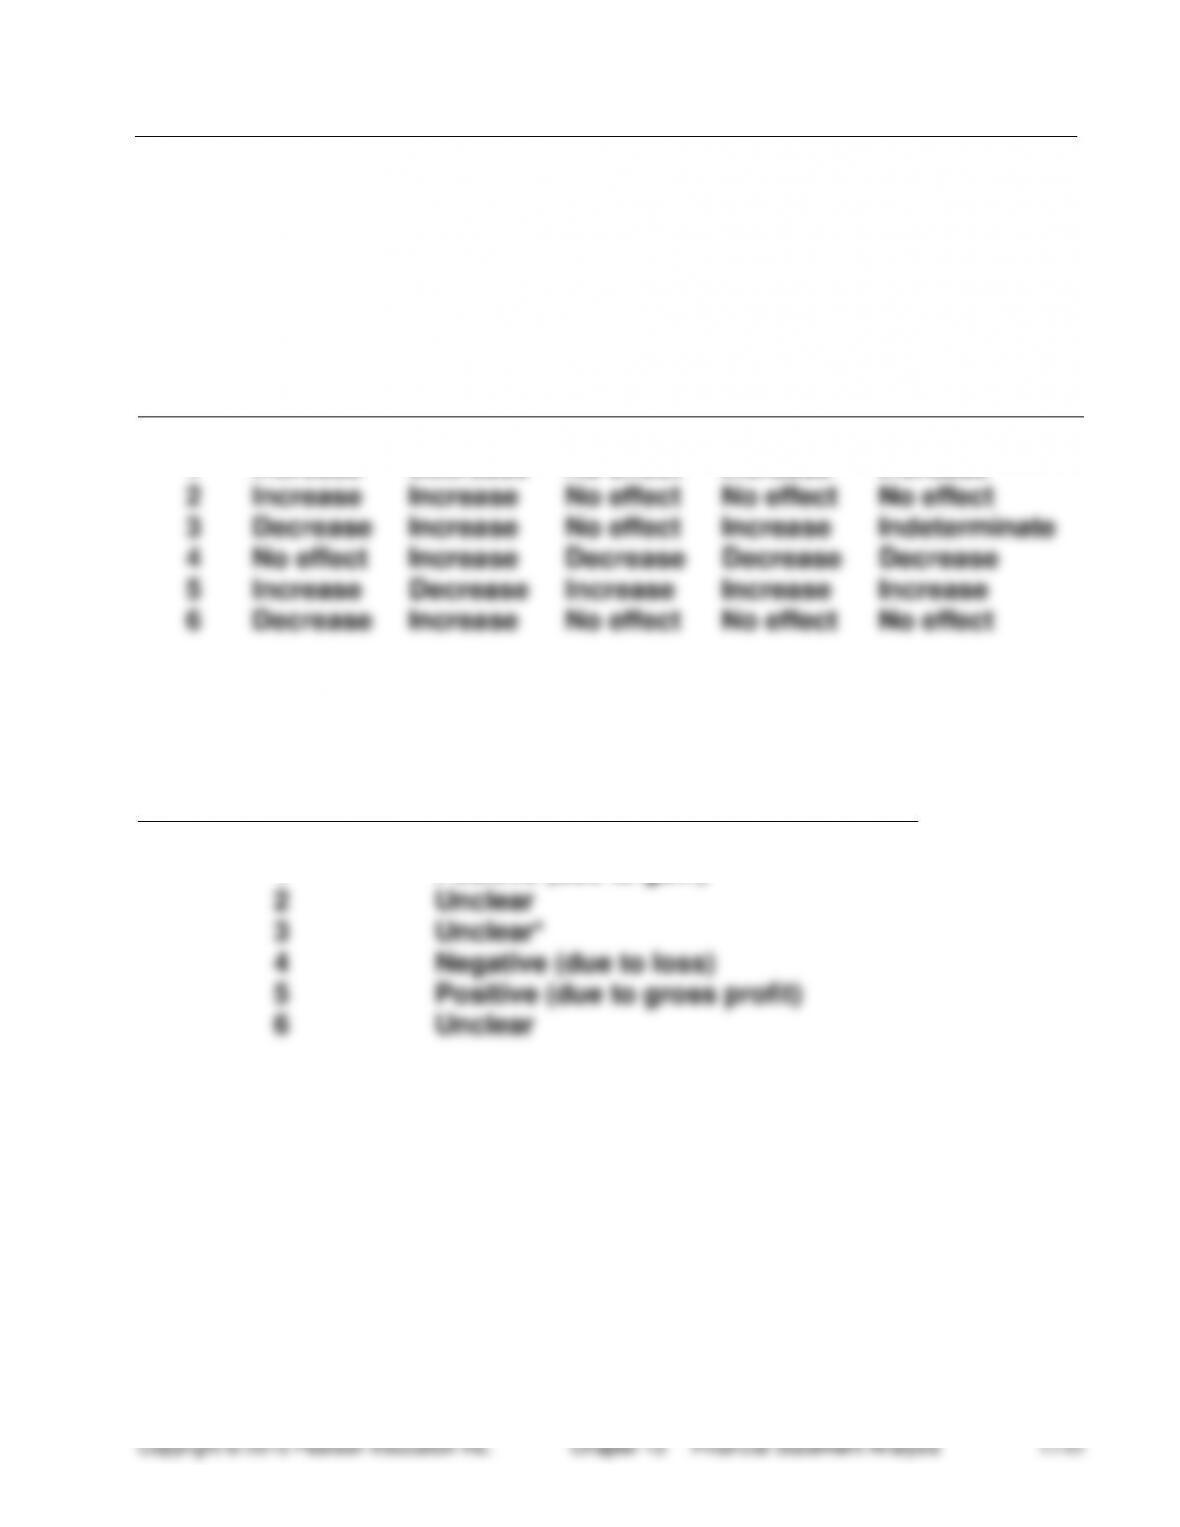
Req. 1
Trans-
action
Current
Ratio
Debt
Ratio
Times-
Interest-
Earned
Ratio
Return
on
Equity
Book
Value
Per Share
1
Increase
Decrease
No effect
Increase
Increase
2
Increase
Increase
No effect
No effect
No effect
3
Decrease
Increase
No effect
Increase
Indeterminate
4
No effect
Increase
Decrease
Decrease
Decrease
5
Increase
Decrease
Increase
Increase
Increase
6
Decrease
Increase
No effect
No effect
No effect
Req. 2
Transaction
Overall Effect on the Company
1
Positive (due to gain)
2
Unclear
3
Unclear*
4
Negative (due to loss)
5
Positive (due to gross profit)
6
Unclear
____
*May be negative because of decreasing assets to shrink the
company.
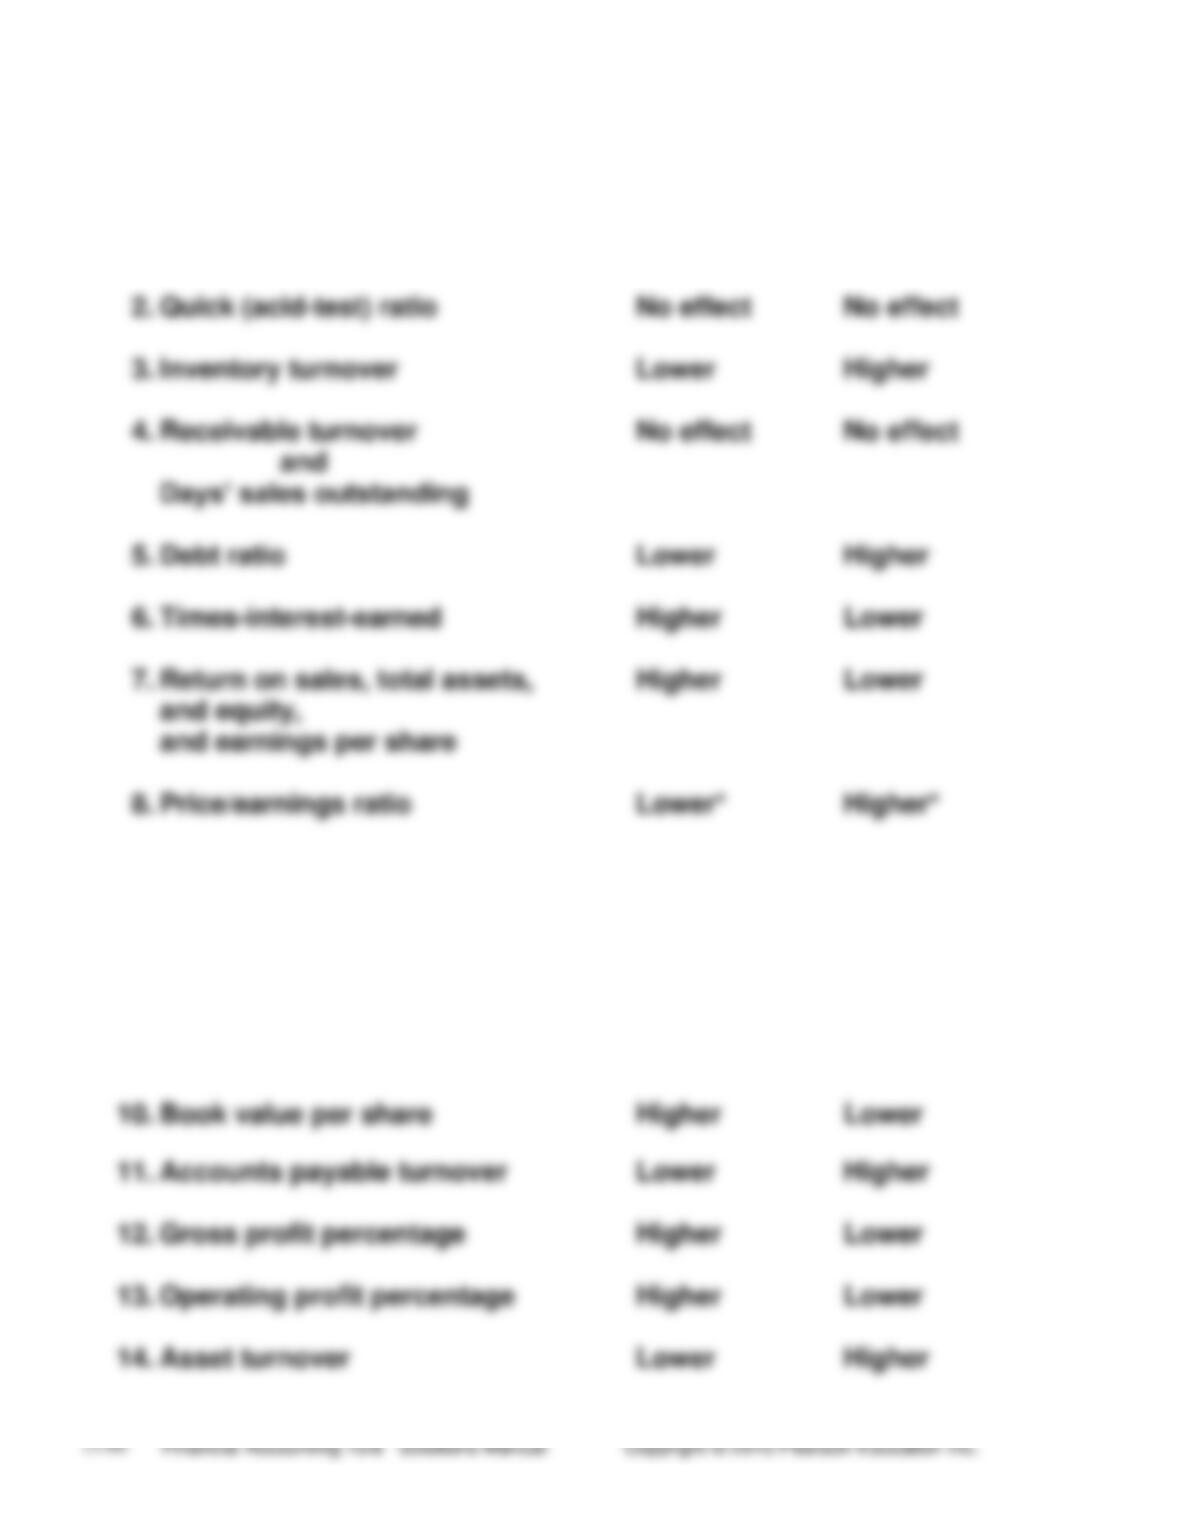
(20-30 min.) Decision Case 2
Ratio
CNH
Caterpillar
1.
Current ratio
Higher
Lower
2.
Quick (acid-test) ratio
No effect
No effect
3.
Inventory turnover
Lower
Higher
4.
Receivable turnover
No effect
No effect
and
Days’ sales outstanding
5.
Debt ratio
Lower
Higher
6.
Times-interest-earned
Higher
Lower
7.
Return on sales, total assets,
Higher
Lower
and equity,
and earnings per share
8.
Price/earnings ratio
Lower*
Higher*
_____
*Assuming stock price is unaffected by the accounting
difference. If stock price is affected, the price/earnings
ratio could be higher (lower) for either company.
9.
Dividend yield
No effect
No effect
10.
Book value per share
Higher
Lower
11.
Accounts payable turnover
Lower
Higher
12.
Gross profit percentage
Higher
Lower
13.
Operating profit percentage
Higher
Lower
14.
Asset turnover
Lower
Higher
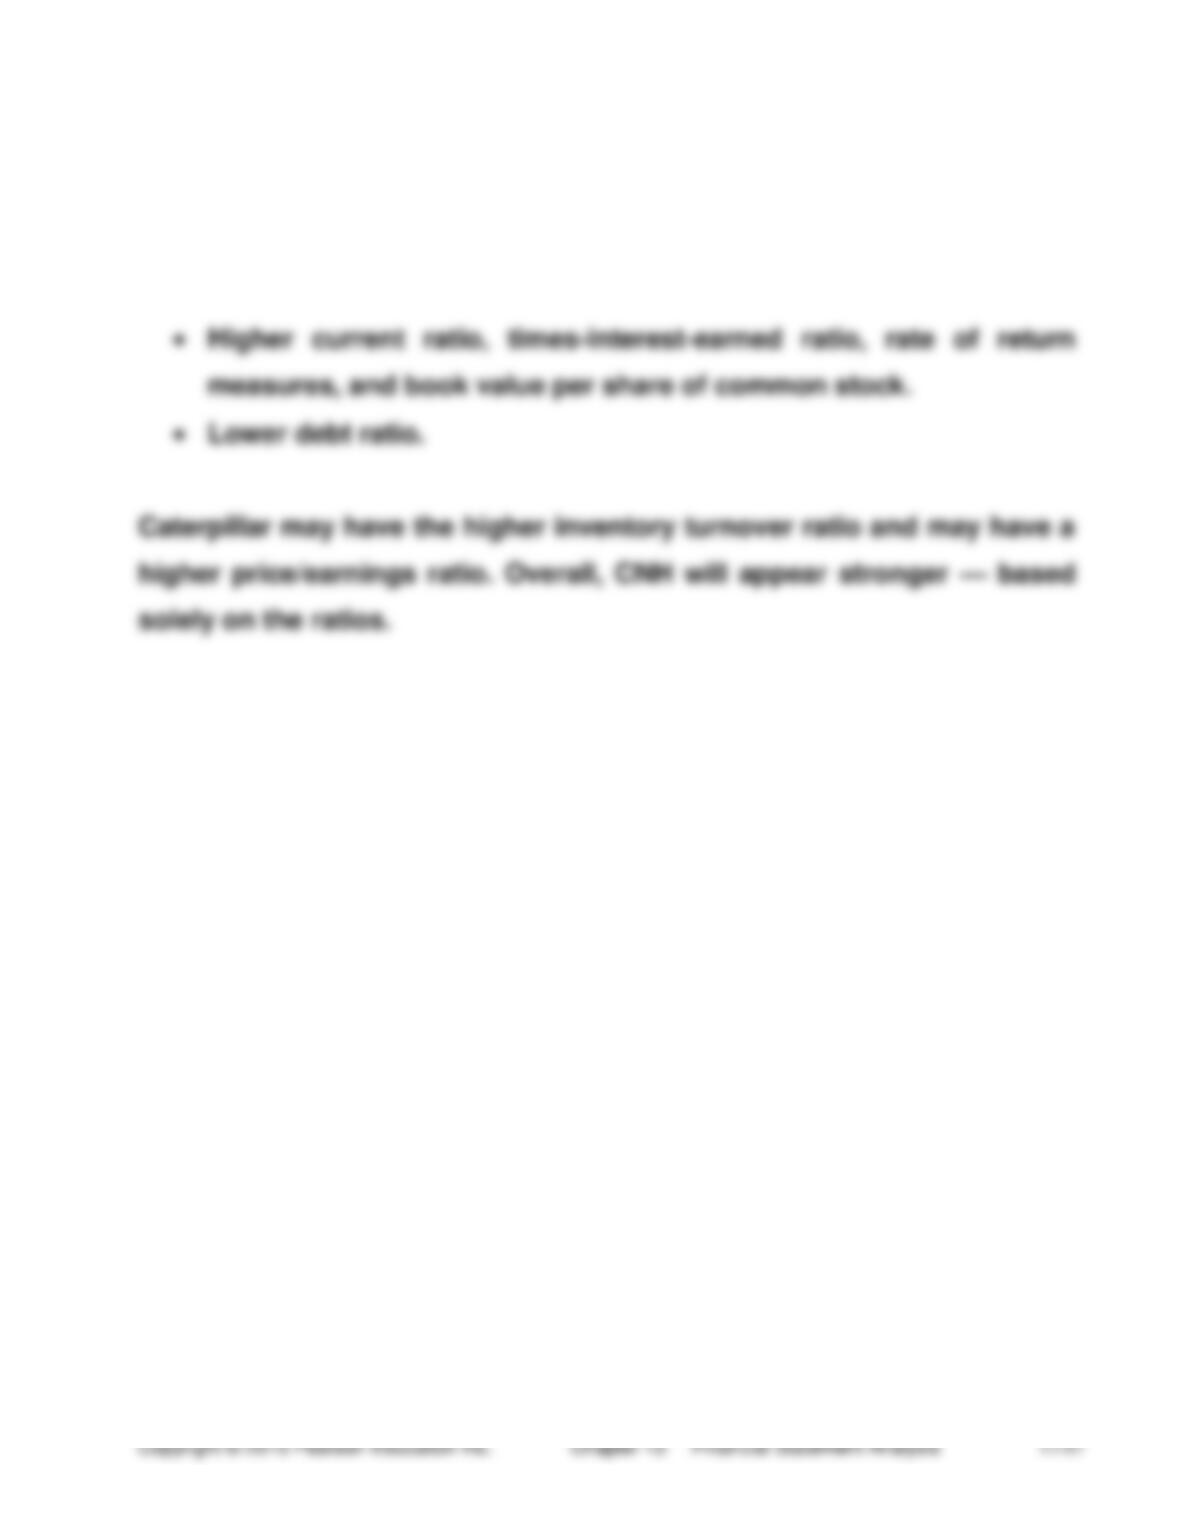
(continued) Decision Case 2
CONCLUSION:
Overall, CNH will look better than Caterpillar because of:
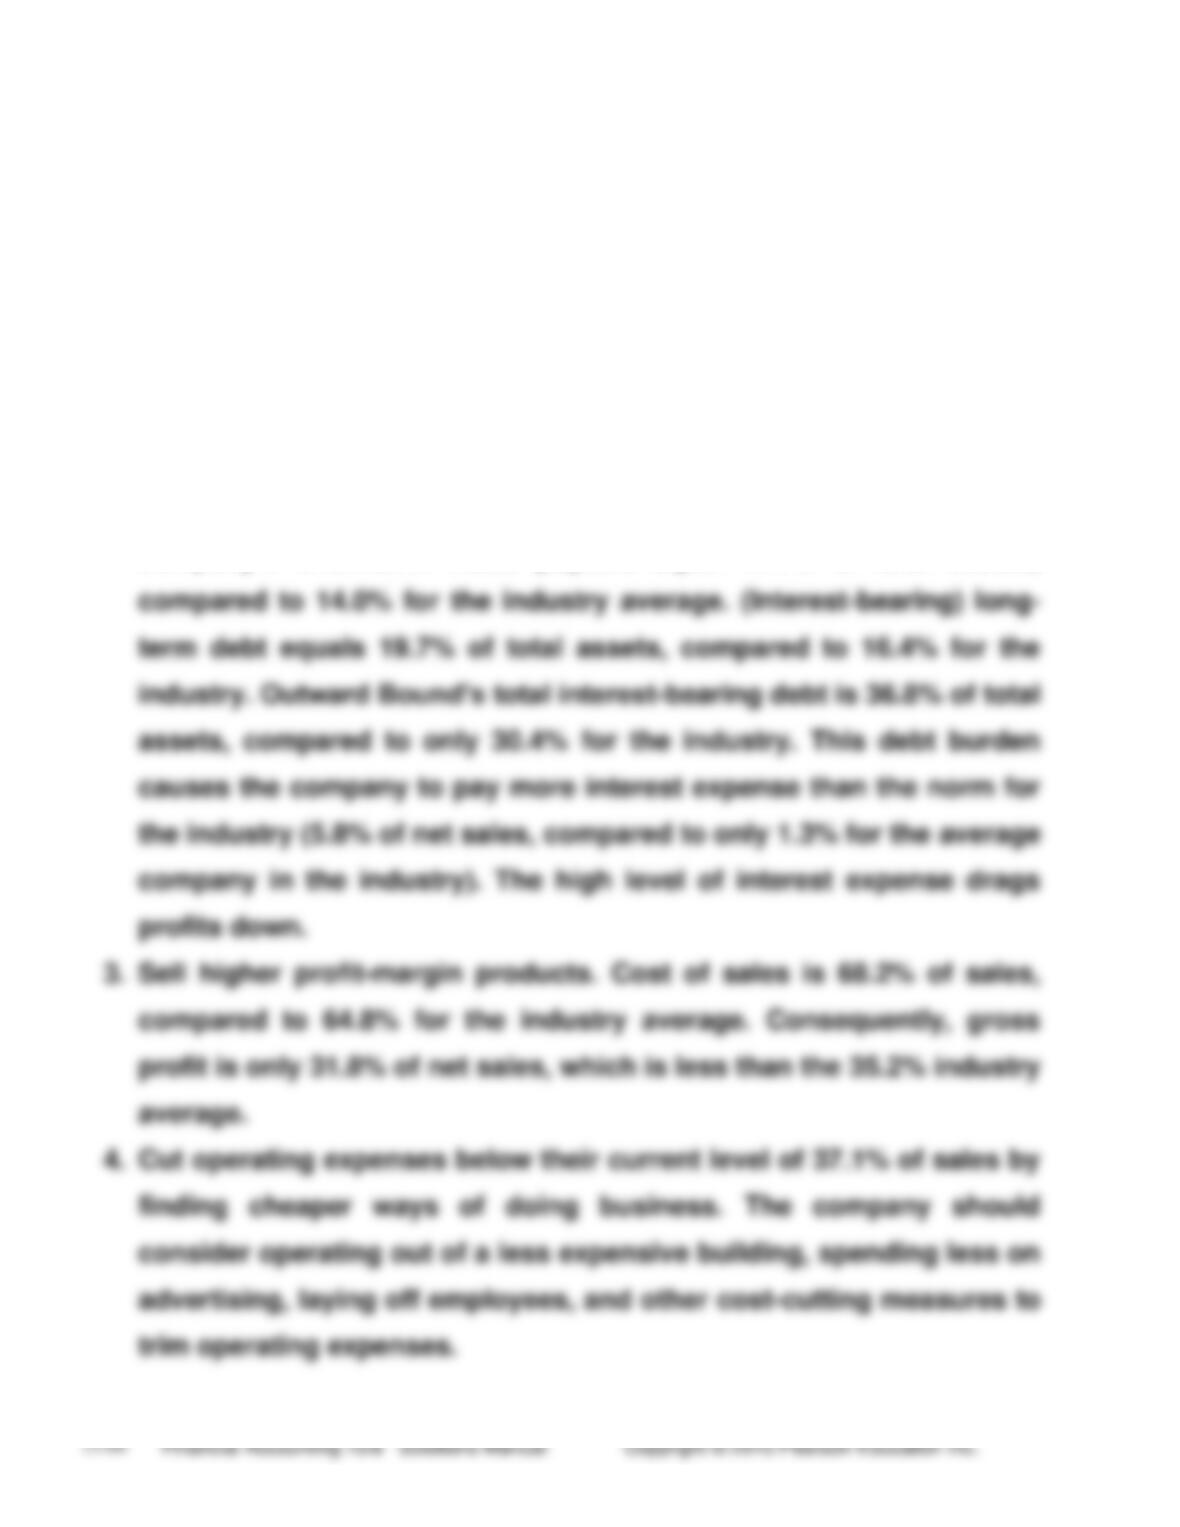
(20-30 min.) Decision Case 3
To reduce losses and establish profitable operations, Outward Bound
should take the following steps:
1. Make a dedicated effort to collect receivables and consider extending
less credit to customers. Receivables make up 15.2% of assets,
compared to 11.0% for the industry average. The company’s inability
to collect its receivables may explain the shortage of cash (3.0% of
total assets compared to 6.8% for the industry).
2. Reduce the amount of the company’s interest-bearing debt. The
company’s short-term notes payable equal 17.1% of total assets,
Ethical Issue
Req. 1
The ethical issue is: Should Turnberry reclassify its investments from
long-term to short-term?
Req. 2 and Req. 3
(continued) Ethical Issue
Ethical analysis: Reclassifying a long-term investment as current to
Req. 4.
Reclassifying the investments from current back to long-term may
suggest to some observers that managers are playing a shell game.
However, the case states that sales subsequent to the first
Focus on Financials: Amazon.com, Inc.
(1-2 hours)
Req. 1
1. Ability to pay current liabilities
Ratio
Computation
2012
2011
Interpretation
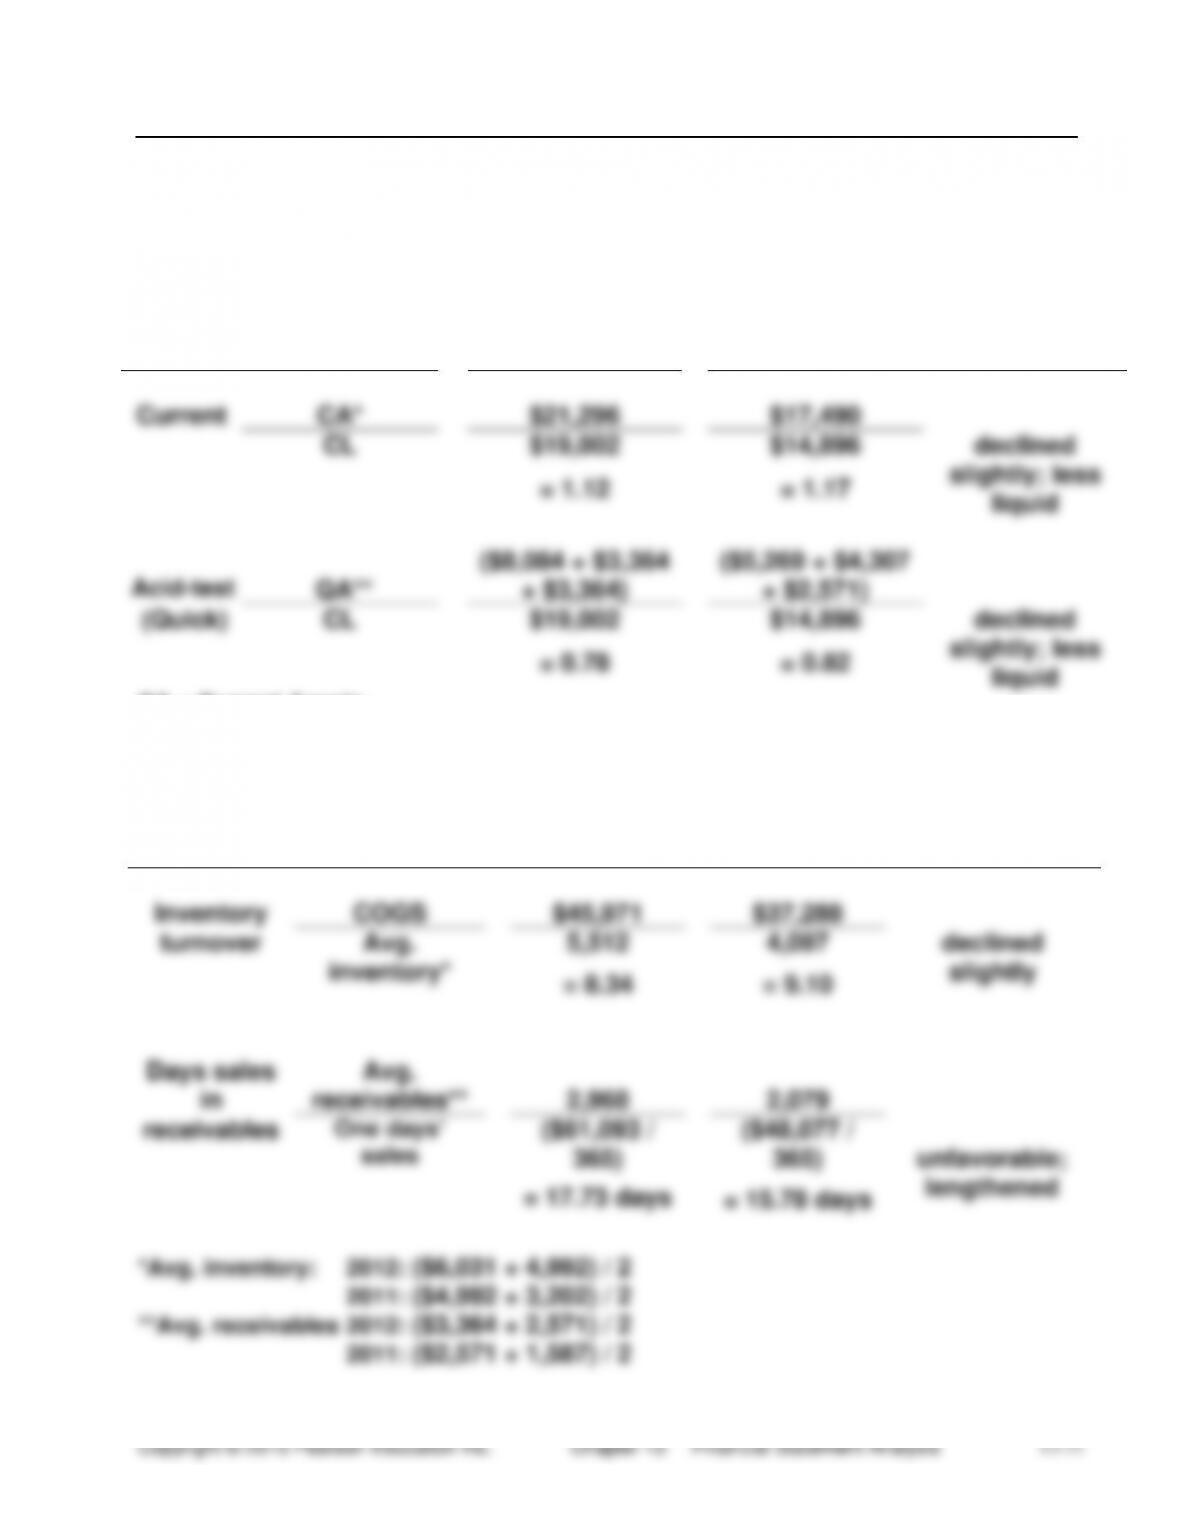
Current
CA*
$21,296
$17,490
CL
$19,002
$14,896
declined
= 1.12
= 1.17
slightly; less
liquid
Acid-test
QA**
($8,084 + $3,364
+ $3,364)
($5,269 + $4,307
+ $2,571)
(Quick)
CL
$19,002
$14,896
declined
= 0.78
= 0.82
slightly; less
liquid
CA = Current Assets
QA = Quick Assets (Cash and equivalents + Marketable securities + Receivables)
2. Ability to sell inventory and collect receivables
Ratio
Computation
2012
2011
Interpretation
Inventory
COGS
$45,971
$37,288
turnover
Avg.
5,512
4,097
declined
inventory*
= 8.34
= 9.10
slightly
Days sales
in
Avg.
receivables**
2,968
2,079
receivables
One days’
sales
($61,093 /
365)
($48,077 /
365)
unfavorable;
= 17.73 days
= 15.78 days
lengthened
*Avg. inventory: 2012: ($6,031 + 4,992) / 2
2011: ($4,992 + 3,202) / 2
**Avg. receivables 2012: ($3,364 + 2,571) / 2
2011: ($2,571 + 1,587) / 2
(continued) Amazon.com
3. Ability to pay long-term debt
Ratio
Computation
2012
2011
Interpretation
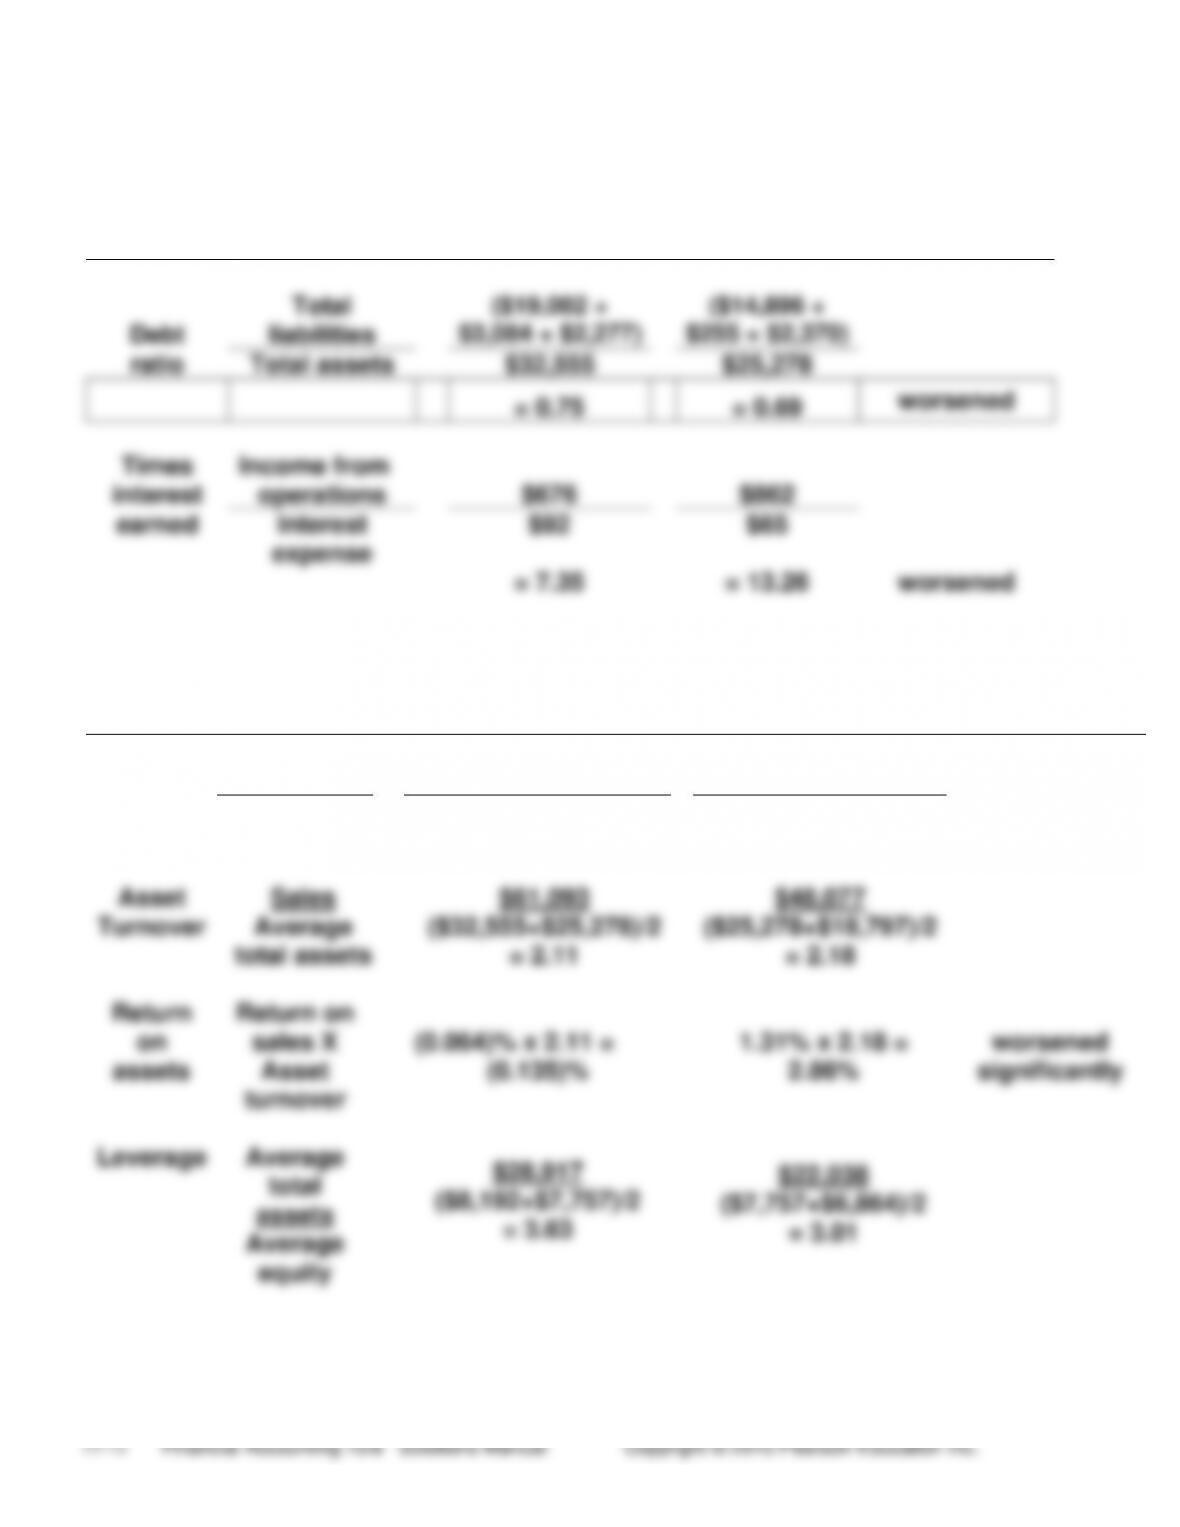
Debt
Total
liabilities
($19,002 +
$3,084 + $2,277)
($14,896 +
$255 + $2,370)
ratio
Total assets
$32,555
$25,278
= 0.75
= 0.69
worsened
Times
Income from
interest
operations
$676
$862
earned
Interest
expense
$92
$65
= 7.35
= 13.26
worsened
4. Profitability
Ratio
Computation
2012
2011
Interpretation
Return
Net income
($39)
$631
On
Net sales
$61,093
$48,077
worsened
Sales
= (0.064) %
= 1.31 %
significantly
Asset
Turnover
Sales
Average
total assets
$61,093
($32,555+$25,278)/2
= 2.11
$48,077
($25,278+$18,797)/2
= 2.18
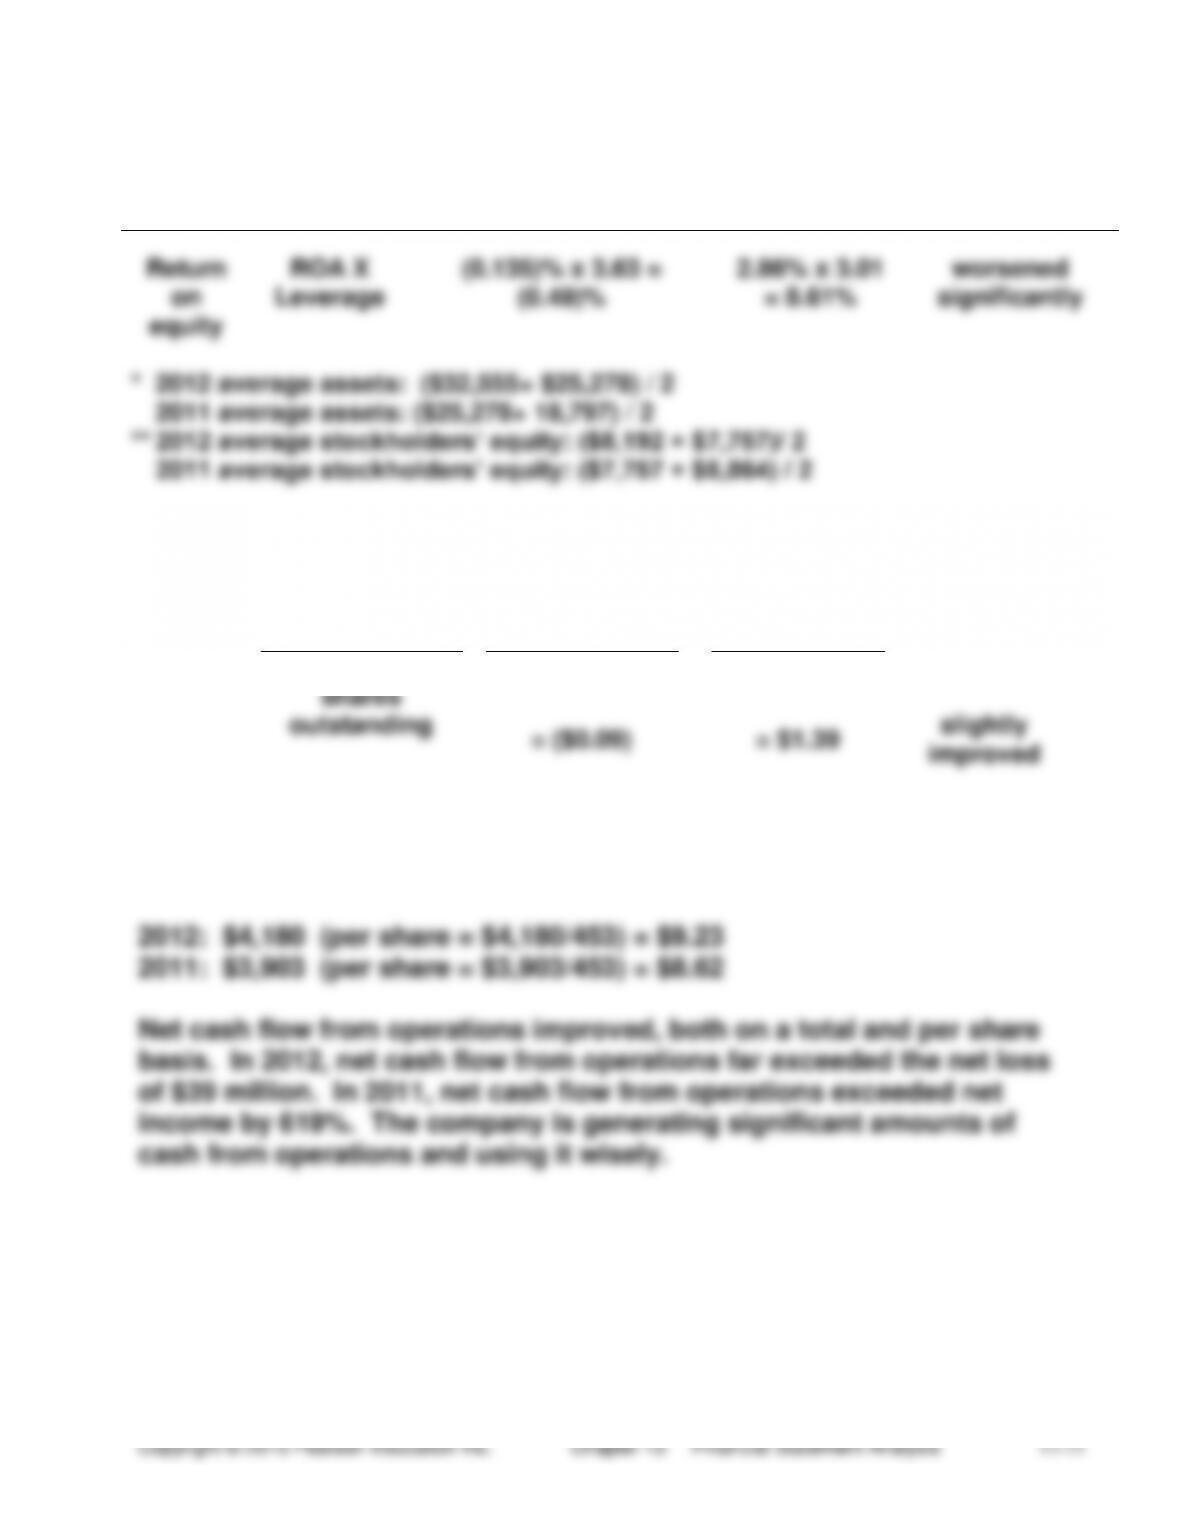
Return
on
assets
Return on
sales X
Asset
turnover
(0.064)% x 2.11 =
(0.135)%
1.31% x 2.18 =
2.86%
worsened
significantly
Leverage
Average
total
assets
Average
equity
$28,917
($8,192+$7,757)/2
= 3.63
$22,038
($7,757+$6,864)/2
= 3.01
(continued) Amazon.com
Ratio
Computation
2012
2011
Interpretation
Earnings
Net income –
per
Pfd. Div.
($39) – $0
$631 – $0
share
Avg. common
453
453
shares
outstanding
= ($0.09)
= $1.39
slightly
improved
5. Net cash flow from operations: