(continued) E 13-23A
g. Operating income percentage:
(10-15 min.) E 13-24A
2014
2013
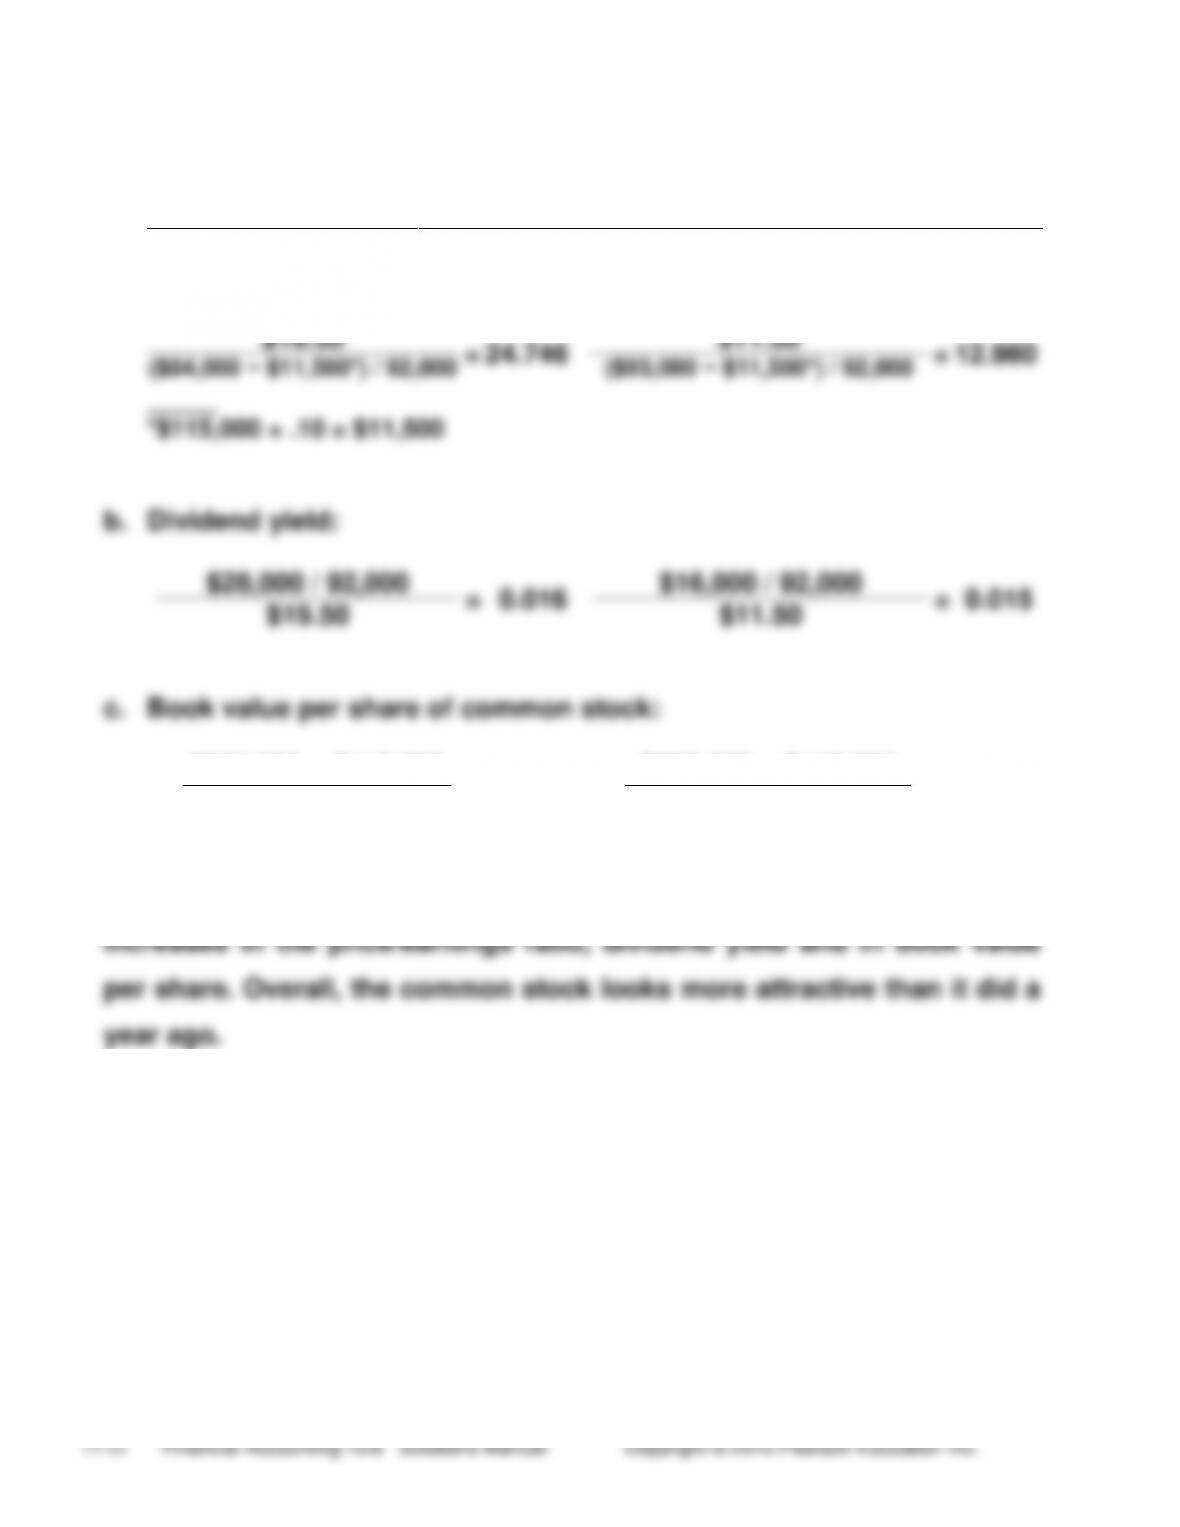
a.
Price/earnings ratio:
$19.50
=
24.746
$11.50
=
12.980
($84,000 − $11,500*) / 92,000
($93,000 − $11,500*) / 92,000
_____
*$115,000 × .10 = $11,500
b.
Dividend yield:
$28,000 / 92,000
=
0.016
$16,000 / 92,000
=
0.015
$19.50
$11.50
c.
Book value per share of common stock:
$580,000 − $115,000
=
$5.054
$500,000 − $115,000
=
$4.185
92,000
92,000
The stock’s attractiveness increased during 2014, as shown by the
(15-20 min.) E 13-25A
Req. 1
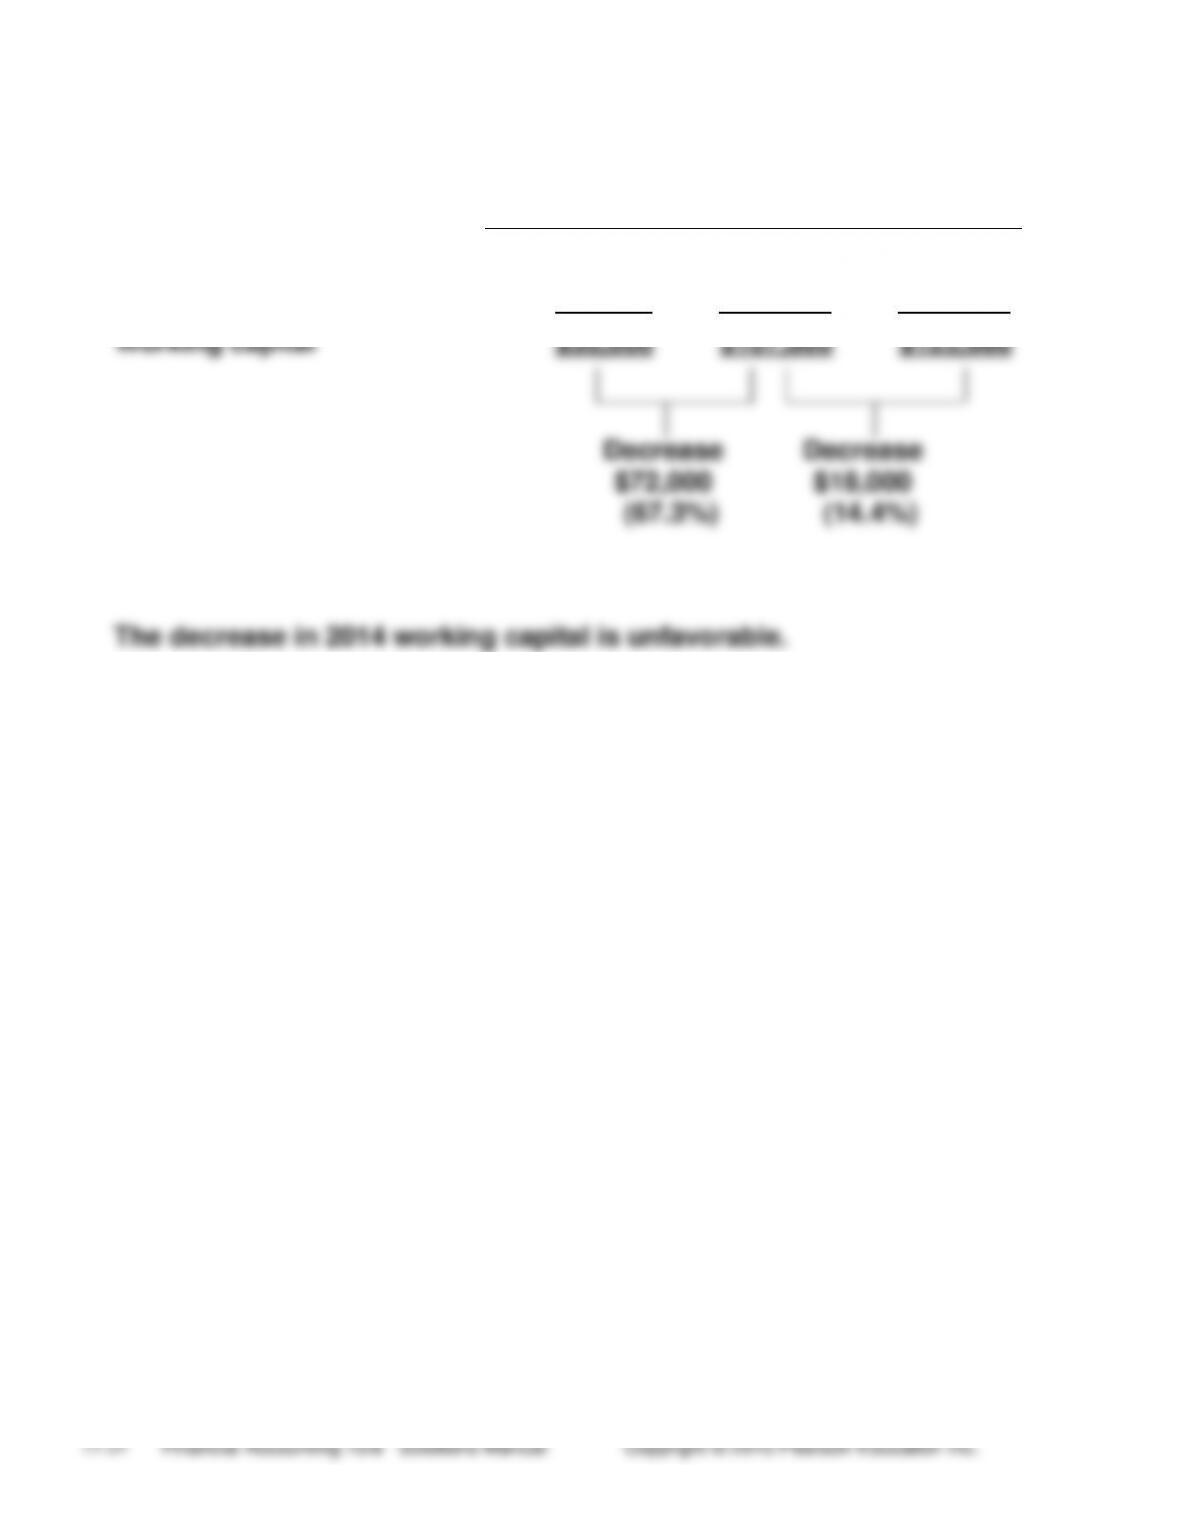
(5-15 min.) E 13-26B
2014
2013
2012
Total current assets
$60,000
$215,000
$250,000
Total current liabilities
25,000
108,000
125,000
Working capital
$35,000
$107,000
$125,000
Decrease
Decrease
$72,000
$18,000
(67.3%)
(14.4%)
The decrease in 2014 working capital is unfavorable.
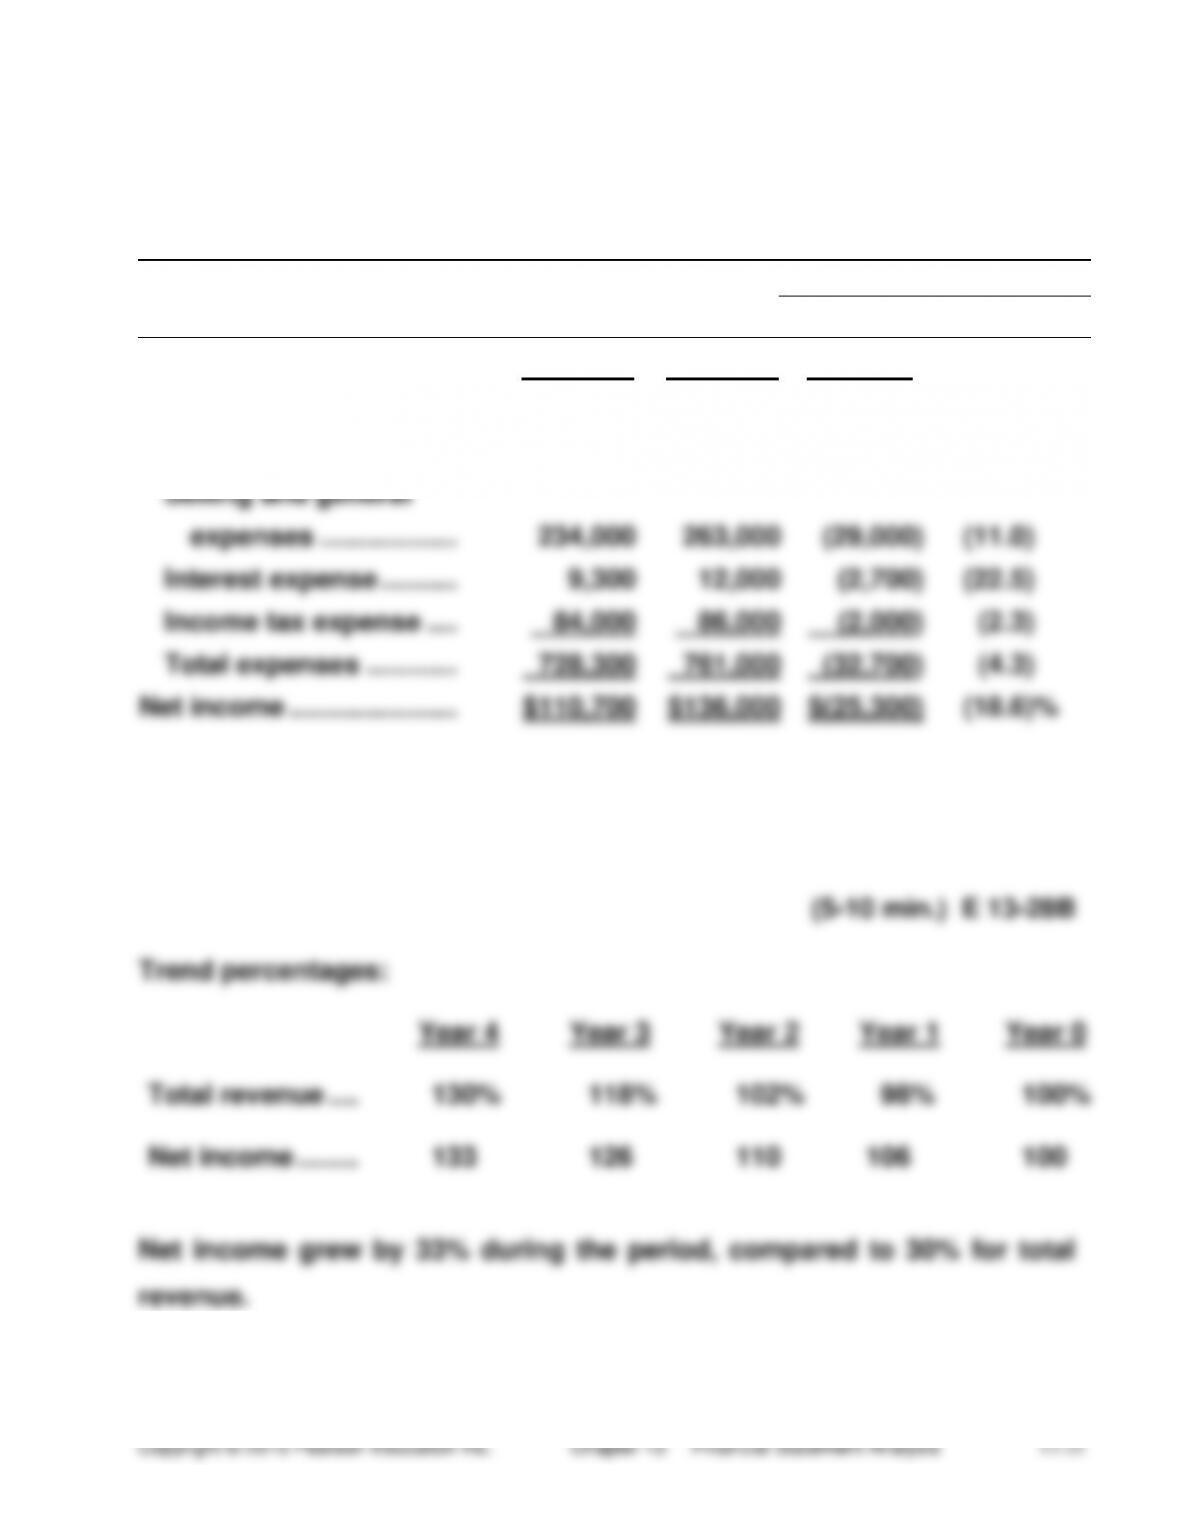
(10-15 min.) E 13-27B
Murillo Music Co.
Horizontal Analysis of Comparative Income Statements
Years Ended December 31, 2014 and 2013
INCREASE (DECREASE)
2014
2013
AMOUNT
PERCENT
Total revenue ………………
$839,000
$897,000
$(58,000)
(6.5)%
Expenses:
Cost of goods sold ……
$401,000
$400,000
$ 1,000
0.3
Selling and general
expenses ………………
234,000
263,000
(29,000)
(11.0)
Interest expense ……….
9,300
12,000
(2,700)
(22.5)
Income tax expense ….
84,000
86,000
(2,000)
(2.3)
Total expenses …………
728,300
761,000
(32,700)
(4.3)
Net income ………………….
$110,700
$136,000
$(25,300)
(18.6)%
(5-10 min.) E 13-28B
Trend percentages:
Year 4
Year 3
Year 2
Year 1
Year 0
Total revenue ….
130%
118%
102%
98%
100%
Net income ……..
133
126
110
106
100
Net income grew by 33% during the period, compared to 30% for total
revenue.
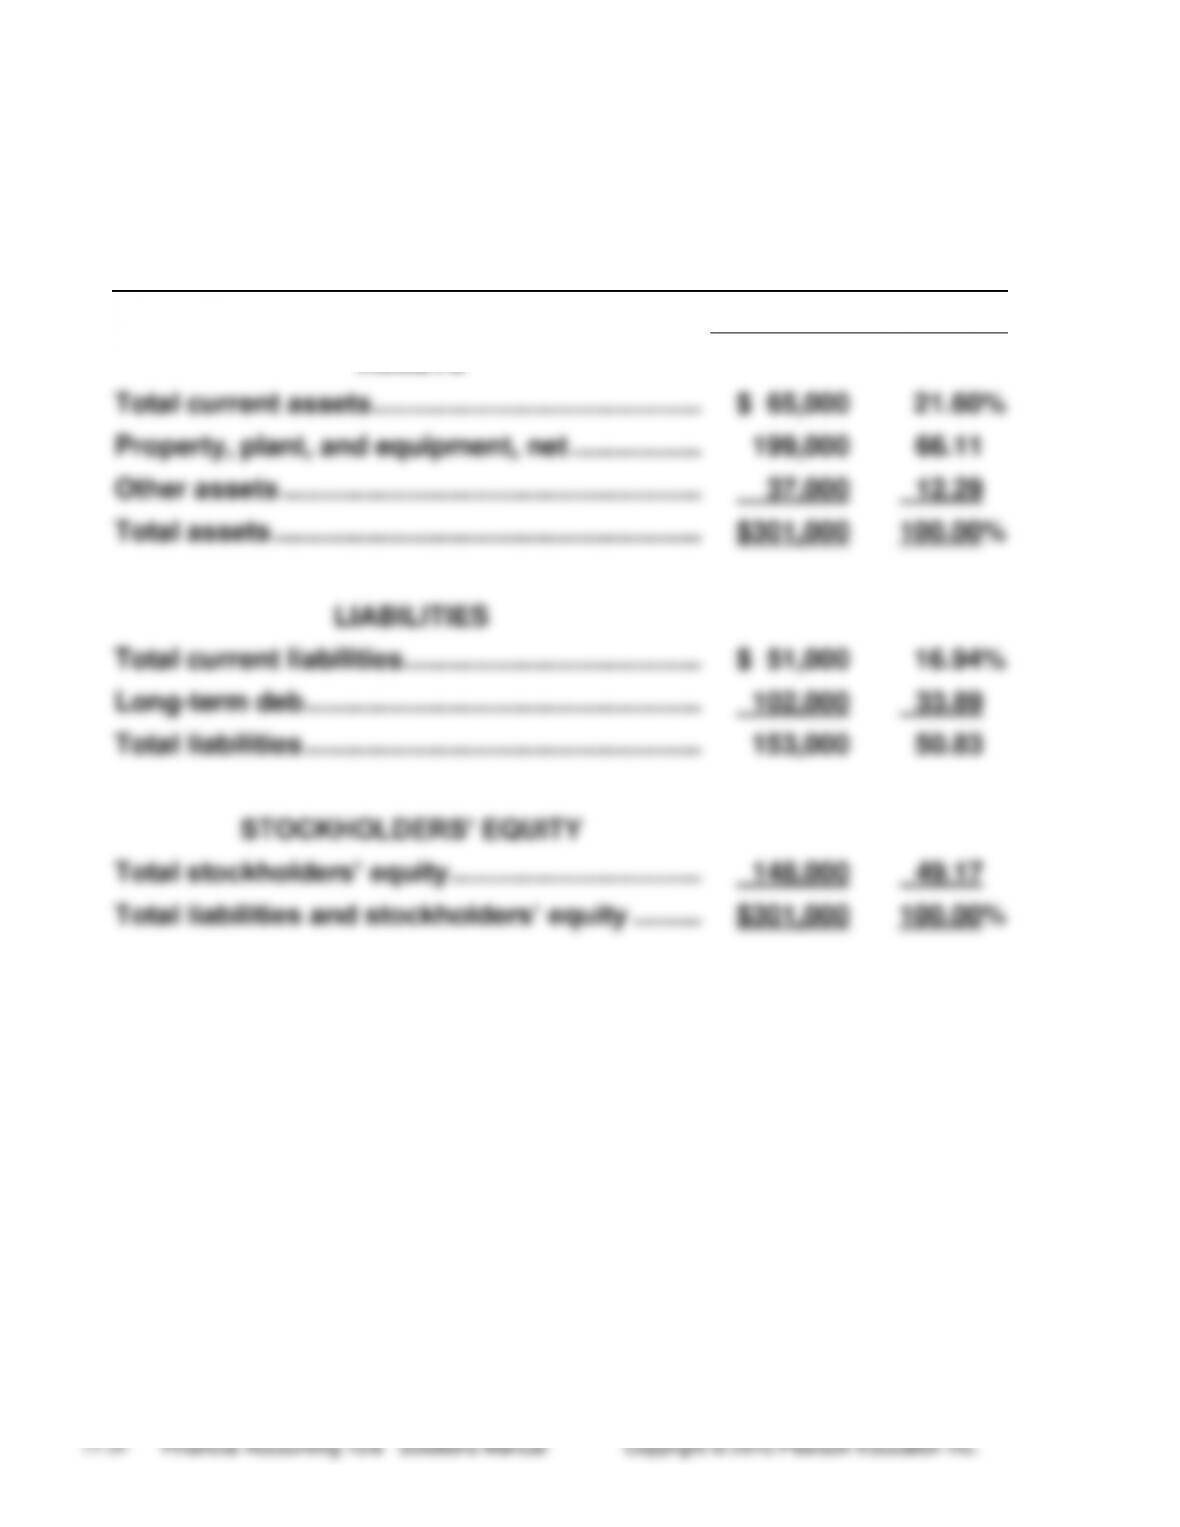
(10-15 min.) E 13-29B
VanKlief Golf Company
Vertical Analysis of Balance Sheet
December 31, 2014
AMOUNT
PERCENT
ASSETS
Total current assets …………………………………….
$ 65,000
21.60%
Property, plant, and equipment, net ……………..
199,000
66.11
Other assets ……………………………………………….
37,000
12.29
Total assets ………………………………………………..
$301,000
100.00%
LIABILITIES
Total current liabilities …………………………………
$ 51,000
16.94%
Long-term deb …………………………………………….
102,000
33.89
Total liabilities …………………………………………….
153,000
50.83
STOCKHOLDERS’ EQUITY
Total stockholders’ equity …………………………...
148,000
49.17
Total liabilities and stockholders’ equity ………
$301,000
100.00%
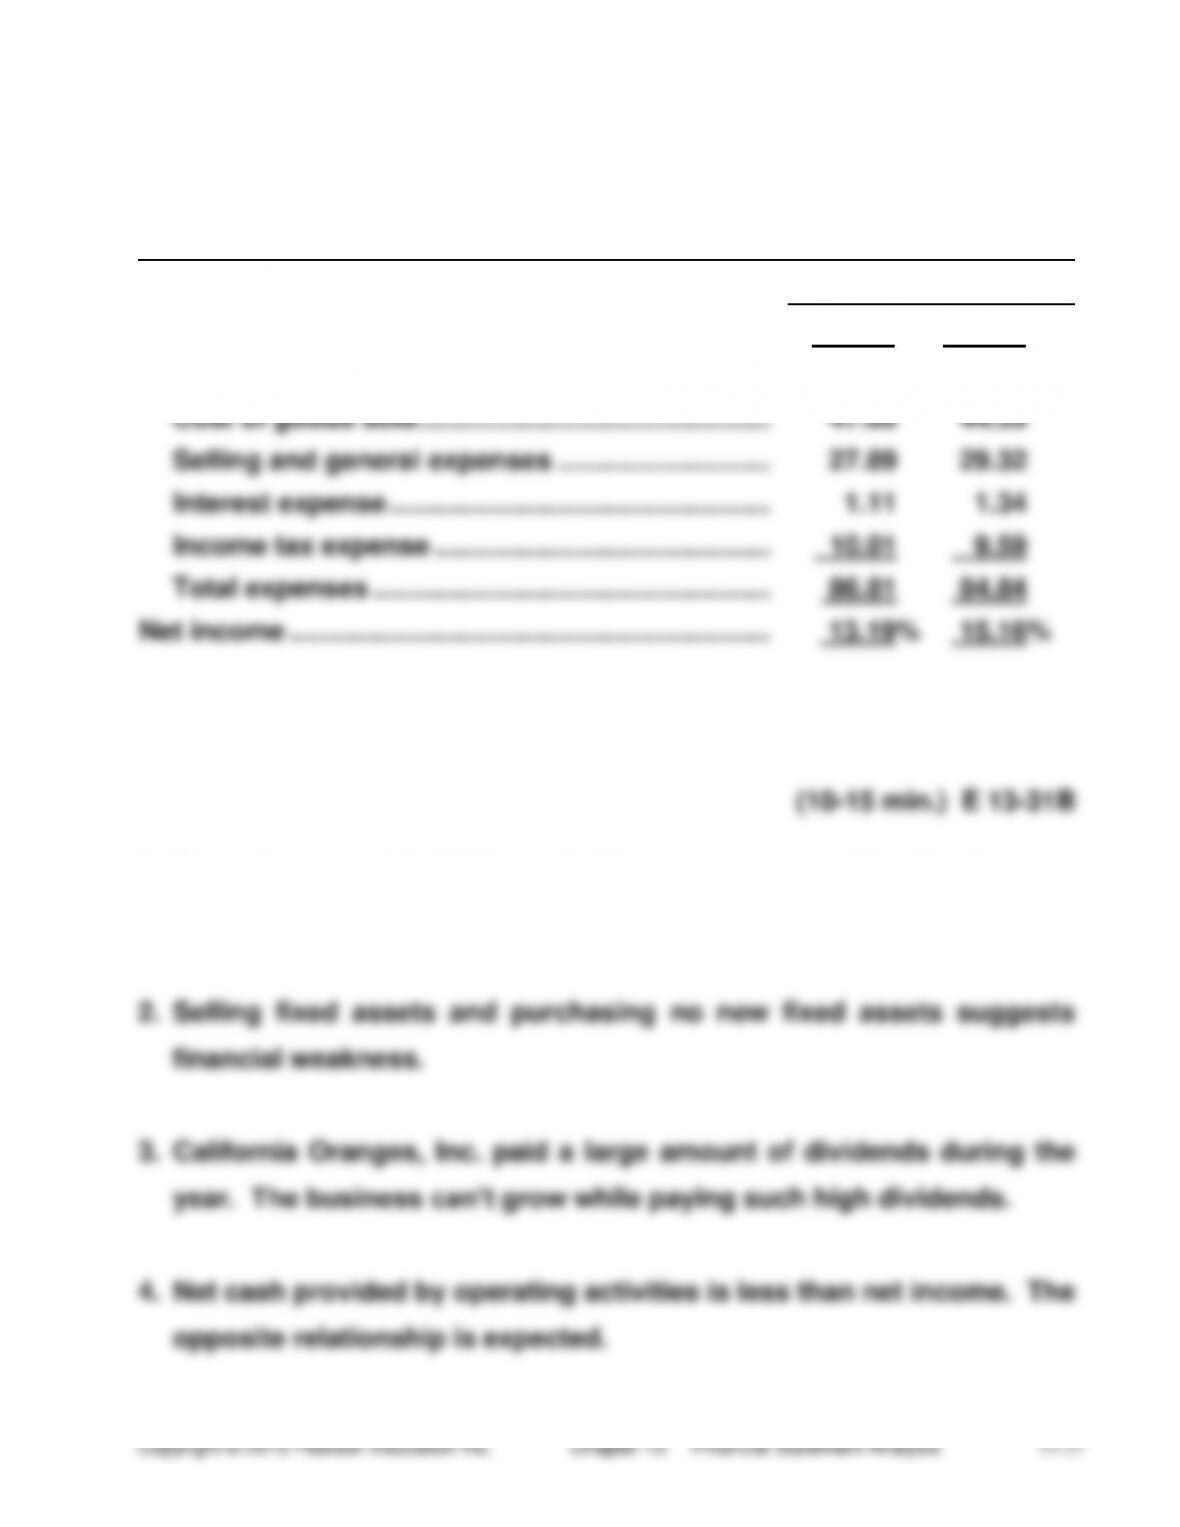
(10-15 min.) E 13-30B
Murillo Music Co.
Comparative Common-Size Income Statements
Years Ended December 31, 2014 and 2013
2014
2013
Total revenue …………………………………………………..
100.00%
100.00%
Expenses:
Cost of goods sold ……………………………………….
47.80
44.59
Selling and general expenses ……………………….
27.89
29.32
Interest expense …………………………………………..
1.11
1.34
Income tax expense ……………………………………..
10.01
9.59
Total expenses …………………………………………….
86.81
84.84
Net income ………………………………………………………
13.19%
15.16%
(10-15 min.) E 13-31B
1. Operations provided little cash. The company is selling fixed assets
to generate cash.
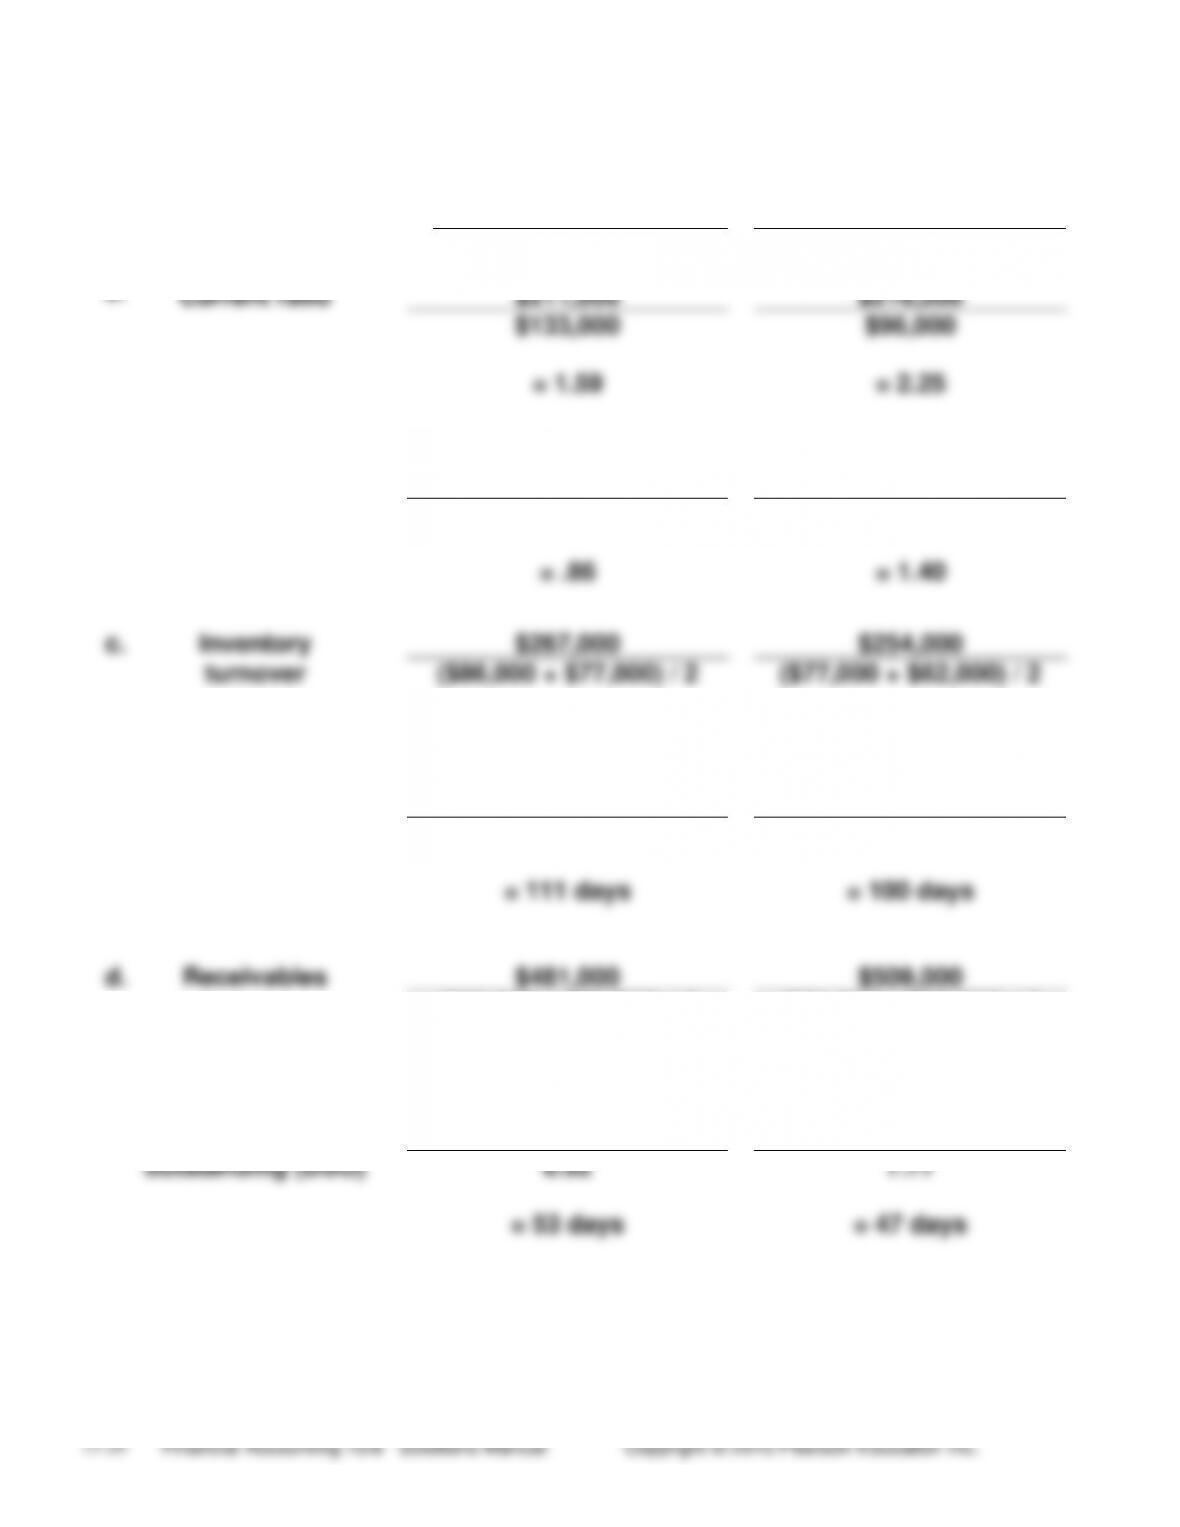
(10-15 min.) E 13-32B
Req. 1
Current Year
Prior Year
a.
Current ratio
$211,000
$216,000
$133,000
$96,000
= 1.59
= 2.25
b.
Quick (acid-test)
ratio
$34,000 + $12,000 +
$68,000
$40,000+ $23,000 +
$71,000
$133,000
$96,000
= .86
= 1.40
c.
Inventory
$267,000
$254,000
turnover
($86,000 + $77,000) / 2
($77,000 + $62,000) / 2
= 3.28
= 3.65
Days’ inventory
365
365
outstanding (DIO)
3.28
3.65
= 111 days
= 100 days
d.
Receivables
$481,000
$509,000
turnover
($68,000 + $71,000) / 2
($71,000 + $60,000) / 2
= 6.92
= 7.77
e.
Days’ sales
365
365
outstanding (DSO)
6.92
7.77
= 53 days
= 47 days
(continued) E 13-32B
f.
Payables
$267,000
$254,000
turnover
($80,000 + $65,000) / 2
($65,000 + $50,000) / 2
= 3.68
= 4.42
Days’ payables
365
365
outstanding (DPO)
3.68
4.42
= 99 days
= 83 days
g.
Cash conversion
111 + 53 – 99
100 + 47 – 83
cycle ( DIO + DSO
– DPO)
= 65 days
= 64 days
Req. 2
a. deteriorated
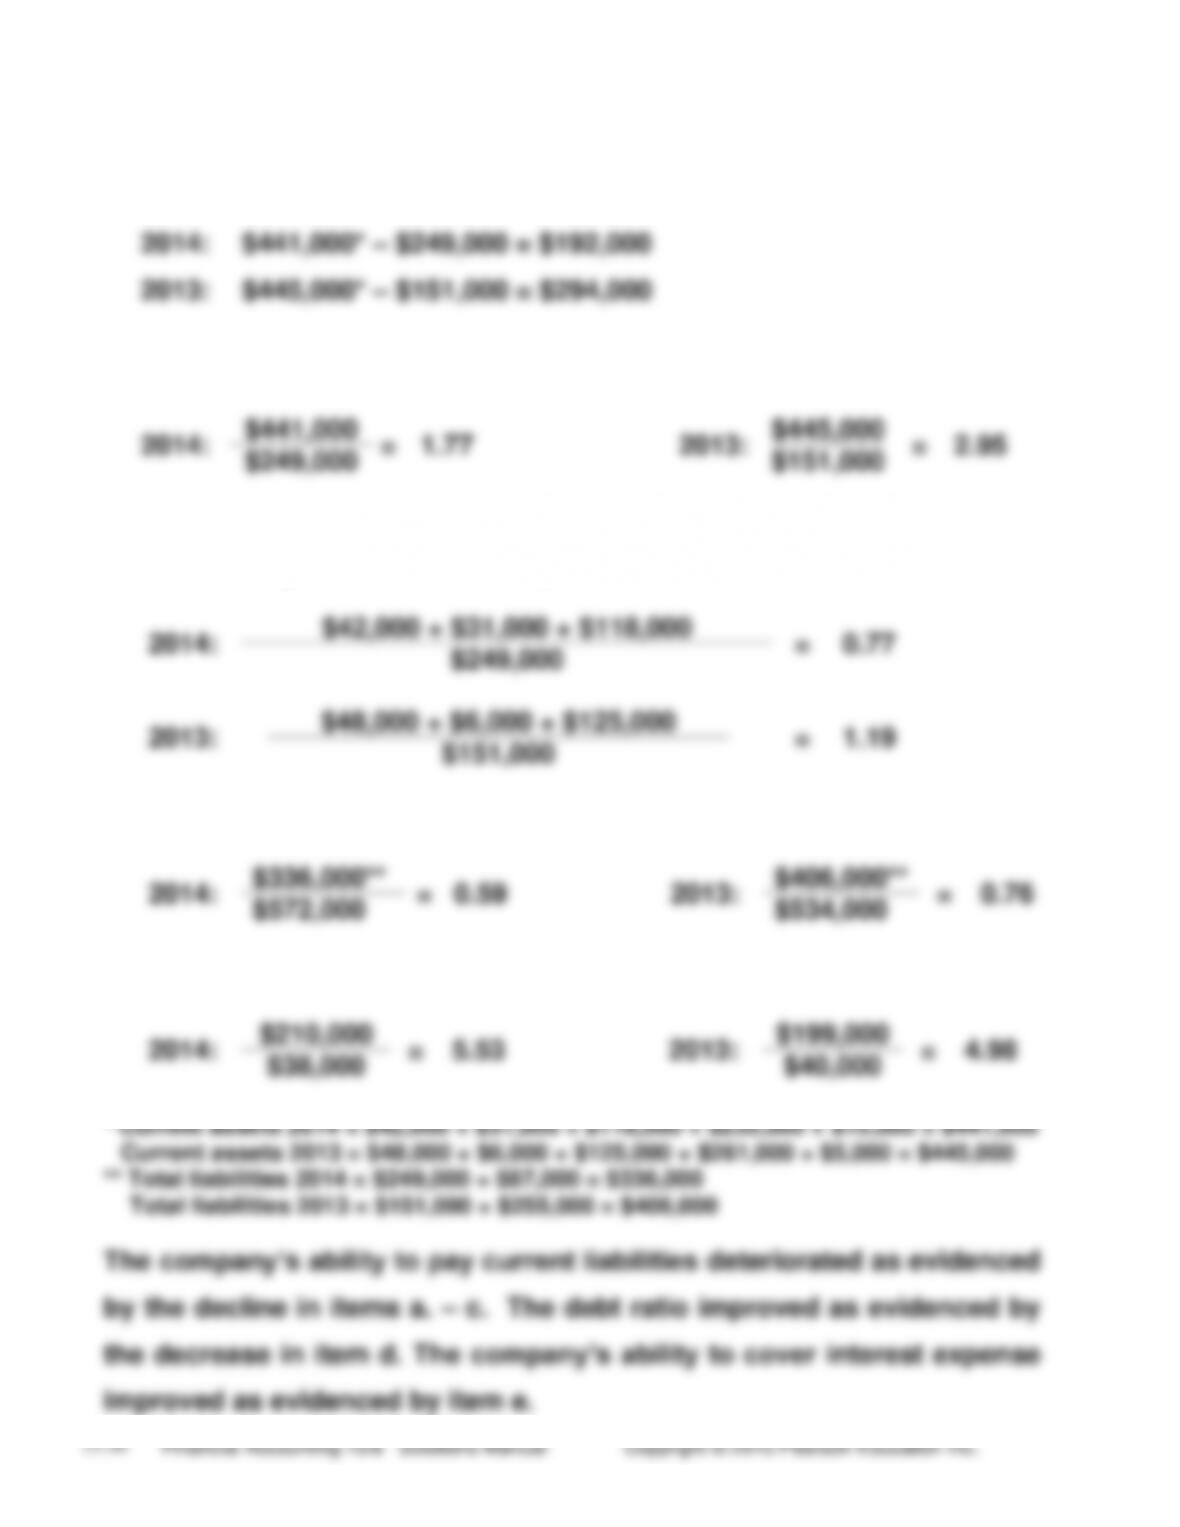
(15-20 min.) E 13-33B
a. Working capital (Current assets – Current liabilities)
2014:
$441,000* – $249,000 = $192,000
2013:
$445,000* – $151,000 = $294,000
b. Current ratio (Current assets ÷ Current liabilities)
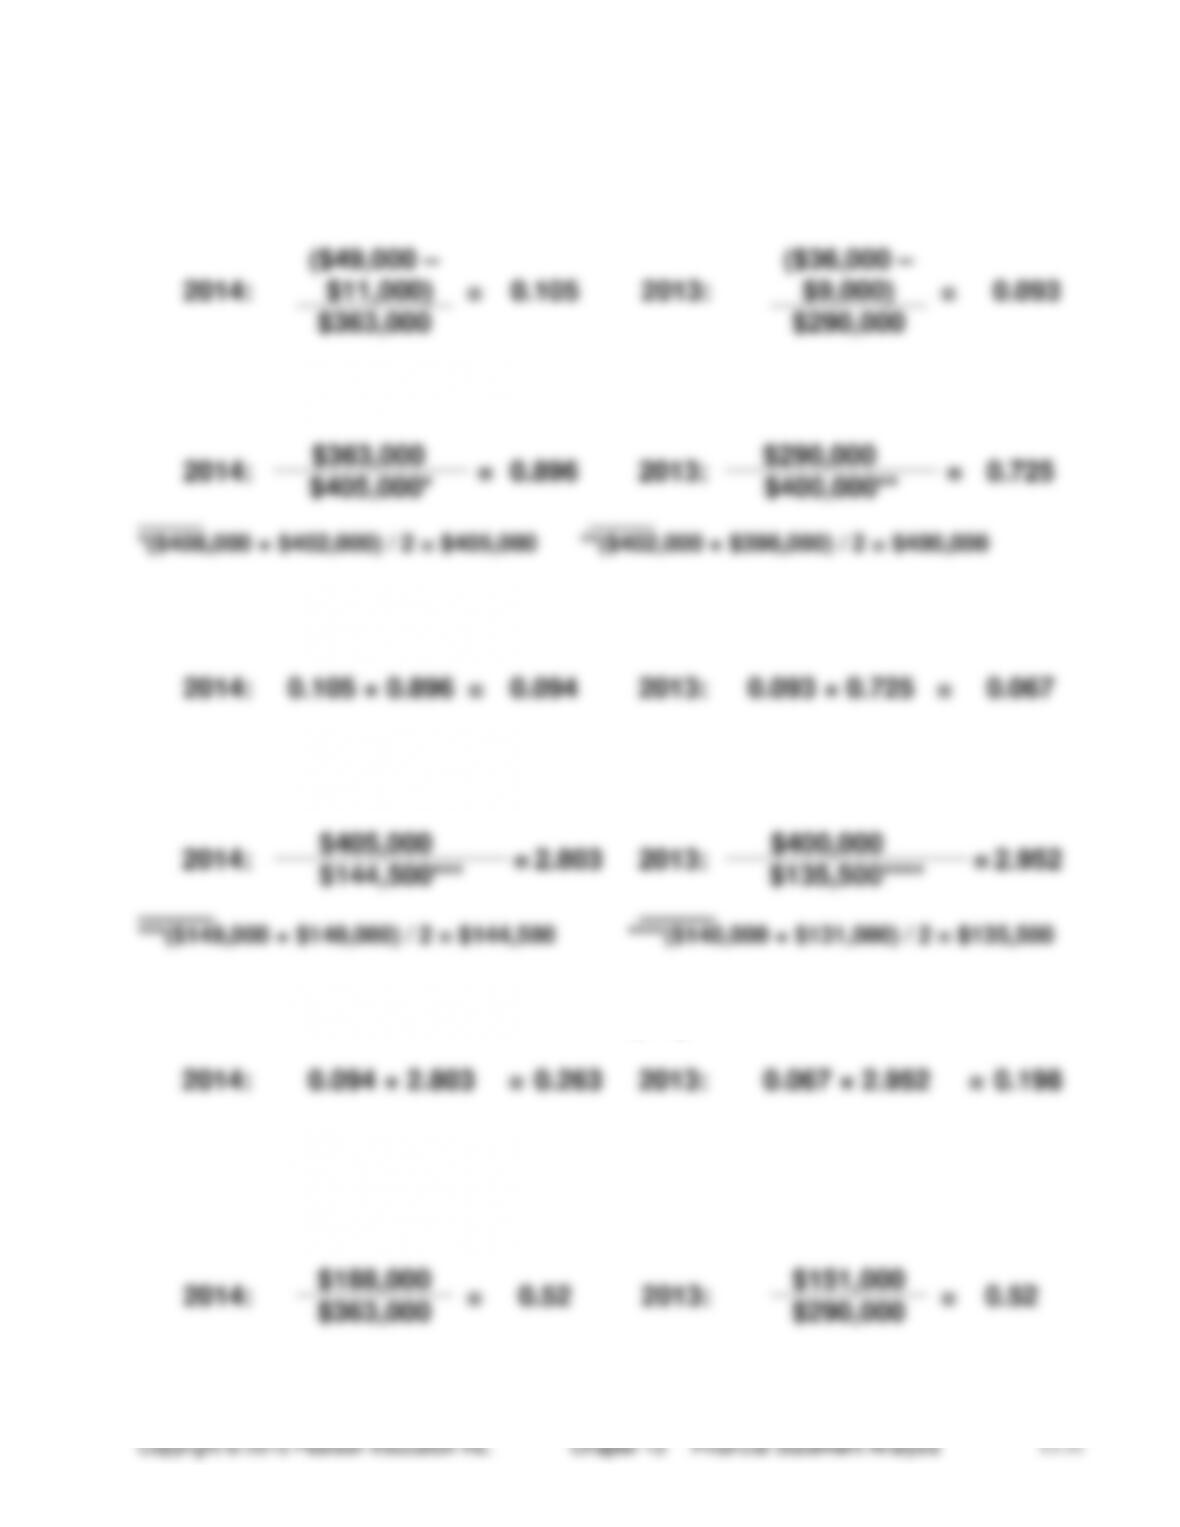
(10-15 min.) E 13-34B
a. Return on net sales:
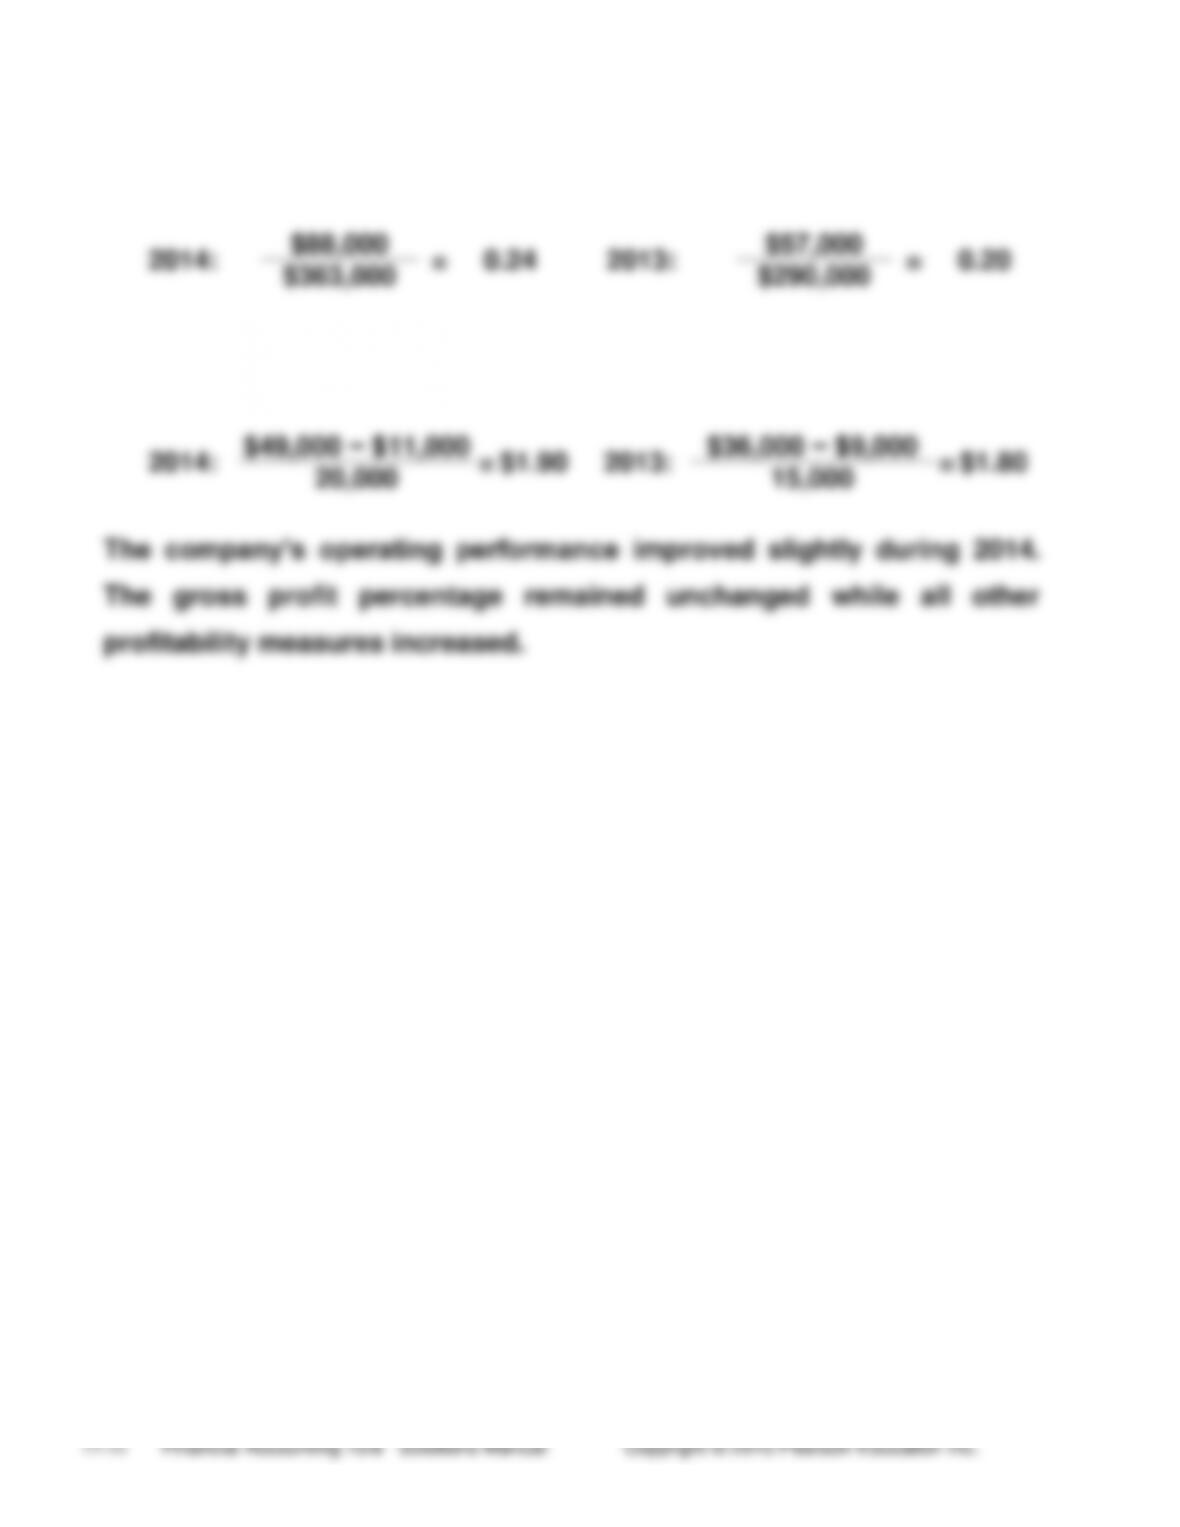
(continued) E 13-34B
g. Operating income percentage:
h. Earnings per share of common stock:
(10-15 min.) E 13-35B
2014
2013
a.
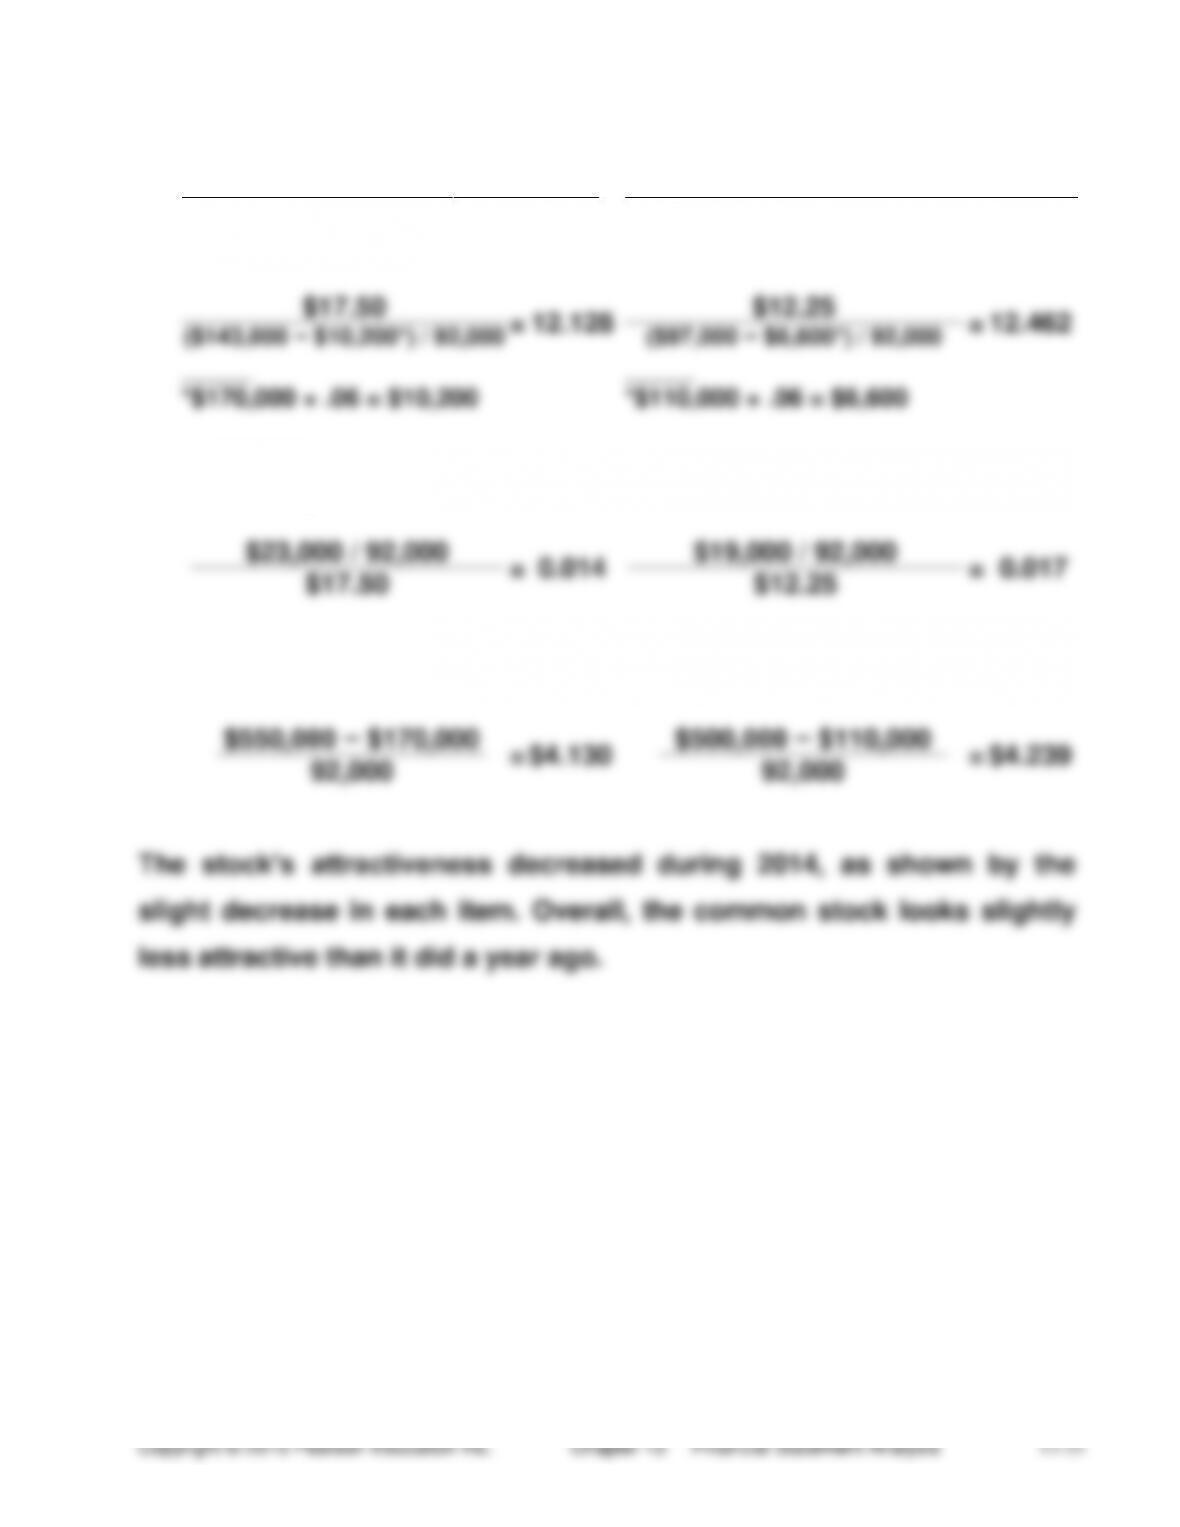
Price/earnings ratio:
$17.50
=
12.128
$12.25
=
12.462
($143,000 − $10,200*) / 92,000
($97,000 − $6,600*) / 92,000
_____
_____
*$170,000 × .06 = $10,200
*$110,000 × .06 = $6,600
b.
Dividend yield:
$23,000 / 92,000
=
0.014
$19,000 / 92,000
=
0.017
$17.50
$12.25
c.
Book value per share of common stock:
$550,000 − $170,000
=
$4.130
$500,000 − $110,000
=
$4.239
92,000
92,000
The stock’s attractiveness decreased during 2014, as shown by the
slight decrease in each item. Overall, the common stock looks slightly
less attractive than it did a year ago.
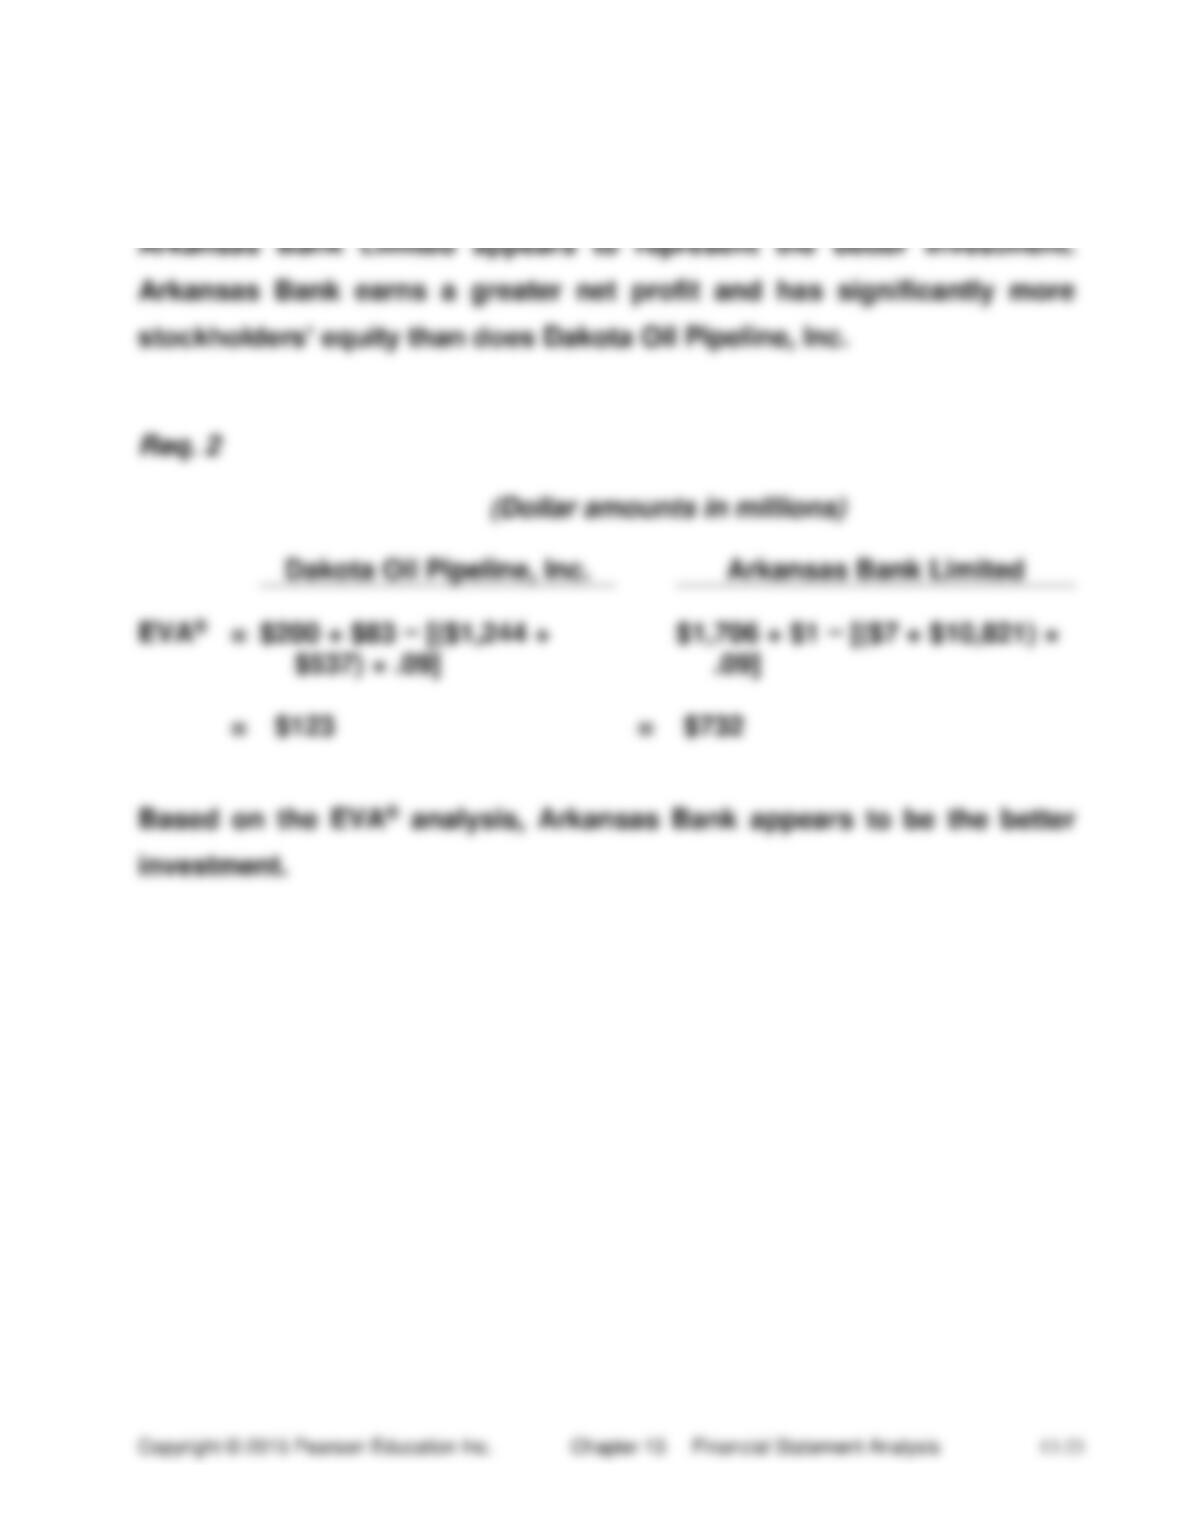
(15-20 min.) E 13-36B
Req. 1
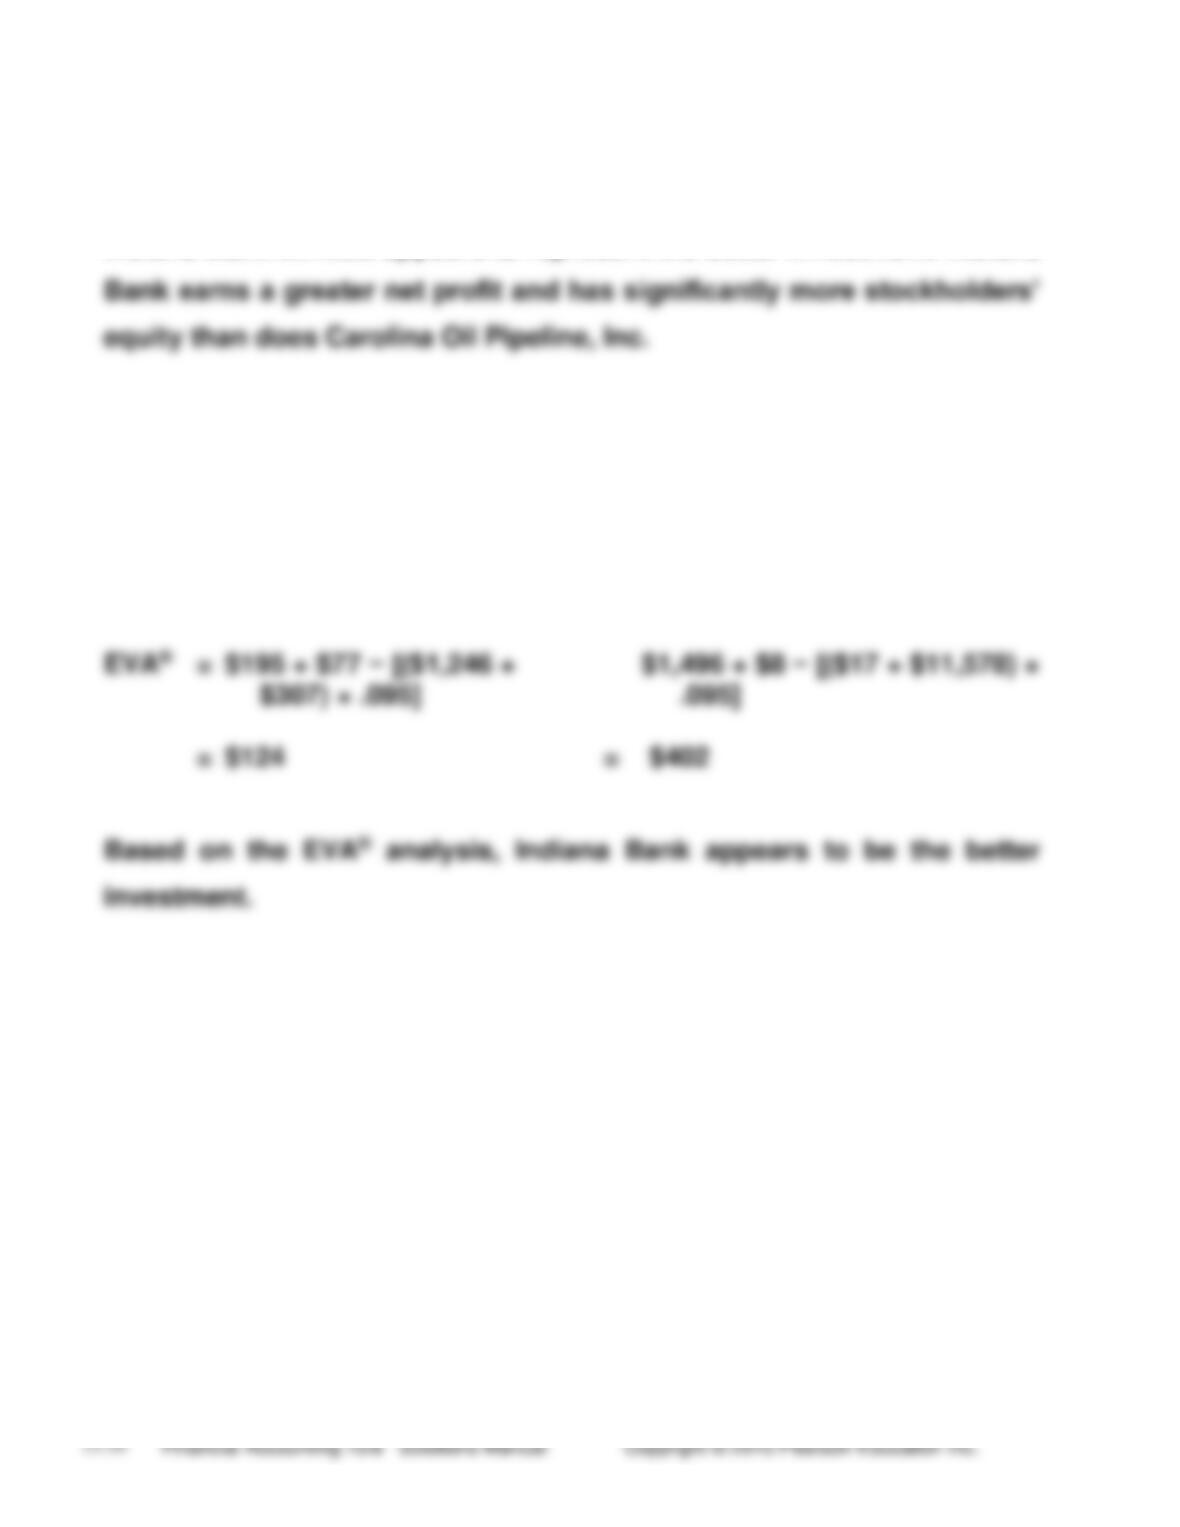
Indiana Bank Limited appears to represent the better investment. Indiana
Req. 2
(Dollar amounts in millions)
Carolina Oil Pipeline, Inc.
Indiana Bank Limited
EVA®
=
$195 + $77 − [($1,246 +
$307) × .095]
$1,496 + $8 − [($17 + $11,578) ×
.095]
=
$124
=
$402
Quiz
Q13-37
b ($19,311 − $15,047 = $4,264 increase;
$4,264 / $15,047 = 0.283)
Q13–38
c ($10,649 / $11,384 = 0.935 ≈ .94
Q13–39
d [($4,333 + $845 + $3,400) / $11,384 =
0.75]
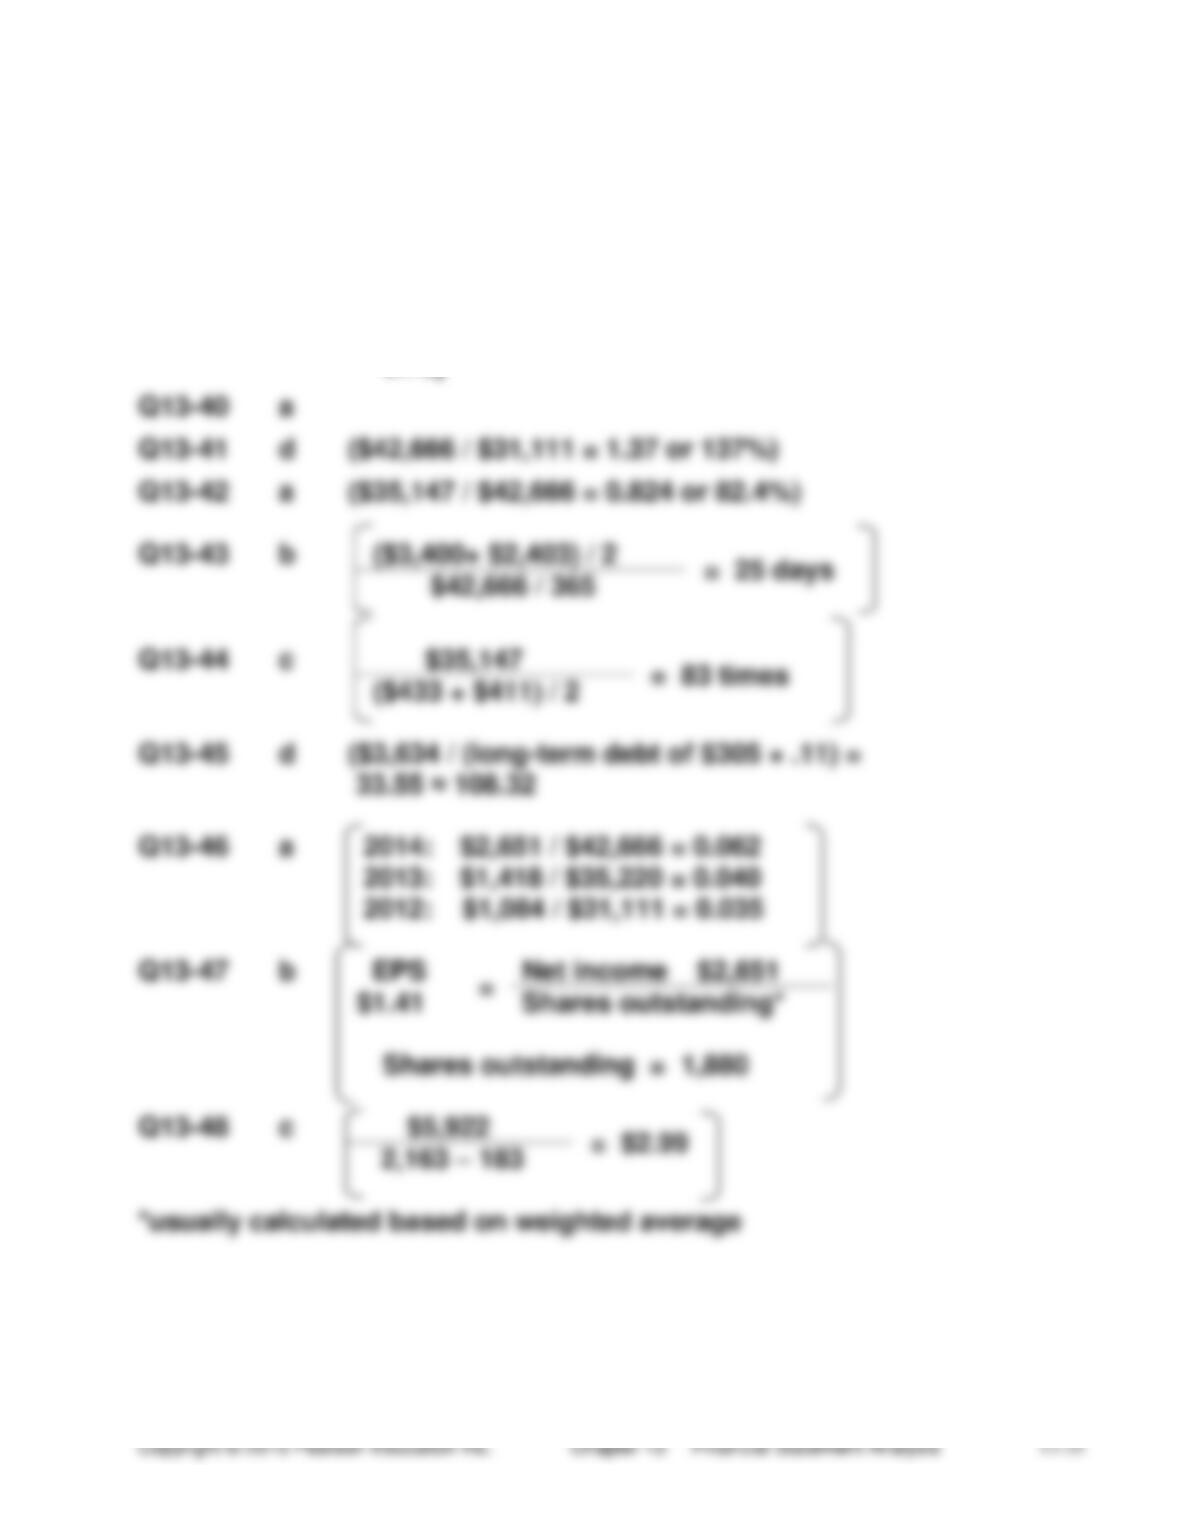
Q13-40
a
Q13-41
d ($42,666 / $31,111 = 1.37 or 137%)
Q13-42
a ($35,147 / $42,666 = 0.824 or 82.4%)
Q13-43
b
($3,400+ $2,403) / 2
= 25 days
$42,666 / 365
Q13-44
c
$35,147
= 83 times
($433 + $411) / 2
Q13-45
d ($3,634 / (long-term debt of $305 × .11) =
33.55 ≈ 108.32
Q13-46
a 2014: $2,651 / $42,666 = 0.062
2013: $1,418 / $35,220 = 0.040
2012: $1,084 / $31,111 = 0.035
Q13-47
b
EPS
=
Net income $2,651
$1.41
Shares outstanding*
Shares outstanding = 1,880
Q13–48
c
$5,922
= $2.99
2,163 – 183
*usually calculated based on weighted average
Problems
(20-30 min.) P 13-49A
Req. 1
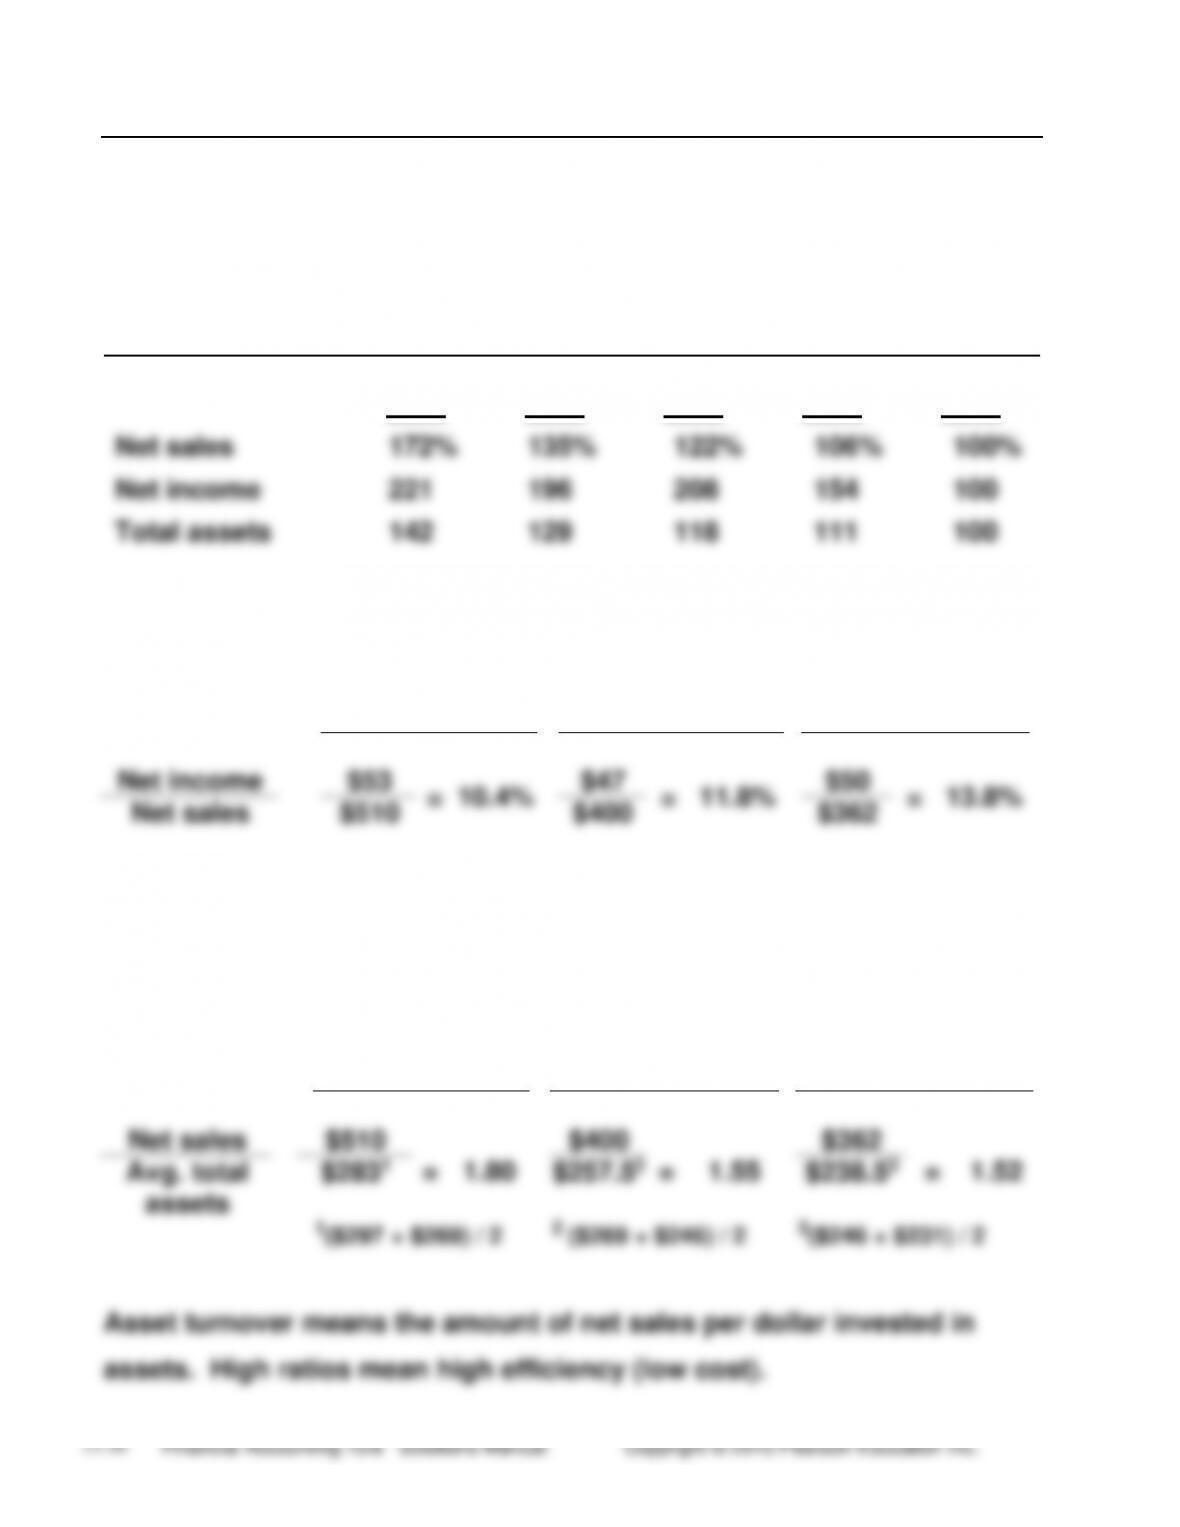
Westover Shipping, Inc.
Trend Percentages
2014
2013
2012
2011
2010
Net sales
172%
135%
122%
106%
100%
Net income
221
196
208
154
100
Total assets
142
129
118
111
100
Req. 2 Return on net sales Dollar amounts in thousands
2014
2013
2012
Net income
$53
=
10.4%
$47
=
11.8%
$50
=
13.8%
Net sales
$510
$400
$362
Return on sales measures the amount of net income for each dollar of
net sales.
Req. 3 Asset turnover Dollar amounts in thousands
2014
2013
2012
Net sales
$510
=
1.80
$400
=
1.55
$362
=
1.52
Avg. total
assets
$2831
$257.52
$238.53
1($297 + $269) / 2
2 ($269 + $246) / 2
3($246 + $231) / 2
Asset turnover means the amount of net sales per dollar invested in
assets. High ratios mean high efficiency (low cost).
(continued) P 13-49A
Req. 4 Return on assets Dollar amounts in thousands
2014
2013
2012
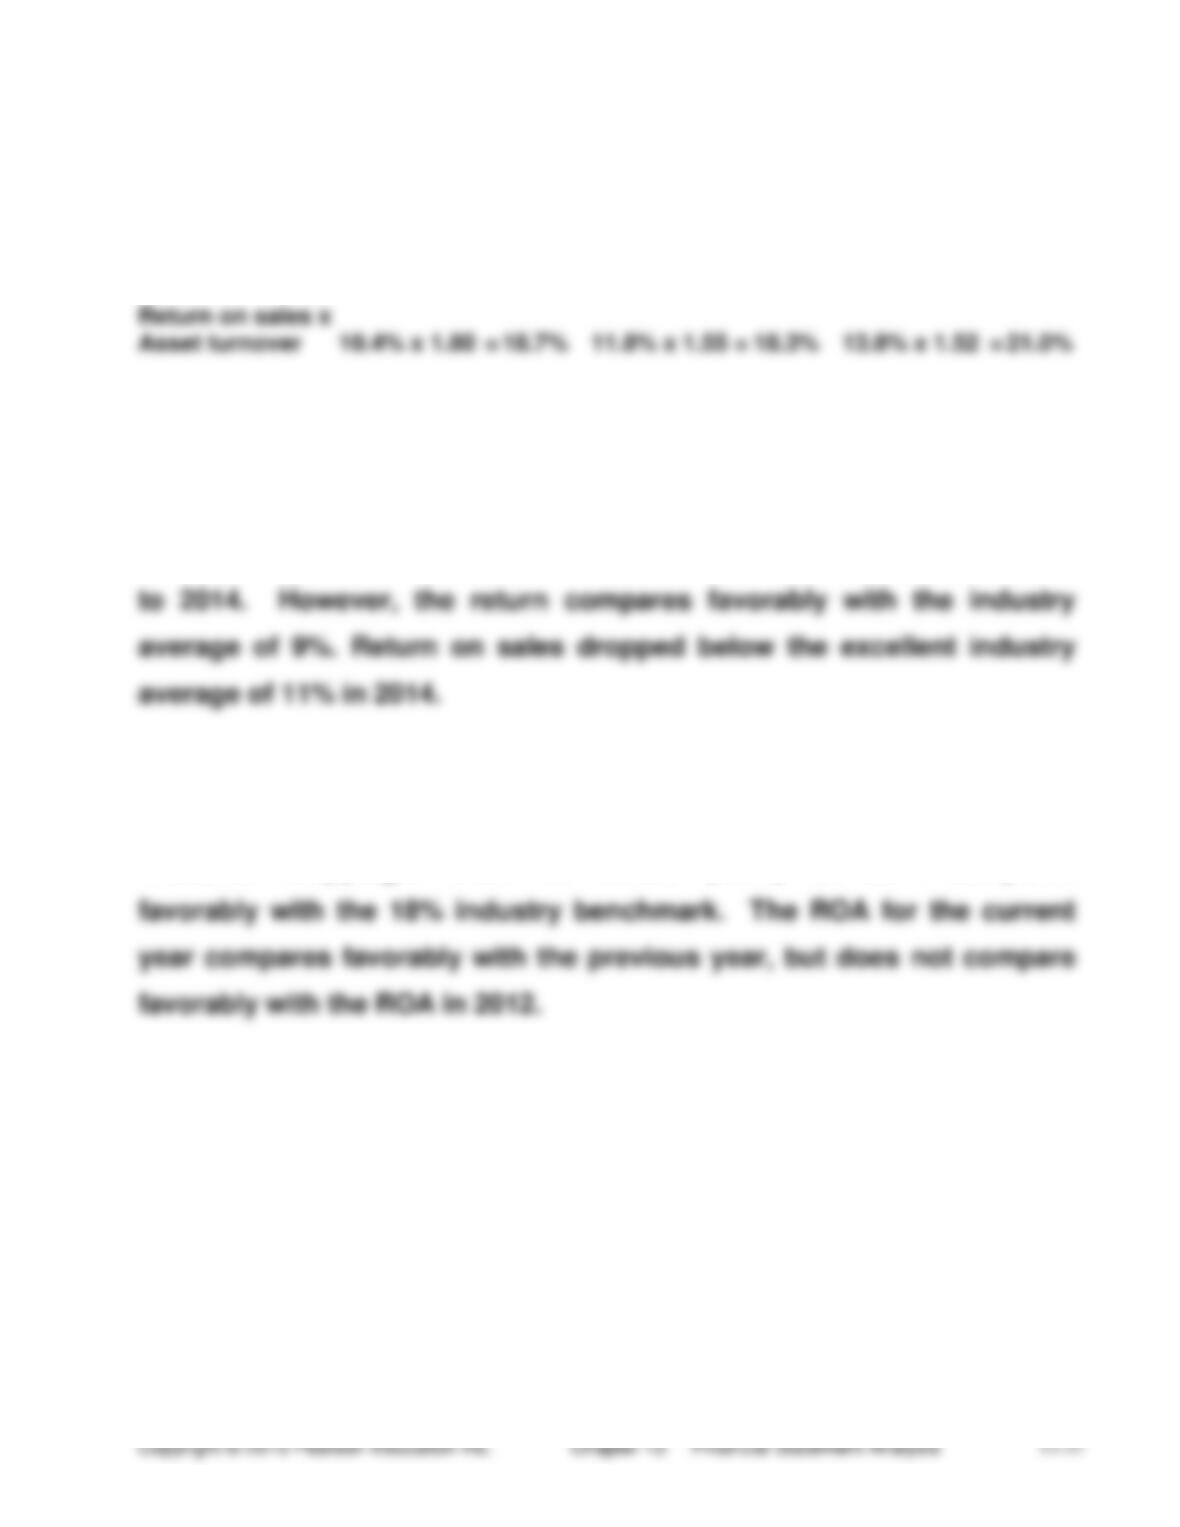
Return on sales x
Asset turnover
10.4% x 1.80
=
18.7%
11.8% x 1.55
=
18.3%
13.8% x 1.52
=
21.0%
Req. 5
Westover Shipping’s rate of return on net sales has declined from 2012
Req. 6
Westover Shipping’s return on assets (ROA) for 2014 compares
(20-30 min.) P 13-50A
Req. 1
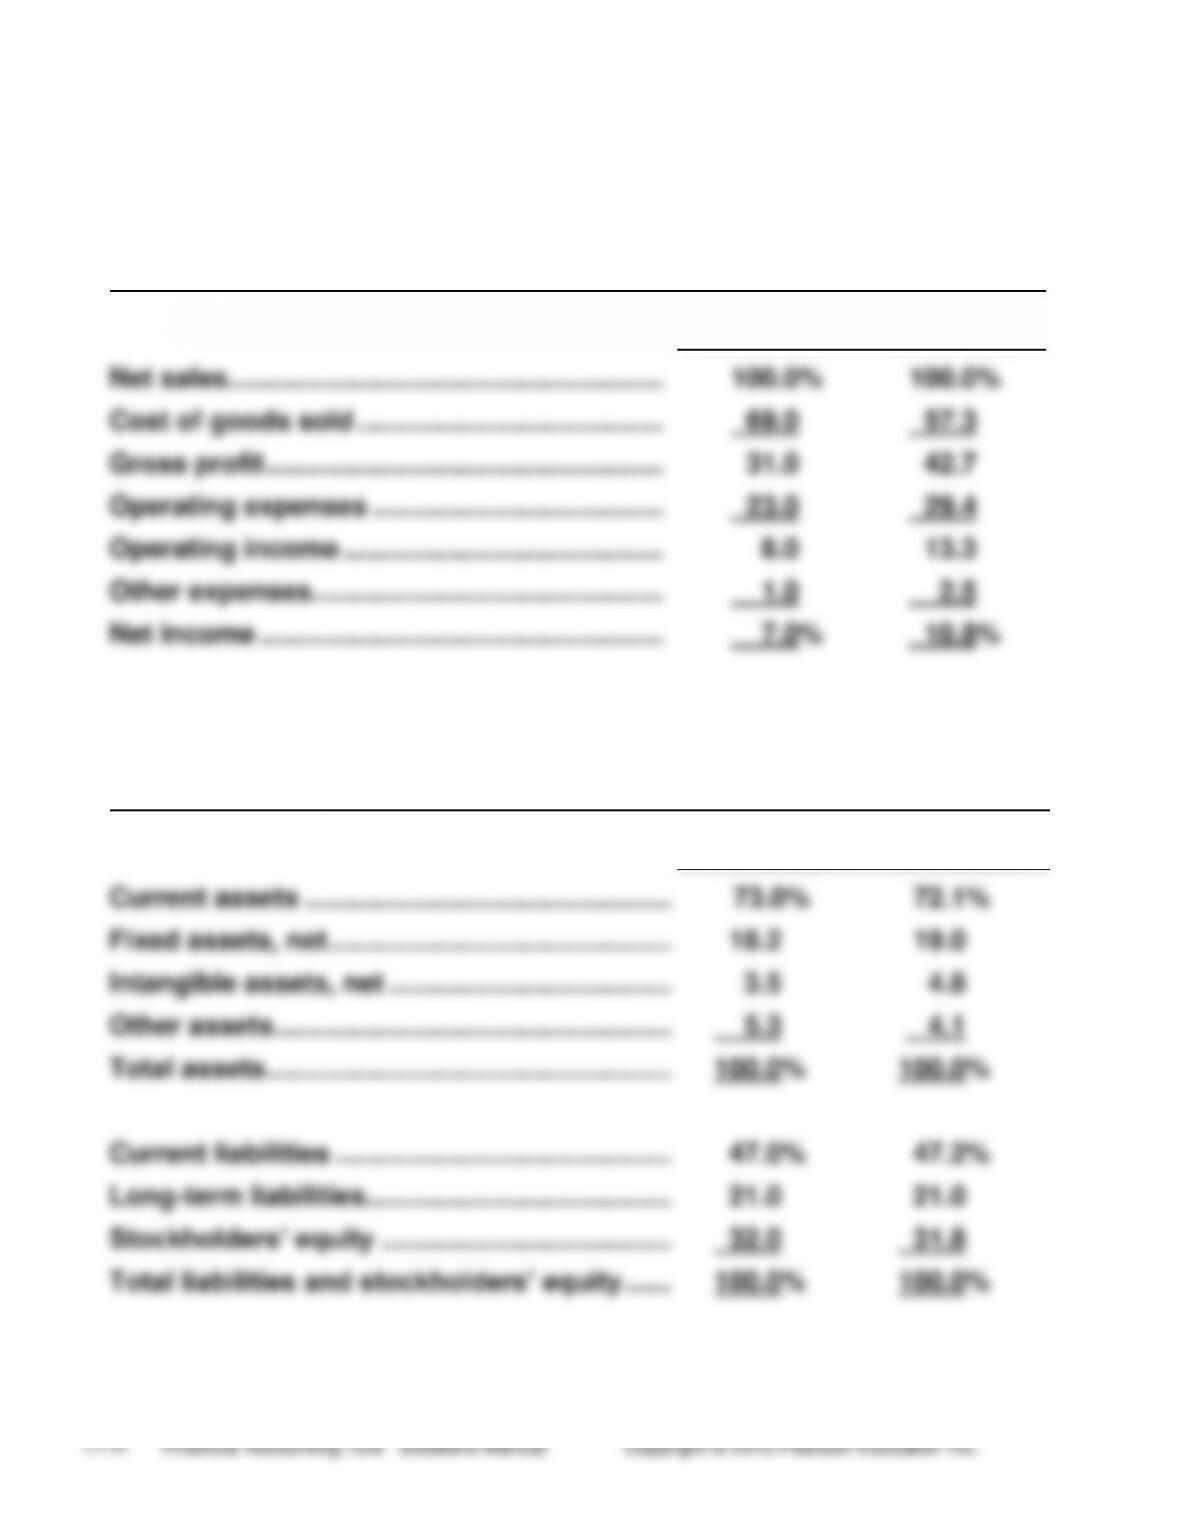
CC Oliver Products, Inc.
Common-Size Income Statement Compared to Industry Average
Year Ended December 31, 2014
CC Oliver
Products
INDUSTRY
AVERAGE
Net sales …………………………………………………
100.0%
100.0%
Cost of goods sold ………………………………….
69.0
57.3
Gross profit …………………………………………….
31.0
42.7
Operating expenses ………………………………..
23.0
29.4
Operating income ……………………………………
8.0
13.3
Other expenses …………………………..…………..
1.0
2.5
Net income ……………………………………………..
7.0%
10.8%
CC Oliver Products, Inc.
Common-Size Balance Sheet Compared to Industry Average
December 31, 2014
CC Oliver
Products
INDUSTRY
AVERAGE
Current assets …………………………………………
73.0%
72.1%
Fixed assets, net ………………………………………
18.2
19.0
Intangible assets, net ……………………………….
3.5
4.8
Other assets …………………………………………….
5.3
4.1
Total assets ……………………………………………..
100.0%
100.0%
Current liabilities ……………………………………..
47.0%
47.2%
Long-term liabilities ………………………………….
21.0
21.0
Stockholders’ equity ………………………………..
32.0
31.8
Total liabilities and stockholders’ equity ……
100.0%
100.0%
(continued) P 13-50A
Req. 2
CC Oliver Products’ common-size income statement shows that its
Req. 3
CC Oliver Products’ common-size balance sheet shows that its ratios of
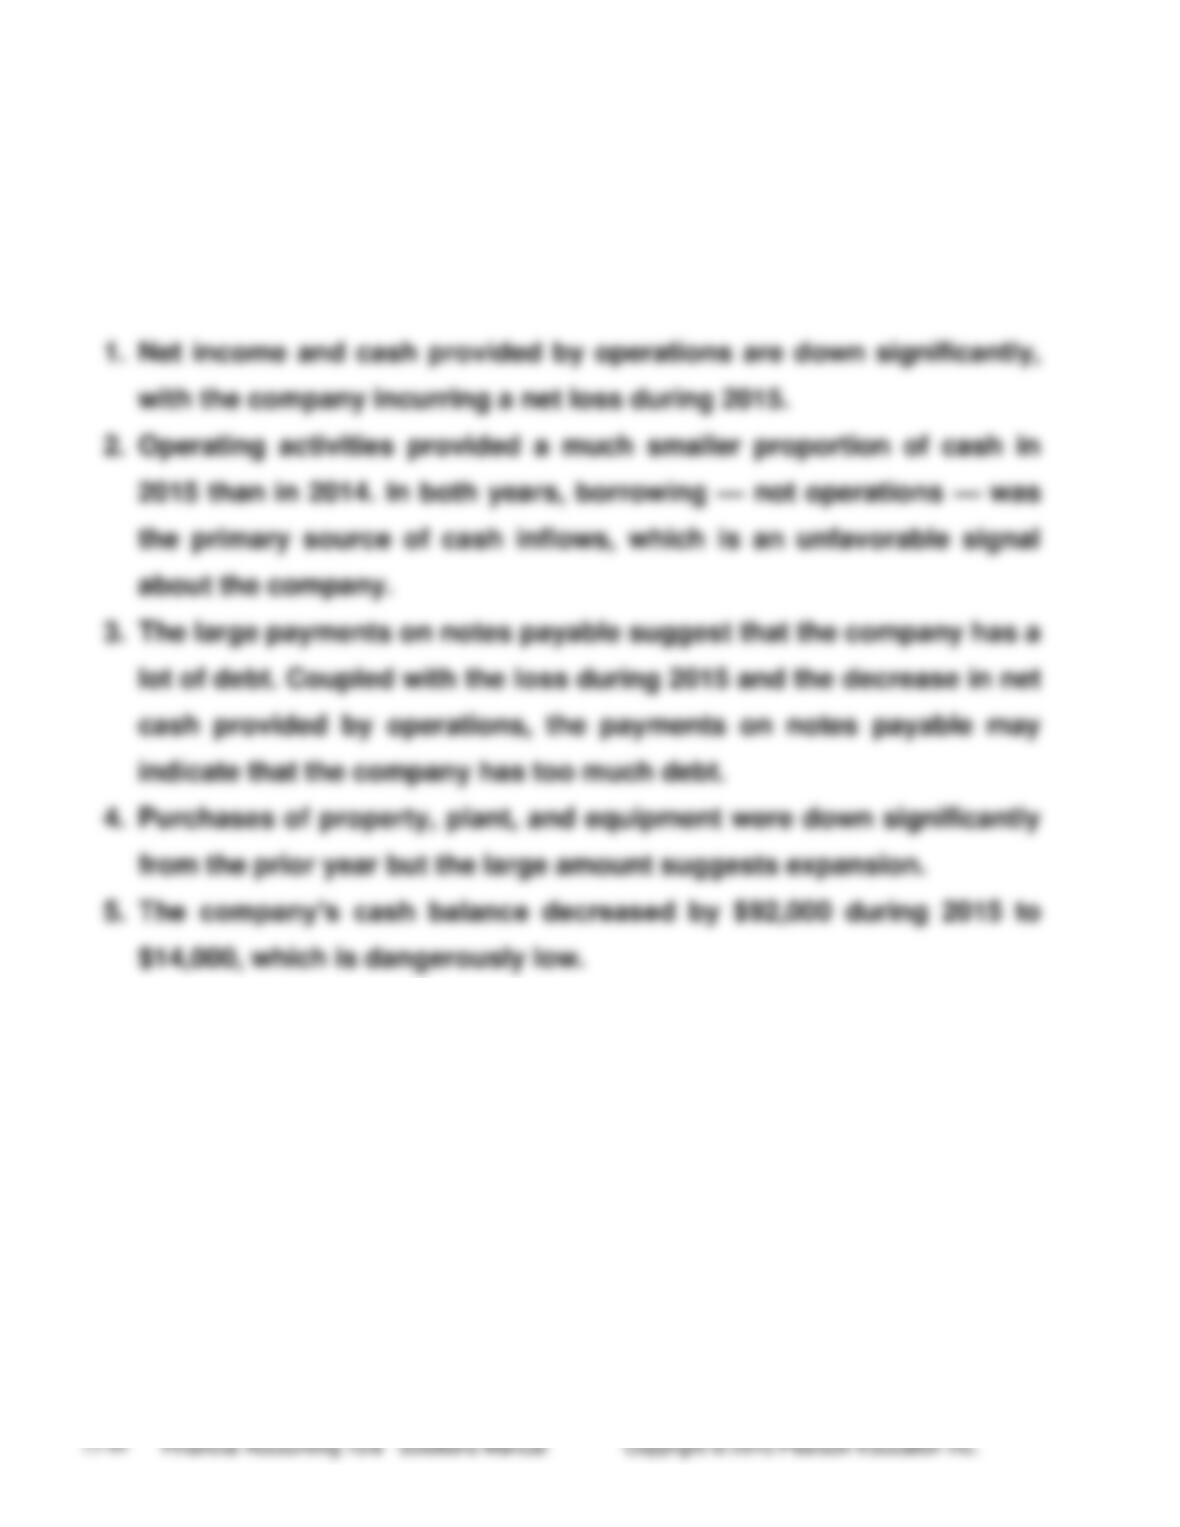
(20-30 min.) P 13-51A
West Coast Airline’s statement of cash flows reveals only one strong
point, a continuing purchase of plant assets. The company’s
weaknesses include: