Chapter 13
Financial Statement Analysis
Short Exercises
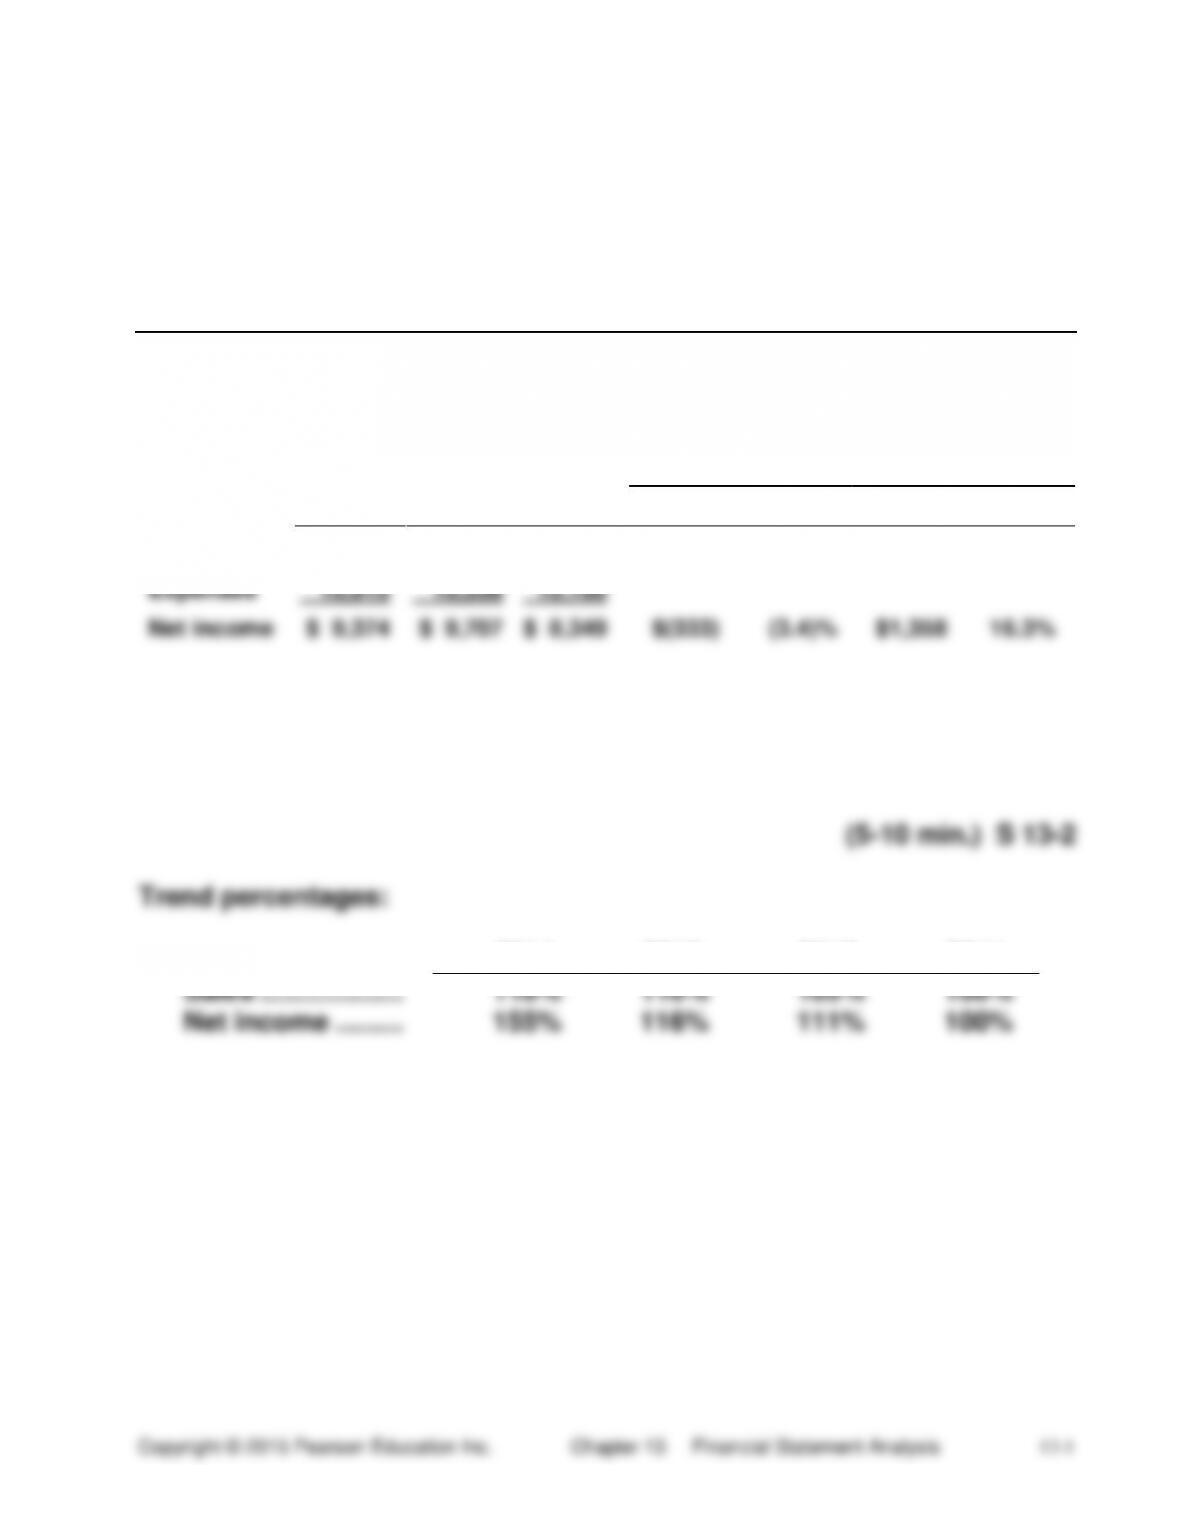
(5-10 min.) S 13-1
Increase (Decrease)
(Dollars in thousands)
2014
2013
2014
2013
2012
Amount
Percent
Amount
Percent
Revenues
$20,289
$20,045
$18,449
$244
1.2%
$1,596
8.7%
Expenses
10,915
10,338
10,100
Net income
$ 9,374
$ 9,707
$ 8,349
$(333)
(3.4)%
$1,358
16.3%
(5-10 min.) S 13-2
Trend percentages:
2014
2013
2012
2011
Sales ……………….
118%
110%
105%
100%
Net income ………
155%
116%
111%
100%
(10-15 min.) S 13–3
2014
2013
2012
Amount
Percent
Amount
Percent
Amount
Percent
Cash
$ 19,200
3.3%
$ 13,600
2.6%
$ 11,340
2.4%
Receivables, net
34,700
6.0
20,800
4.0
23,900
5.1
Inventory
266,800
46.3
197,600
38.2
148,180
31.2
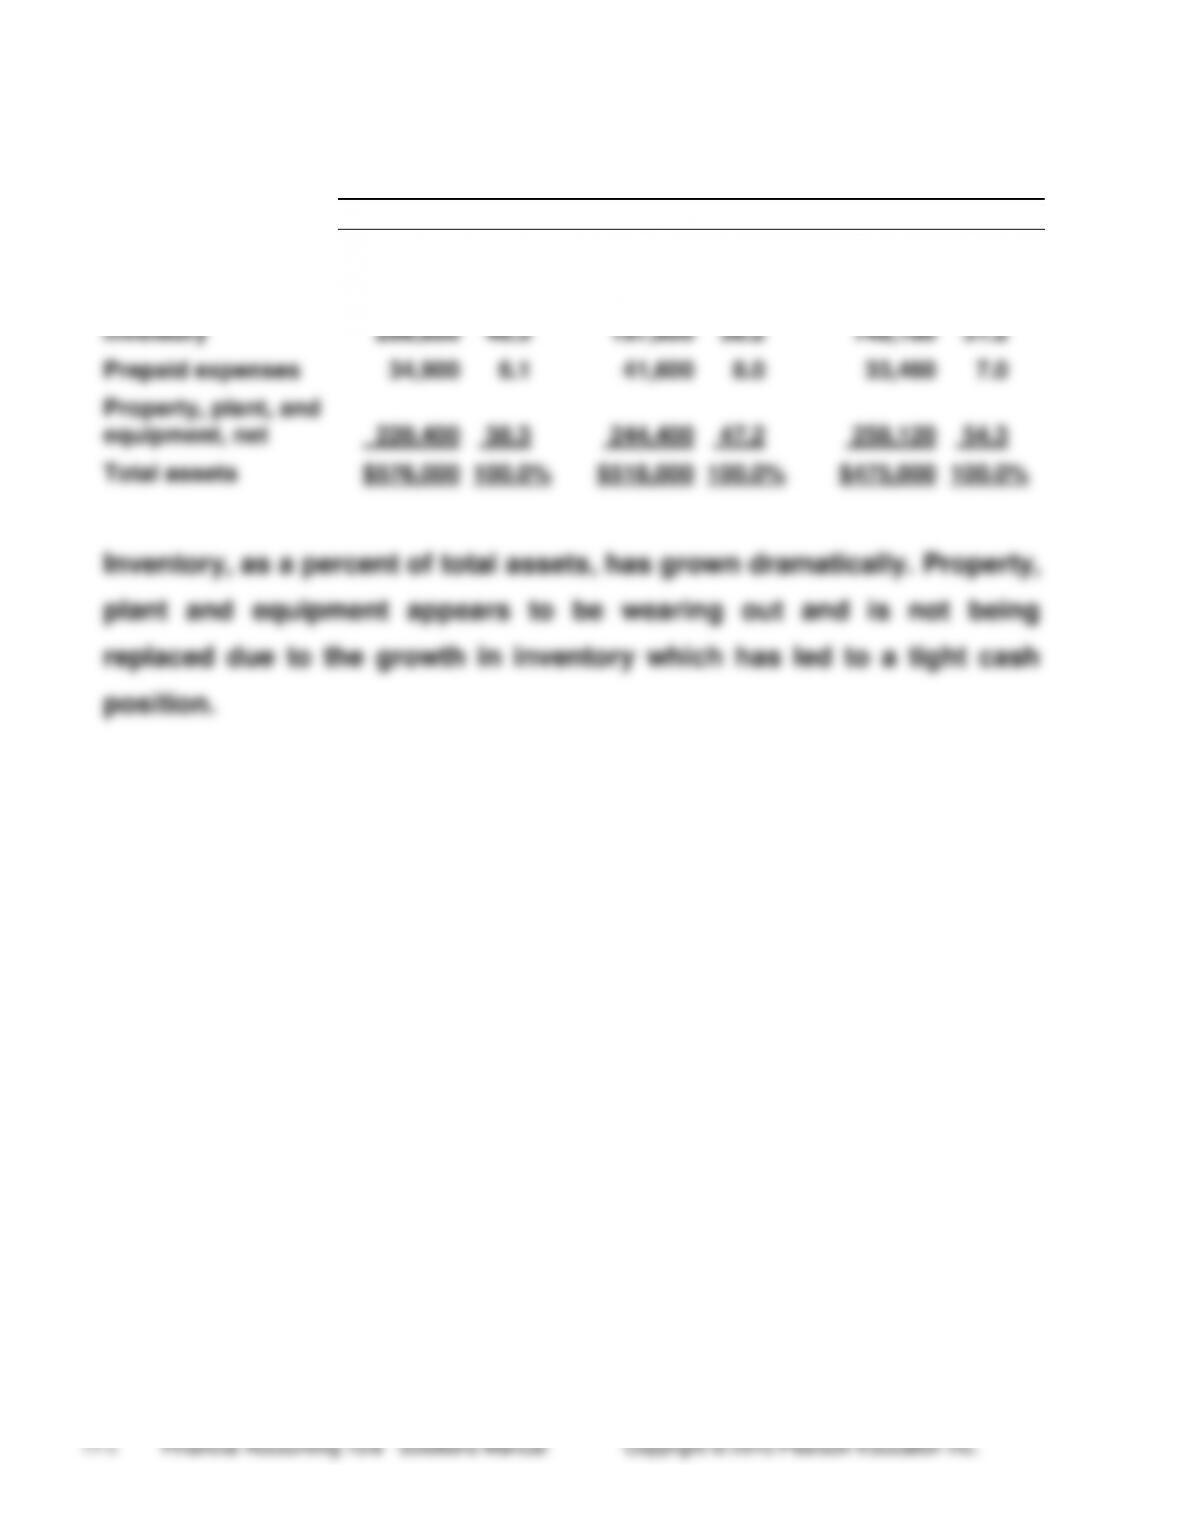
Prepaid expenses
34,900
6.1
41,600
8.0
33,460
7.0
Property, plant, and
equipment, net
220,400
38.3
244,400
47.2
258,120
54.3
Total assets
$576,000
100.0%
$518,000
100.0%
$475,000
100.0%
Inventory, as a percent of total assets, has grown dramatically. Property,
plant and equipment appears to be wearing out and is not being
replaced due to the growth in inventory which has led to a tight cash
position.
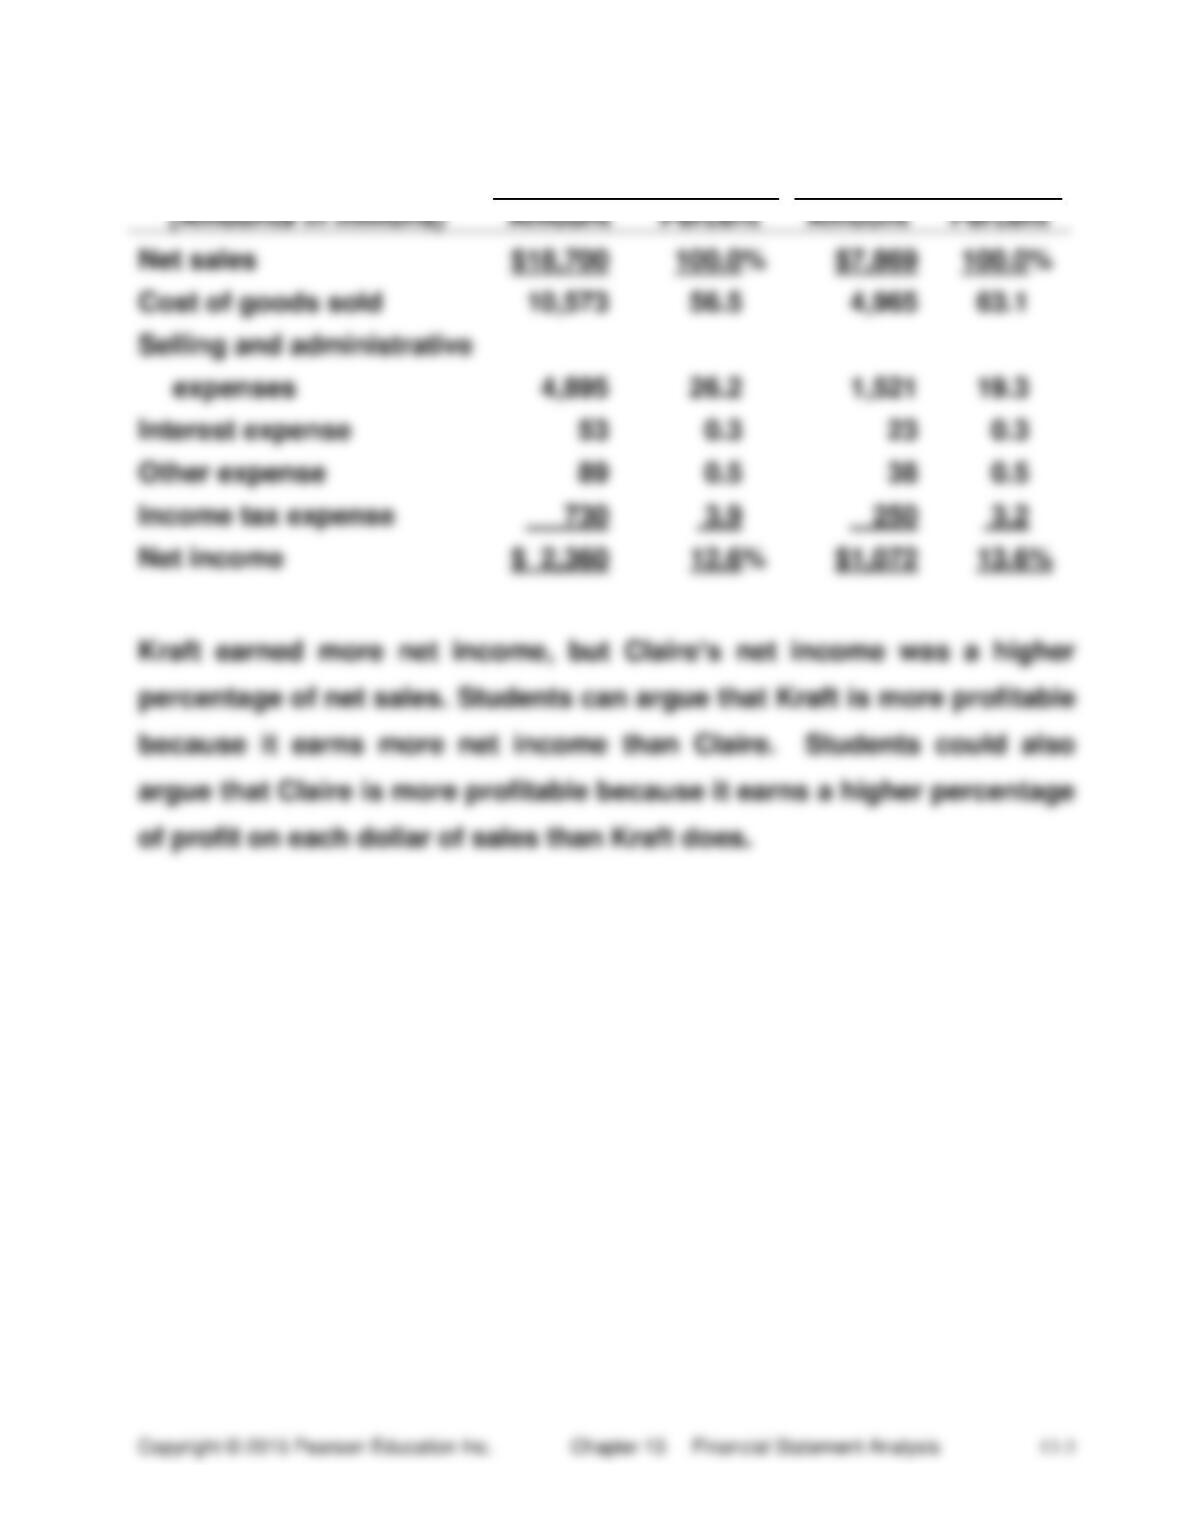
(10 min.) S 13-4
Kraft
Claire
(Amounts in millions)
Amount
Percent
Amount
Percent
Net sales
$18,700
100.0%
$7,869
100.0%
Cost of goods sold
10,573
56.5
4,965
63.1
Selling and administrative
expenses
4,895
26.2
1,521
19.3
Interest expense
53
0.3
23
0.3
Other expense
89
0.5
38
0.5
Income tax expense
730
3.9
250
3.2
Net income
$ 2,360
12.6%
$1,072
13.6%
Kraft earned more net income, but Claire’s net income was a higher
percentage of net sales. Students can argue that Kraft is more profitable
because it earns more net income than Claire. Students could also
argue that Claire is more profitable because it earns a higher percentage
of profit on each dollar of sales than Kraft does.
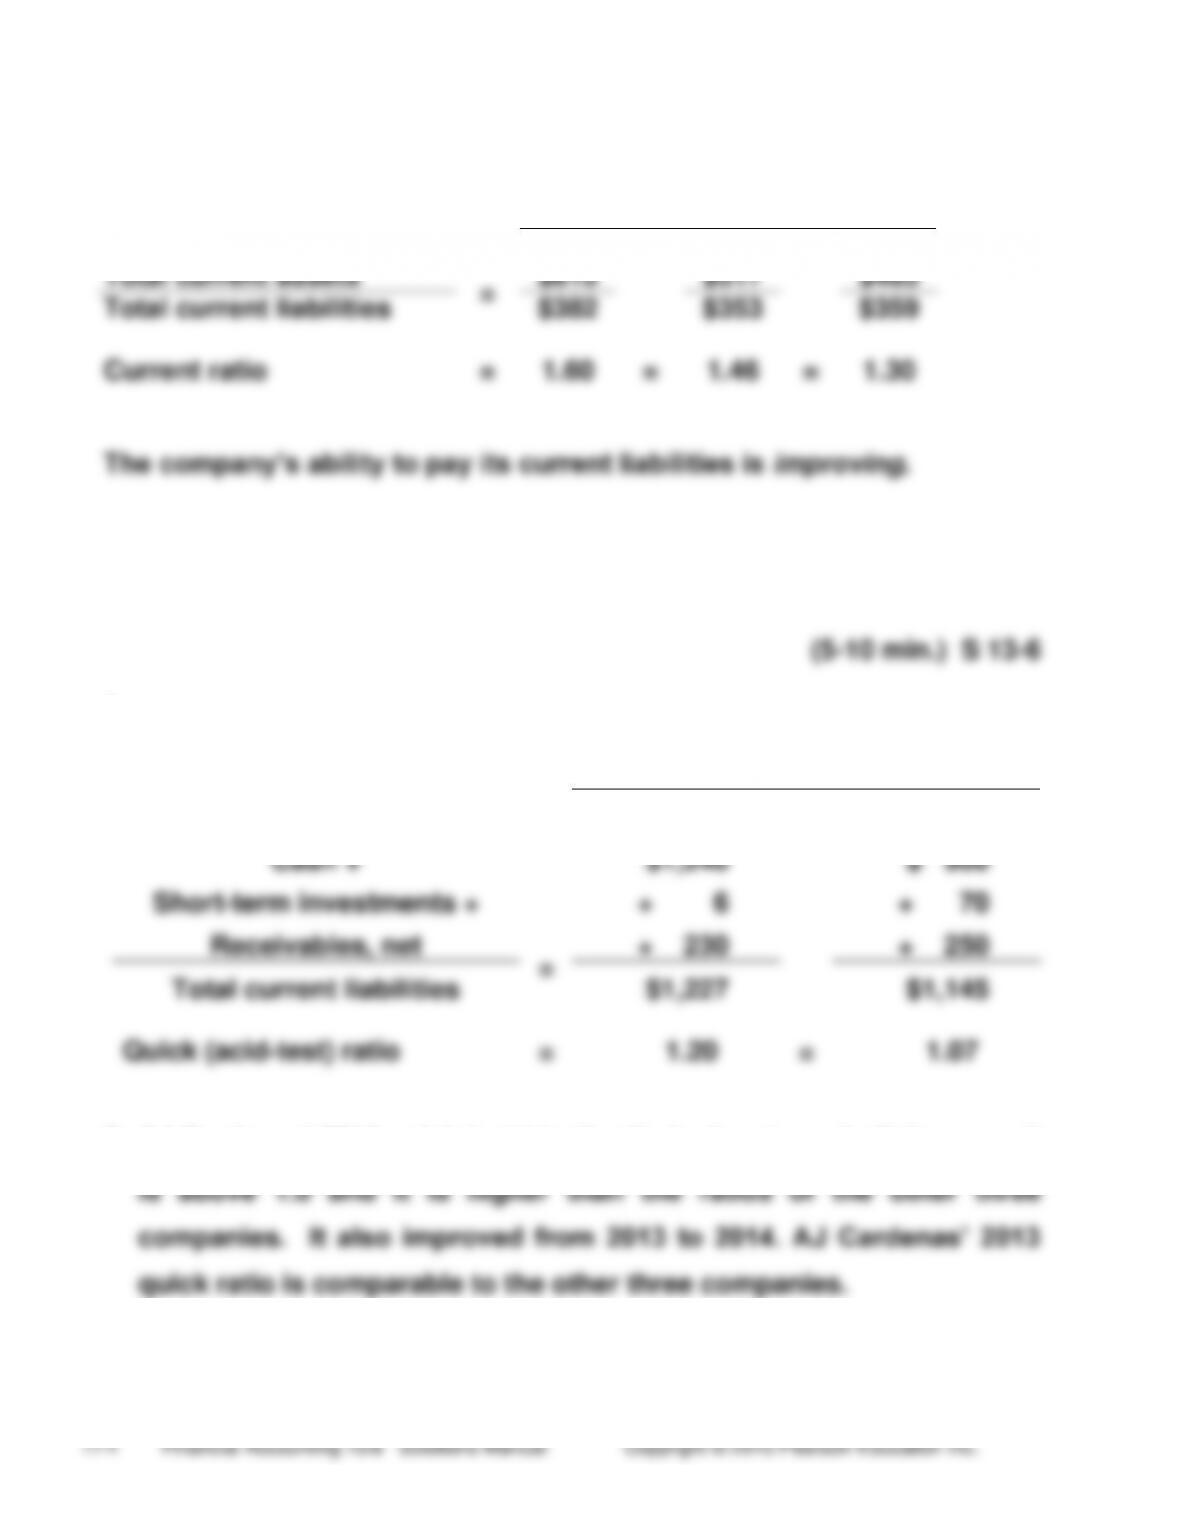
(5-10 min.) S 13-5
2014
2013
2012
Total current assets
=
$610
$517
$465
Total current liabilities
$382
$353
$359
Current ratio
=
1.60
=
1.46
=
1.30
The company’s ability to pay its current liabilities is improving.
(5-10 min.) S 13-6
1.
(Dollar amounts in millions)
2014
2013
Cash +
$1,240
$ 900
Short-term investments +
+ 6
+ 70
Receivables, net
=
+ 230
+ 250
Total current liabilities
$1,227
$1,145
Quick (acid-test) ratio
=
1.20
=
1.07
2. AJ Cardenas’ 2014 quick (acid-test) ratio looks strong both because it
(10-15 min.) S 13–7
(Dollar amounts in millions)
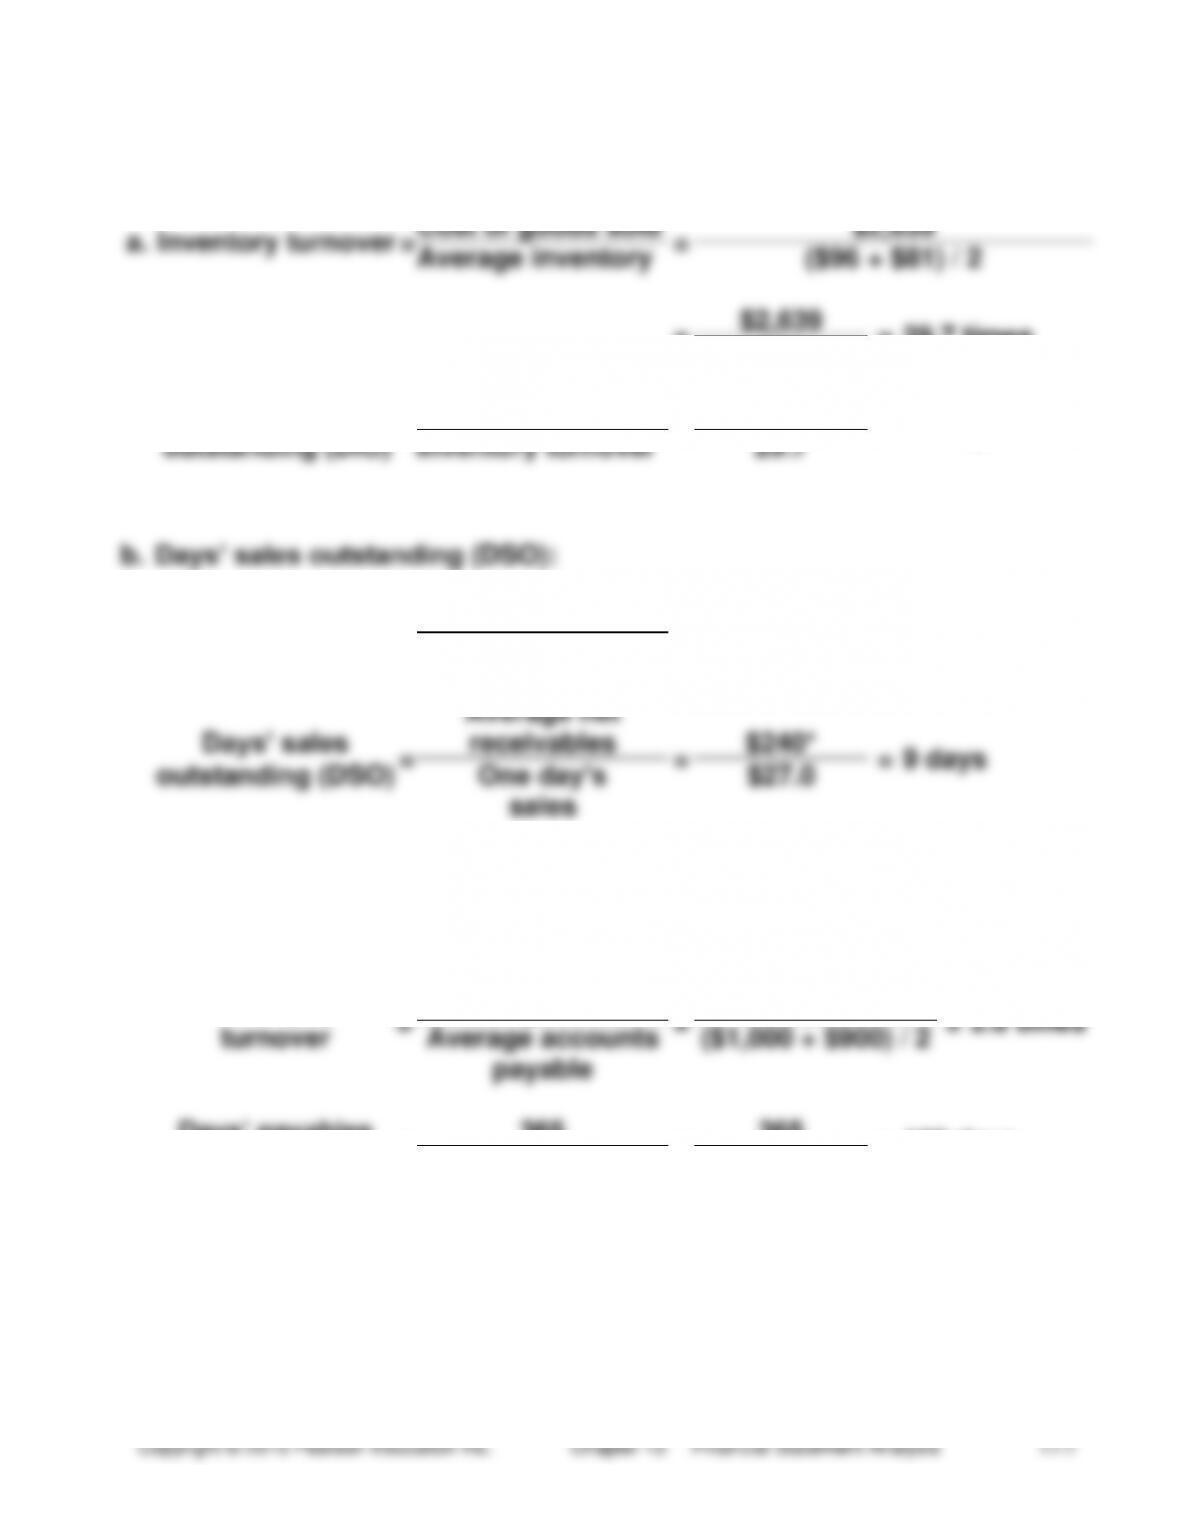
a.
Inventory turnover
=
Cost of goods sold
=
$2,639
Average inventory
($96 + $81) / 2
=
$2,639
=
29.7 times
$89
Days’ inventory
=
365
=
365
=
12 days
outstanding (DIO)
Inventory turnover
29.7
b.
Days’ sales outstanding (DSO):
One day’s
=
$9,840
=
$27.0
sales
365
Average net
Days’ sales
=
receivables
=
$240*
=
9 days
outstanding (DSO)
One day’s
$27.0
sales
____
*($230 + $250) / 2 = $240
c. Days’ payables outstanding:
Accounts payable
=
Cost of goods sold
=
$2,639
=
2.8 times
turnover
Average accounts
payable
($1,000 + $900) / 2
Days’ payables
=
365
=
365
=
130 days
outstanding (DPO)
Accounts payable
turnover
2.8
(continued) S 13-7
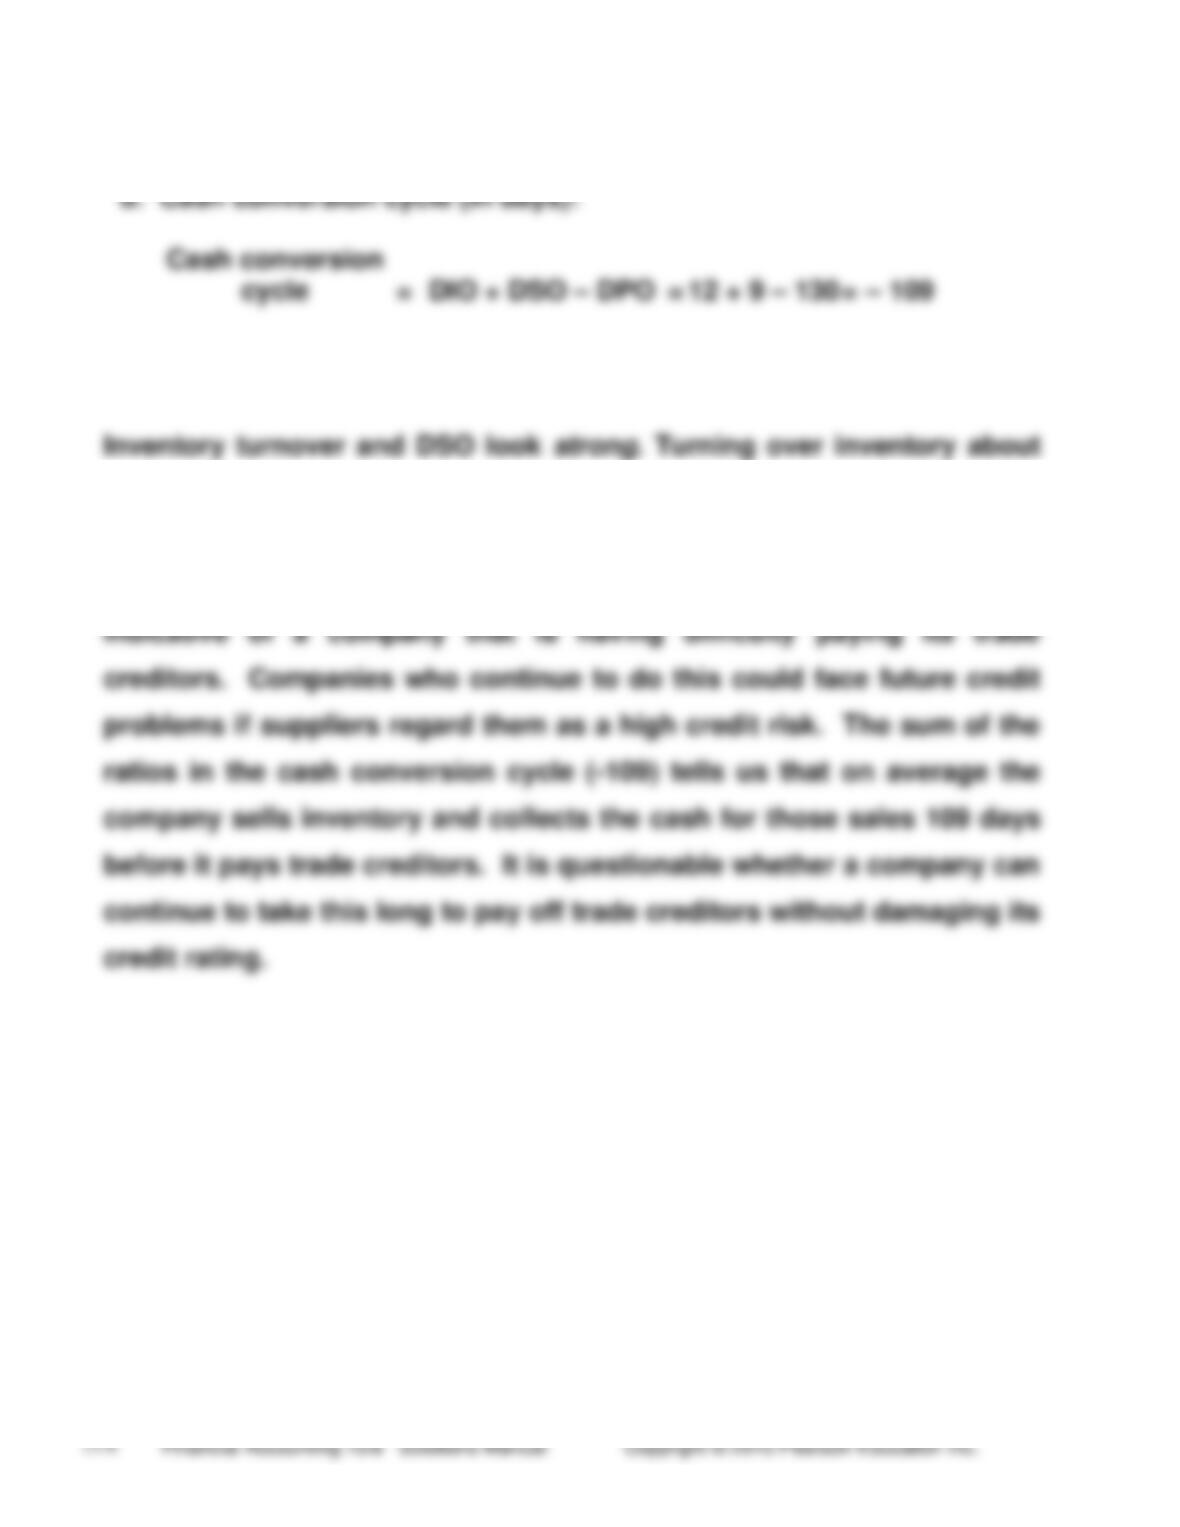
d. Cash conversion cycle (in days):
Cash conversion
=
DIO + DSO – DPO
=
12 + 9 – 130
=
– 109
cycle
Inventory turnover and DSO look strong. Turning over inventory about
30 times per year (every 12 days) is fast, and collecting average
receivables in only 9 days is also very fast. However, the company is
taking 130 days to pay off its accounts payable. This is quite slow,
(5-10 min.) S 13-8
(Dollar amounts in millions)
1.
Debt ratio
=
Total liabilities
=
$5,844
=
0.804
Total assets
$7,265
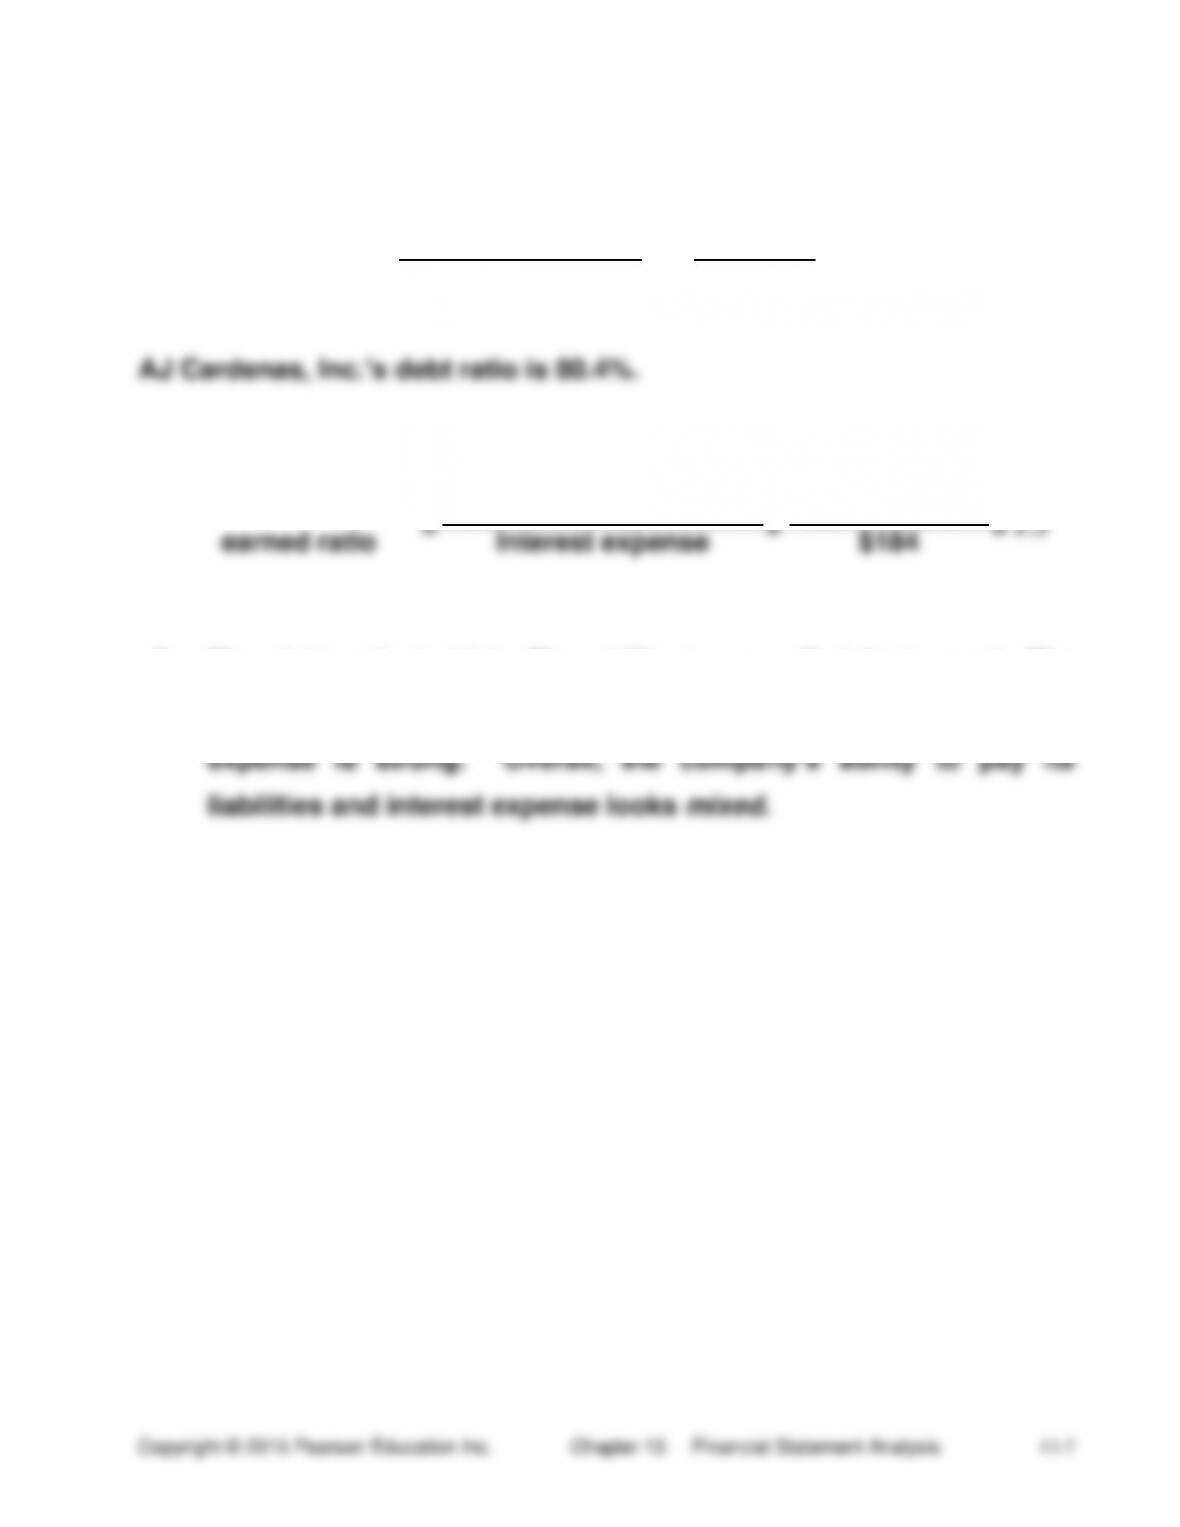
2.
Times-interest-
=
Income from operations
=
$1,230 + $184
=
7.7
earned ratio
Interest expense
$184
3. The debt ratio is high. The ability to pay off debt is weak. The
times-interest-earned ratio is high. The ability to pay interest
(10 min.) S 13-9
(Dollar amounts in millions)
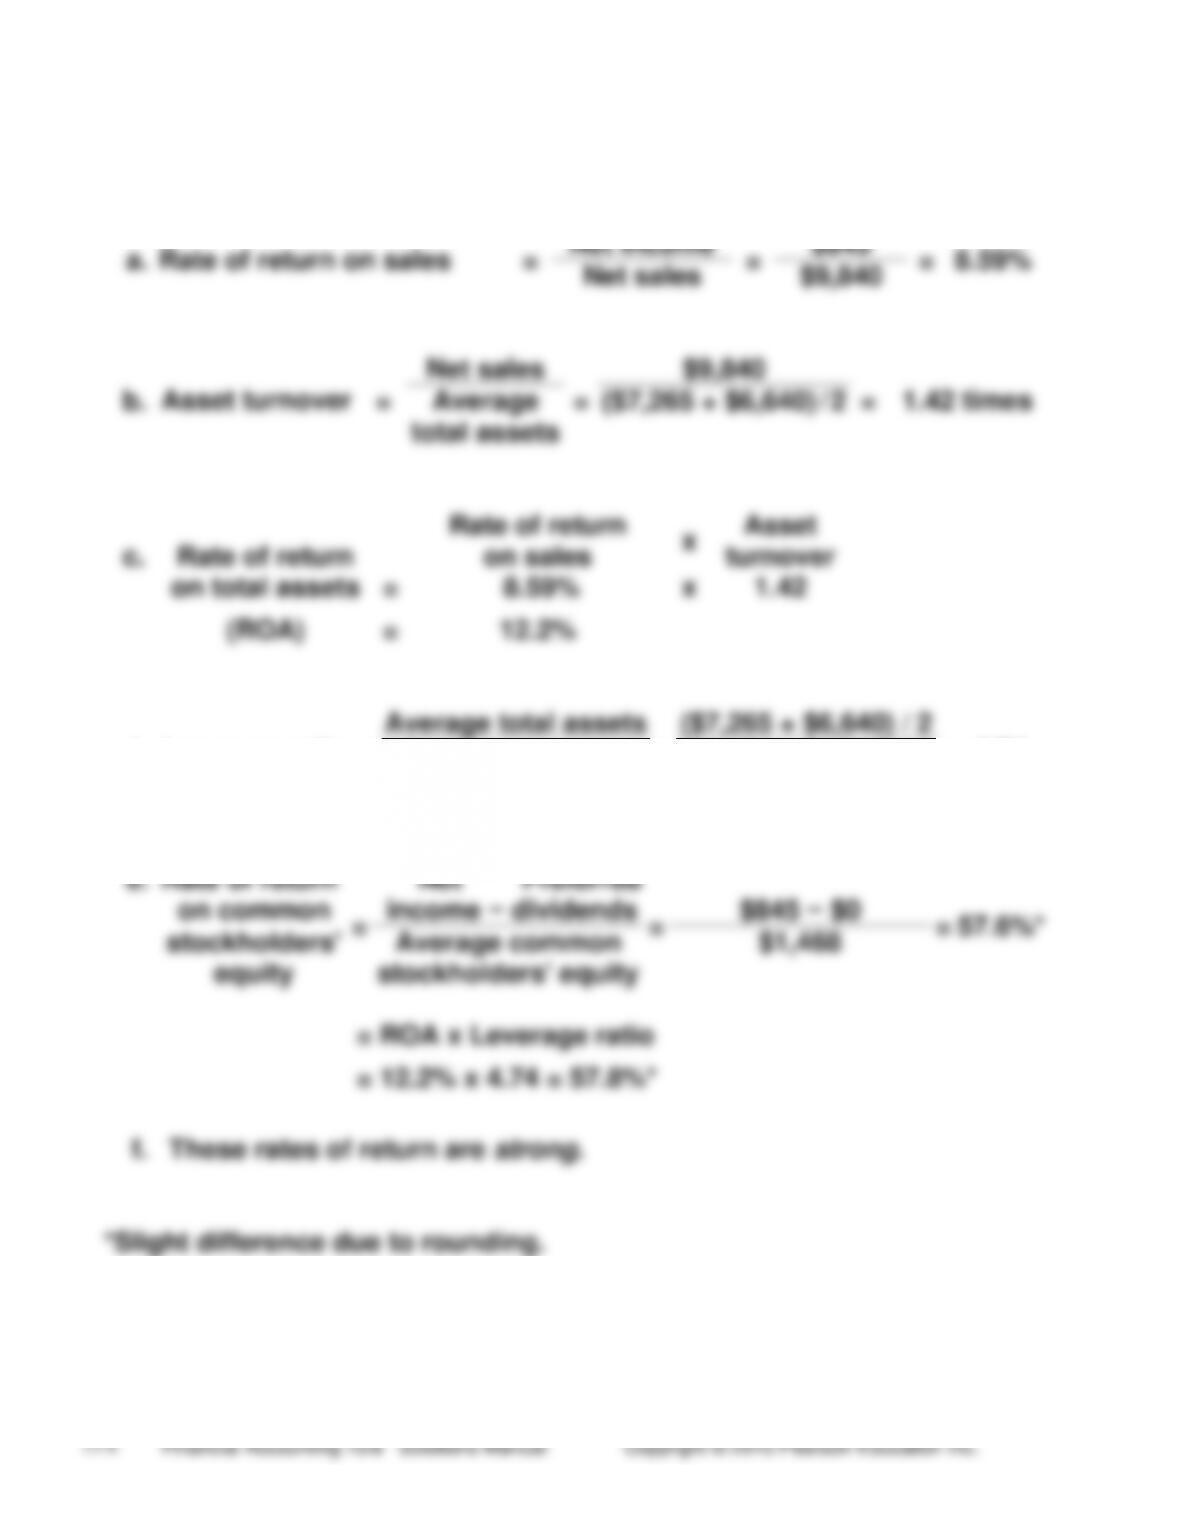
a.
Rate of return on sales
=
Net income
=
$845
=
8.59%
Net sales
$9,840
Asset turnover
=
Net sales
=
$9,840
=
1.42 times
b.
Average
total assets
($7,265 + $6,640) / 2
c.
Rate of return
Rate of return
on sales
x
Asset
turnover
on total assets
=
8.59%
x
1.42
(ROA)
=
12.2%
Leverage ratio
=
Average total assets
=
($7,265 + $6,640) / 2
=
4.74
d.
Average common
stockholders’ equity
($1,421 + $1,515) / 2
e.
Rate of return
Net Preferred
on common
=
income − dividends
=
$845 − $0
=
57.6%*
stockholders’
Average common
$1,468
equity
stockholders’ equity
= ROA x Leverage ratio
= 12.2% x 4.74 = 57.8%*
f.
These rates of return are strong.
*Slight difference due to rounding.
(5-10 min.) S 13–10
(Amounts, except per-share amounts, in millions)
1.
EPS
=
Net income − Preferred dividends
Number of shares of common
=
$620 − $21*
700
stock outstanding
=
$.86
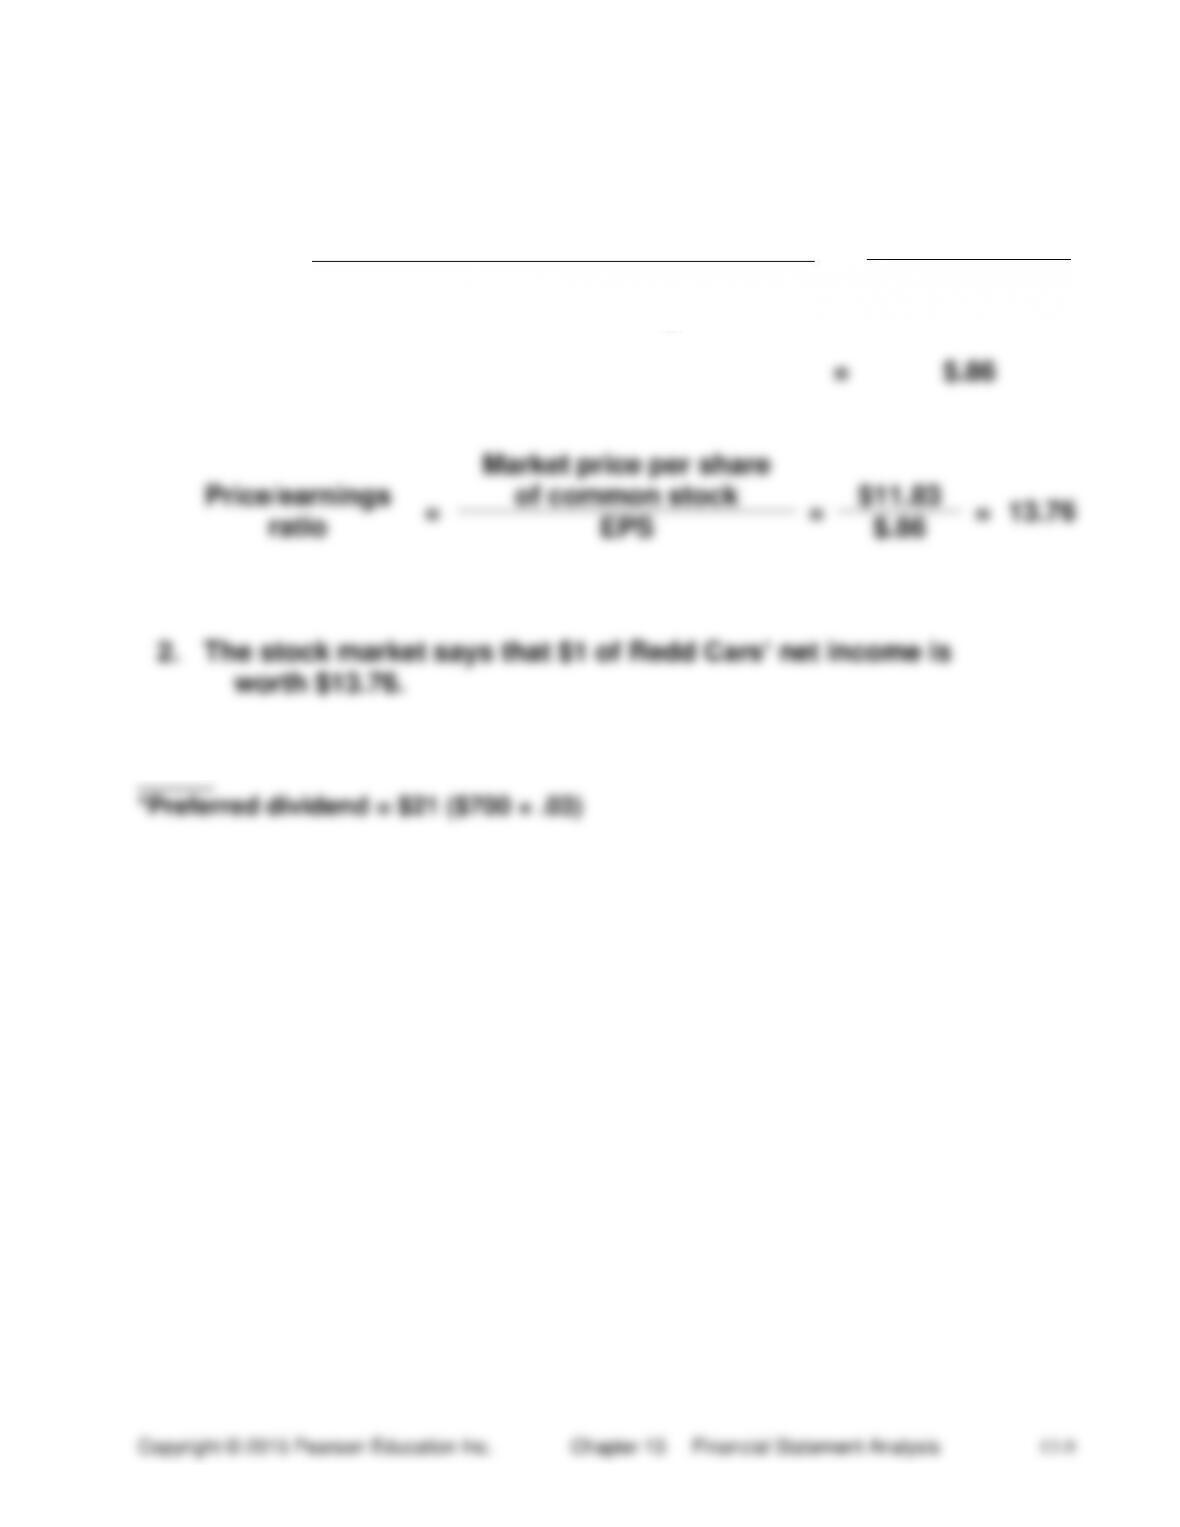
Market price per share
of common stock
Price/earnings
ratio
=
=
$11.83
=
13.76
EPS
$.86
2.
The stock market says that $1 of Redd Cars’ net income is
worth $13.76.
(10 min.) S 13–11
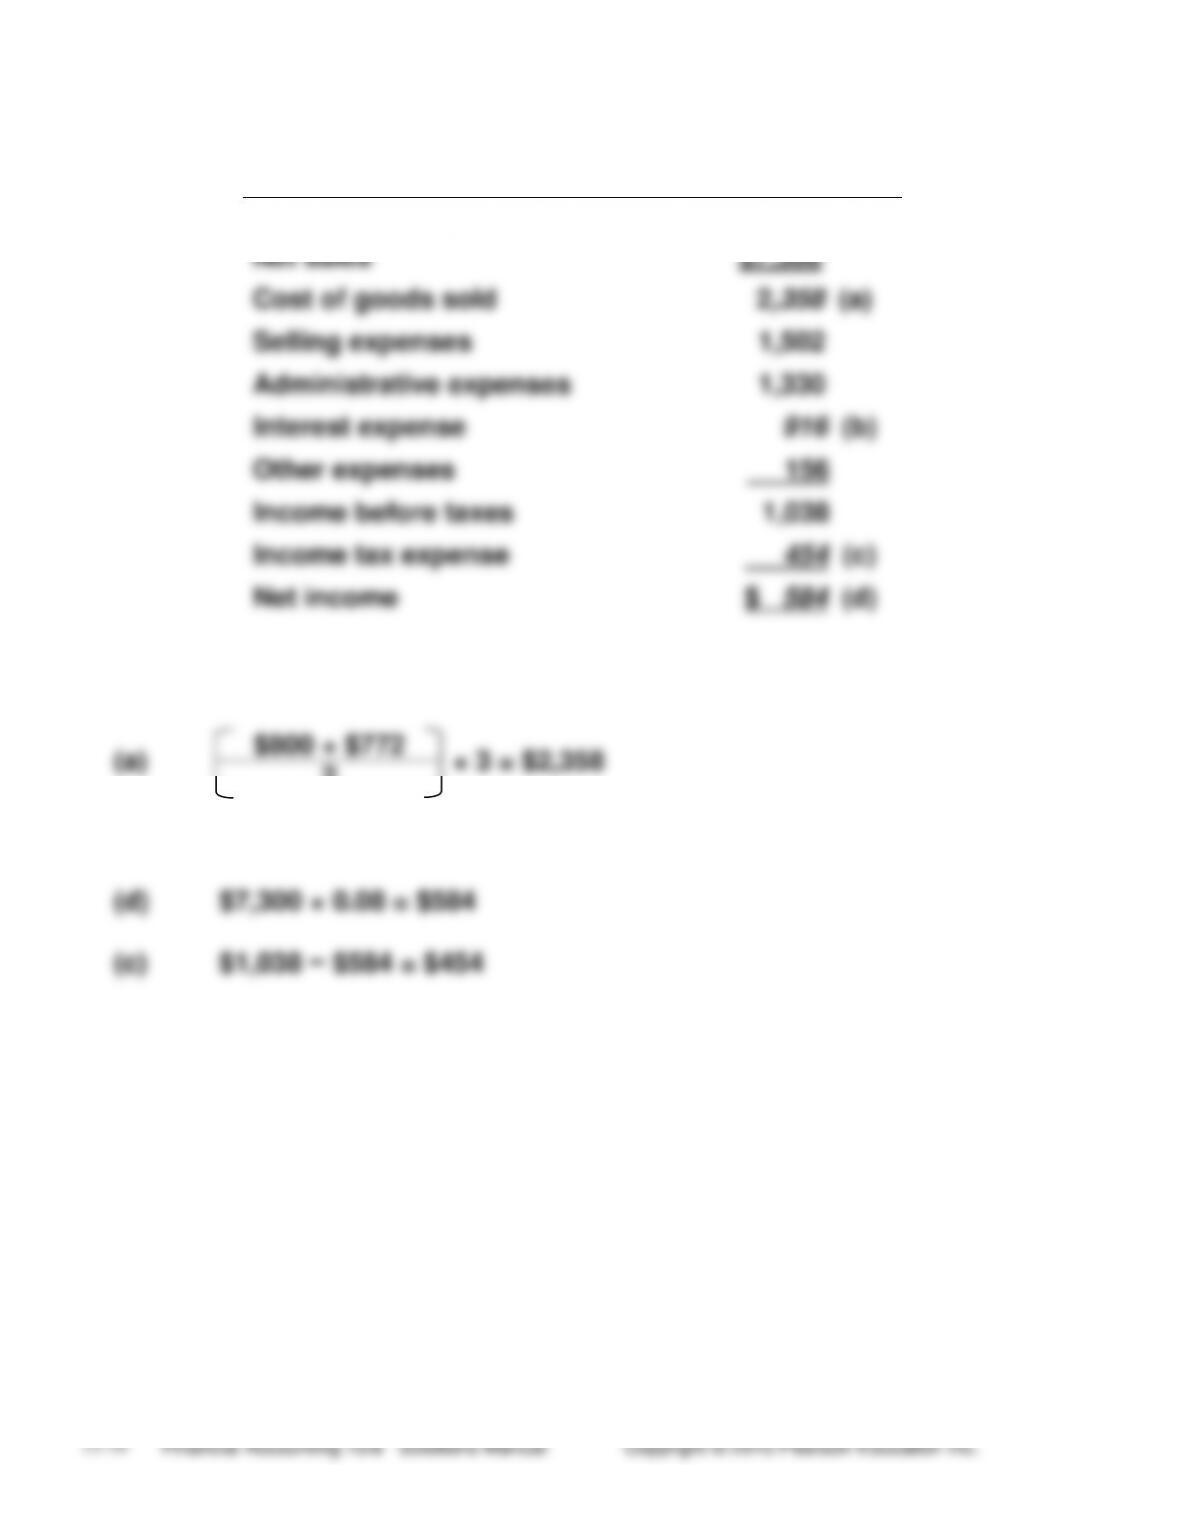
Income Statement
Thousands
Net sales
$7,300
Cost of goods sold
2,358 (a)
Selling expenses
1,502
Administrative expenses
1,330
Interest expense
916 (b)
Other expenses
156
Income before taxes
1,038
Income tax expense
454 (c)
Net income
$ 584 (d)
(a)
$800 + $772
× 3 = $2,358
2
(b)
$7,300 − $2,358 − $1,502 − $1,330 − $156 − $1,038 = $916
(d)
$7,300 × 0.08 = $584
(c)
$1,038 − $584 = $454
(15-20 min.) S 13–12
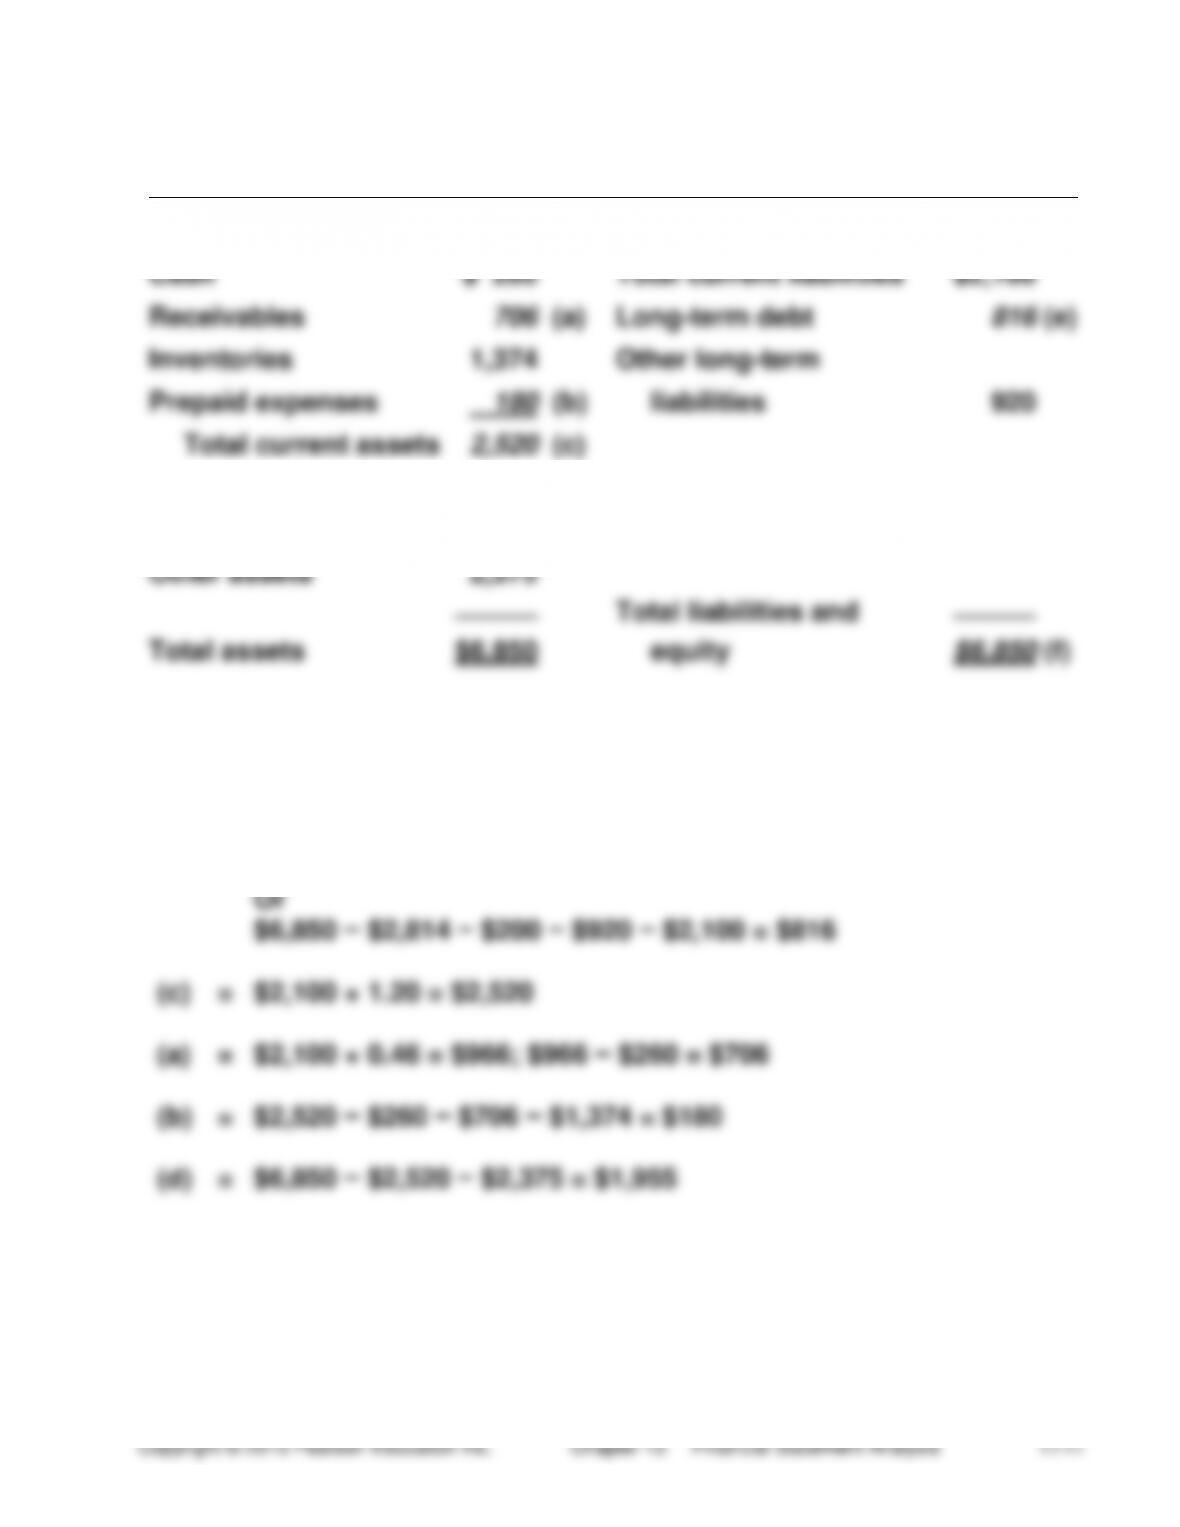
Balance Sheet
(Dollars in thousands)
Cash
$ 260
Total current liabilities
$2,100
Receivables
706 (a)
Long-term debt
816 (e)
Inventories
1,374
Other long-term
Prepaid expenses
180 (b)
liabilities
920
Total current assets
2,520 (c)
Common stock
200
Plant assets, net
1,955 (d)
Retained earnings
2,814
Other assets
2,375
Total liabilities and
Total assets
$6,850
equity
$6,850 (f)
(f)
=
$6,850 (same as total assets)
(e)
=
$6,850 × 0.56 = $3,836
$3,836 − $2,100 − $920 = $816
Or
$6,850 − $2,814 − $200 − $920 − $2,100 = $816
(c)
=
$2,100 × 1.20 = $2,520
(a)
=
$2,100 × 0.46 = $966; $966 − $260 = $706
(b)
=
$2,520 − $260 − $706 − $1,374 = $180
(d)
=
$6,850 − $2,520 − $2,375 = $1,955
(15-20 min.) S 13–13
TO: Cole Binder Investment Committee
FROM: Student Name
SUBJECT: Investment Recommendation
I recommend that we invest in Tower.org for the following reasons:
1. Tower.org’s. return on equity (ROE) is 5% higher than Graphics
Imaging’s. An investment in Tower.org should therefore produce a
higher return than an investment in Graphics Imaging’s stock.
2. Tower.org’s ROE exceeds its return on assets by a wider margin than
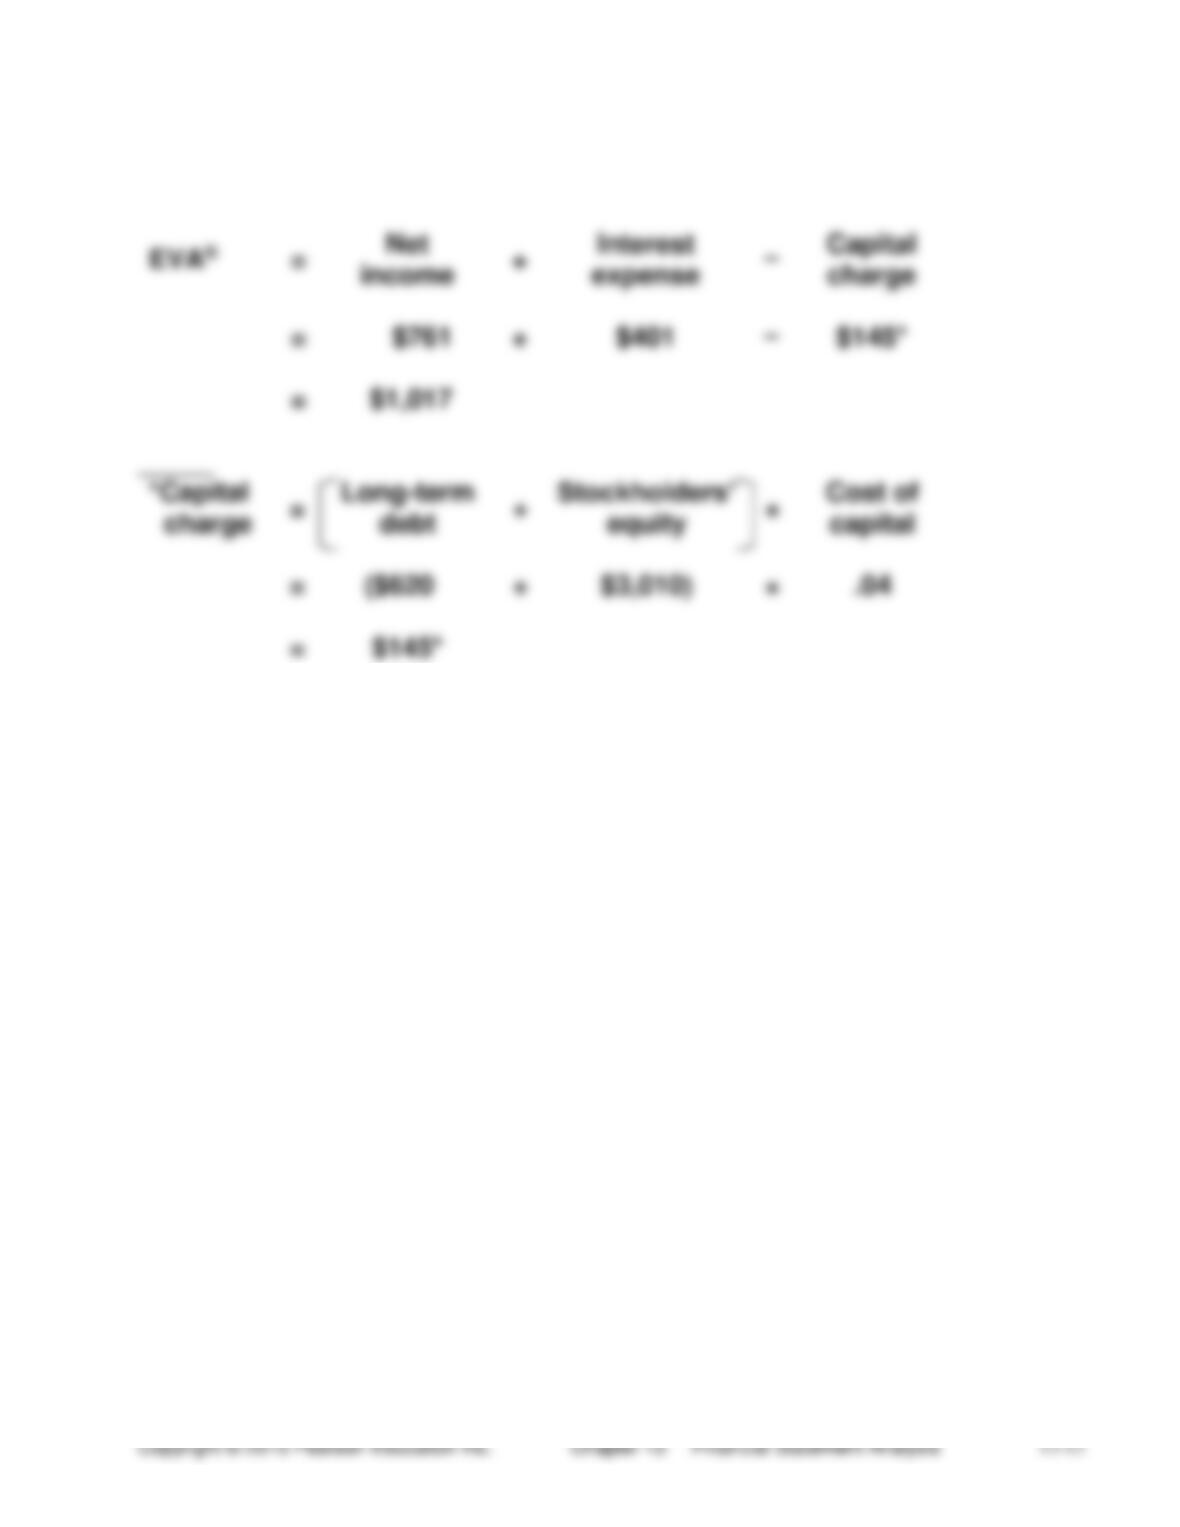
(10 min.) S 13-14
(Dollars in thousands)
EVA®
=
Net
+
Interest
−
Capital
income
expense
charge
=
$761
+
$401
−
$145*
=
$1,017
_____
*Capital
=
Long-term
+
Stockholders’
×
Cost of
charge
debt
equity
capital
=
($620
+
$3,010)
×
.04
=
$145*
The stockholders should be pleased with the EVA® that Schaeffer
Software delivered because it is positive, which meant value was
added.
Exercises
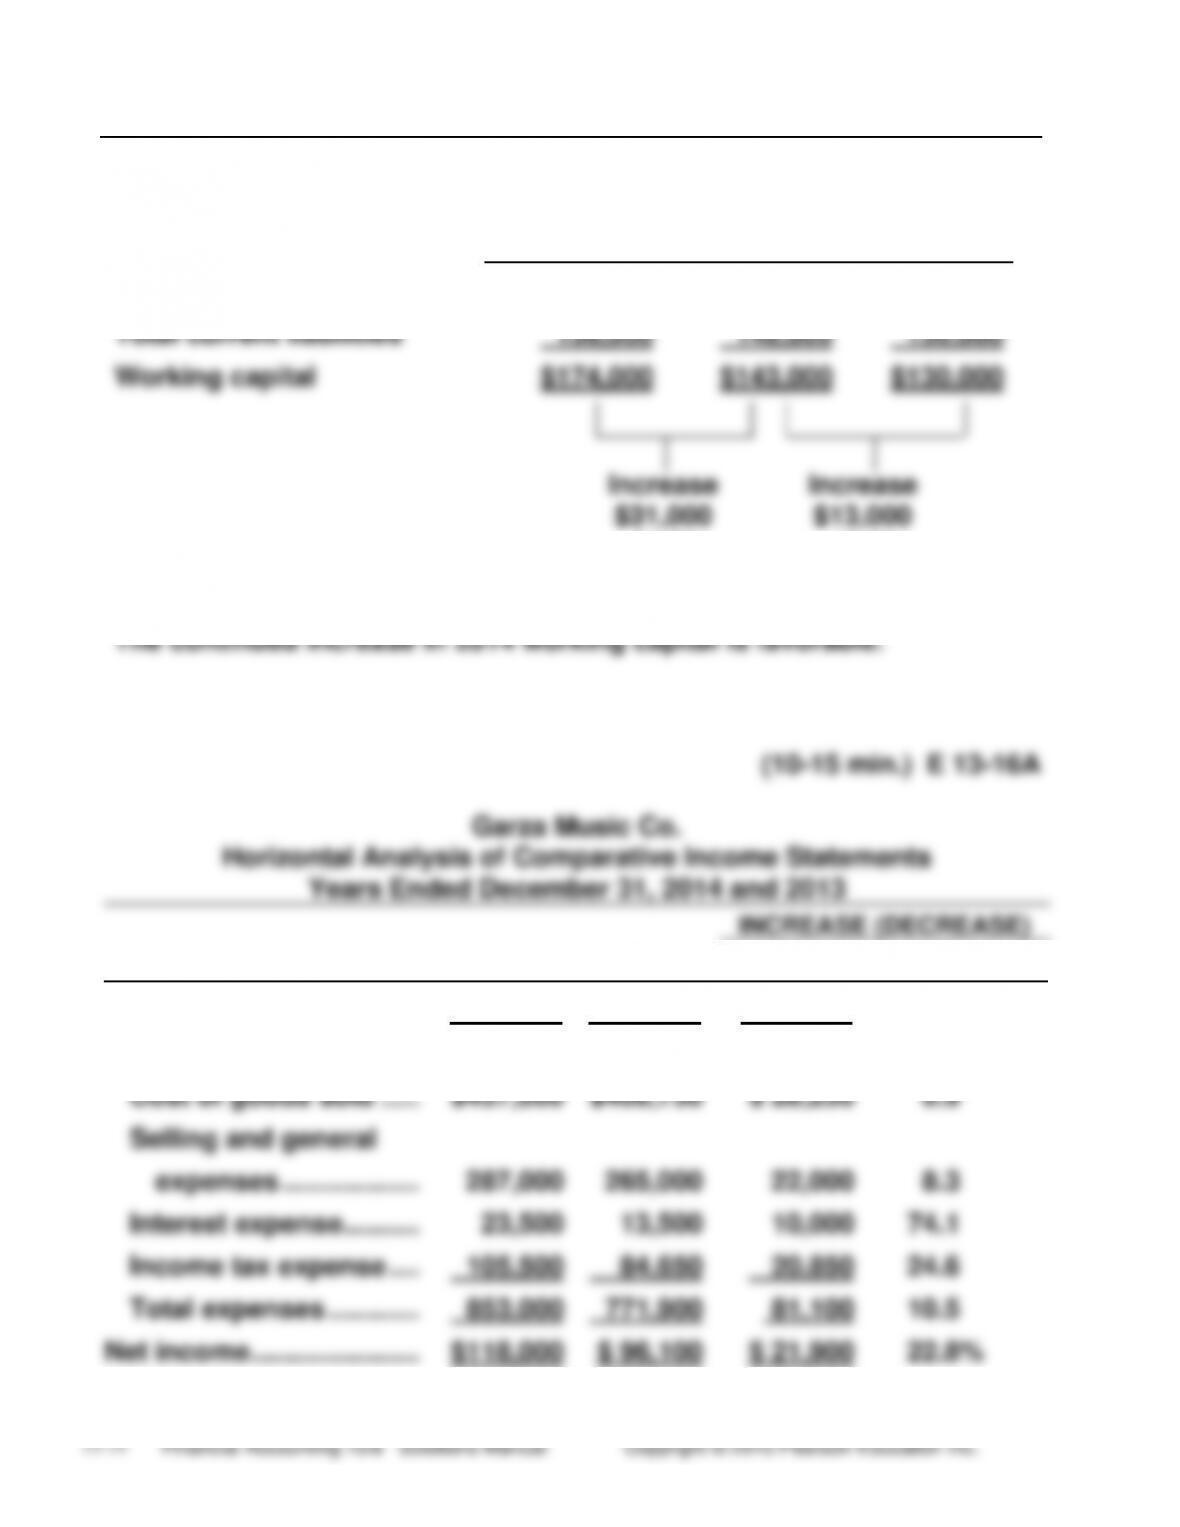
(5-15 min.) E 13-15A
2014
2013
2012
Total current assets
$330,000
$291,000
$260,000
Total current liabilities
156,000
148,000
130,000
Working capital
$174,000
$143,000
$130,000
Increase
Increase
$31,000
$13,000
21.7%
10.0%
The continued increase in 2014 working capital is favorable.
11.9%
23,500
24.6
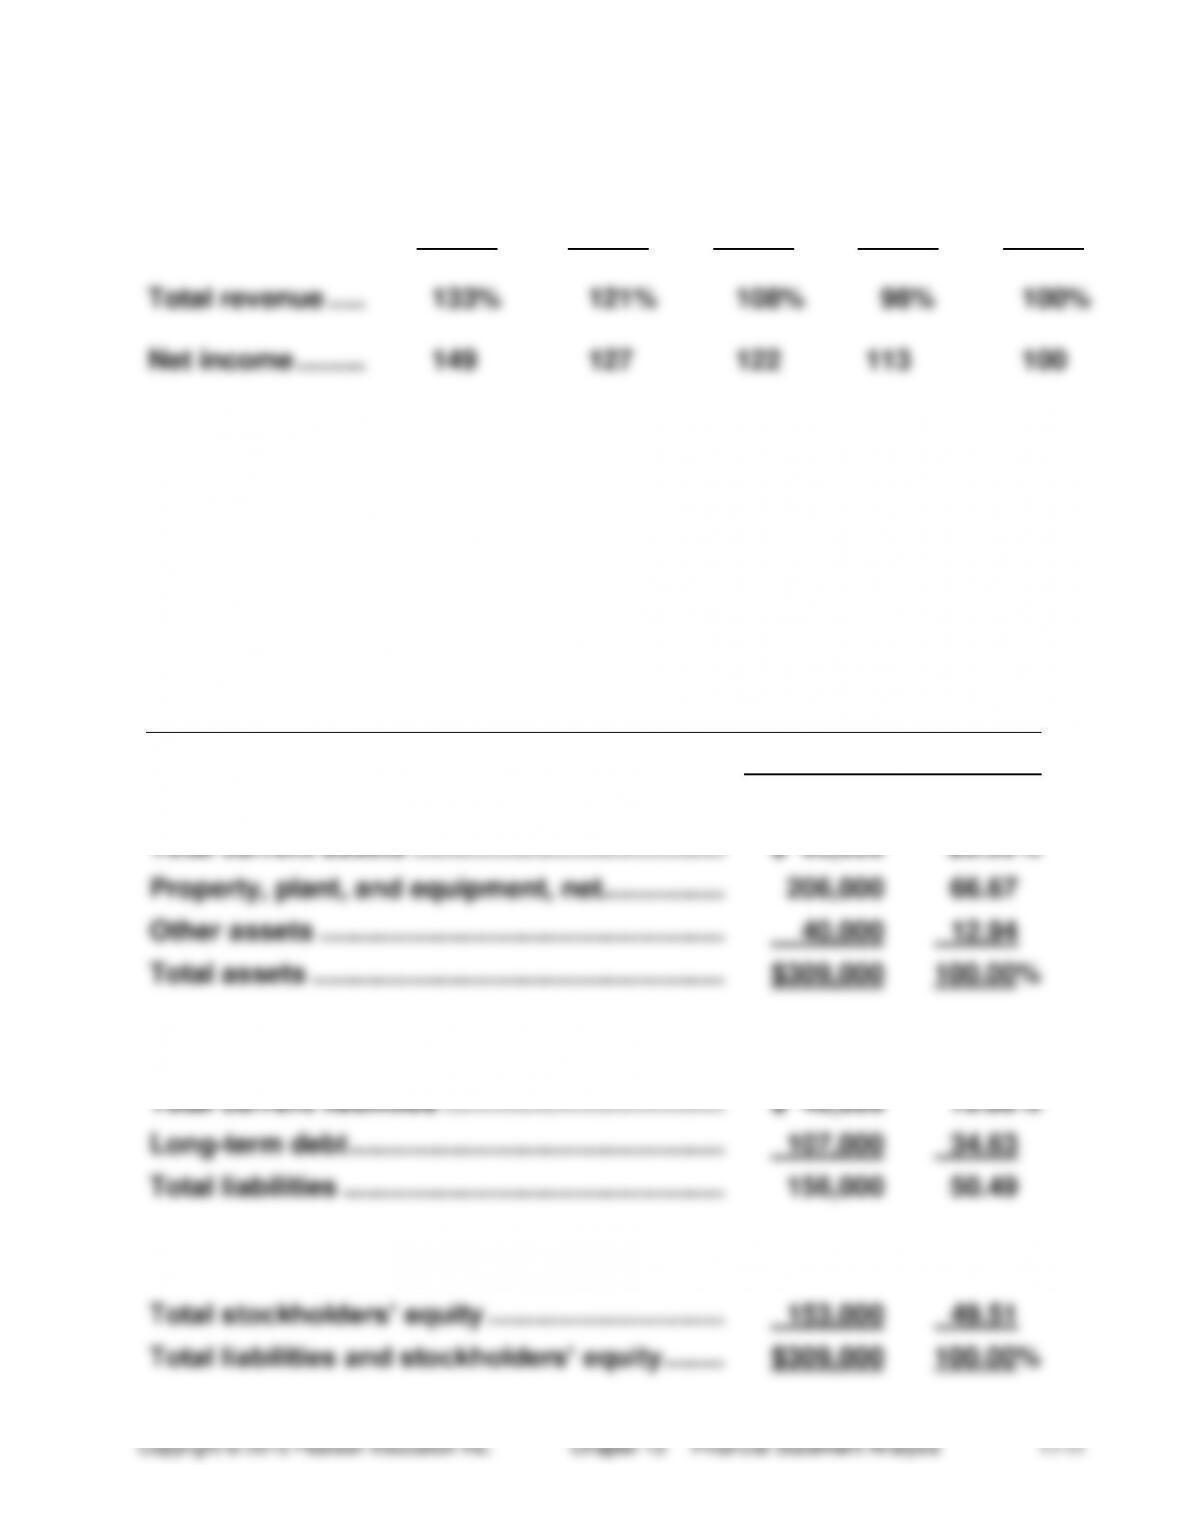
(5-10 min.) E 13-17A
Trend percentages:
Year 4
Year 3
Year 2
Year 1
Year 0
Total revenue …..
133%
121%
108%
98%
100%
Net income ………
149
127
122
113
100
Net income grew by 49% during the period, compared to 33% for total
revenue.
(10-15 min.) E 13-18A
Patterson Golf Company
Vertical Analysis of Balance Sheet
December 31, 2014
AMOUNT
PERCENT
ASSETS
Total current assets …………………………………..
$ 63,000
20.39%
Property, plant, and equipment, net …………….
206,000
66.67
Other assets ……………………………………………..
40,000
12.94
Total assets ………………………………………………
$309,000
100.00%
LIABILITIES
Total current liabilities ……………………………….
$ 49,000
15.86%
Long-term debt ………………………………………….
107,000
34.63
Total liabilities …………………………………………..
156,000
50.49
STOCKHOLDERS’ EQUITY
Total stockholders’ equity ………………………….
153,000
49.51
Total liabilities and stockholders’ equity ……..
$309,000
100.00%
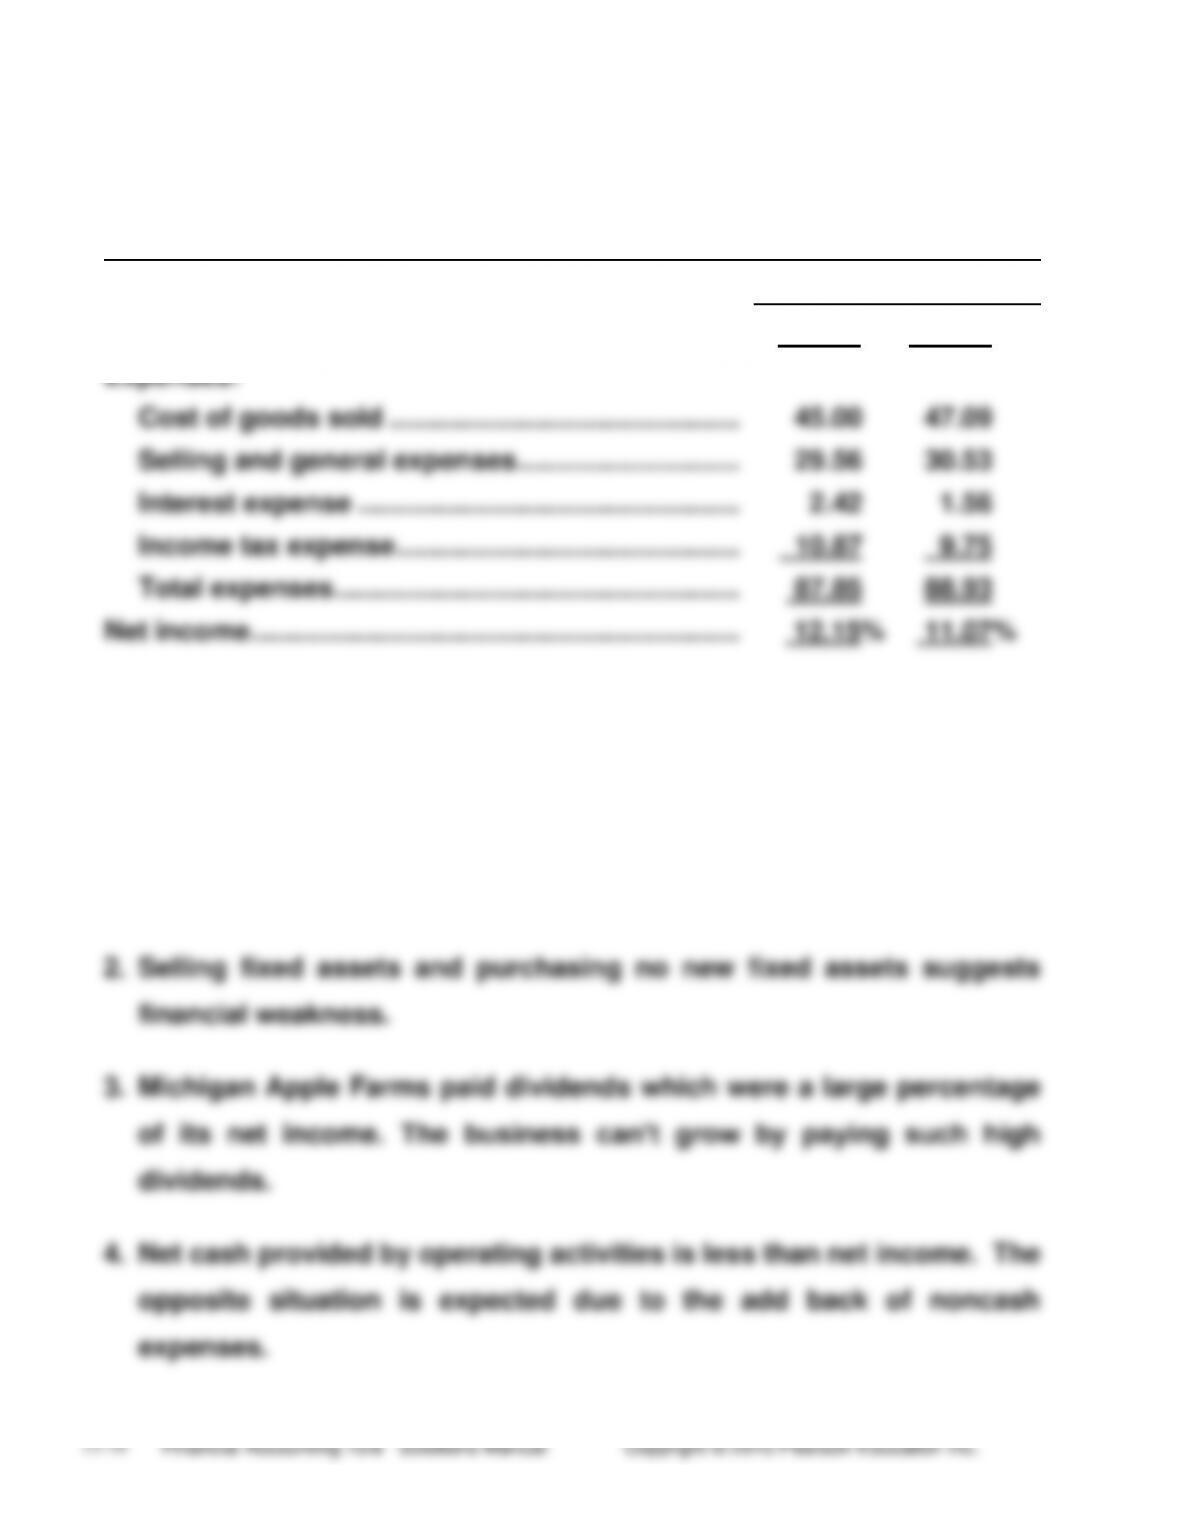
(10-15 min.) E 13-19A
Garza Music Co.
Comparative Common-Size Income Statements
Years Ended December 31, 2014 and 2013
2014
2013
Total revenue ……………………………………………………
100.00%
100.00%
Expenses:
Cost of goods sold ……………………………………….
45.00
47.09
Selling and general expenses ………………………..
29.56
30.53
Interest expense …………………………………………..
2.42
1.56
Income tax expense ………………………………………
10.87
9.75
Total expenses ……………………………………………..
87.85
88.93
Net income ……………………………………………………….
12.15%
11.07%
(10-15 min.) E 13-20A
1. Operations provided very little cash. The company is selling fixed
assets to generate cash.
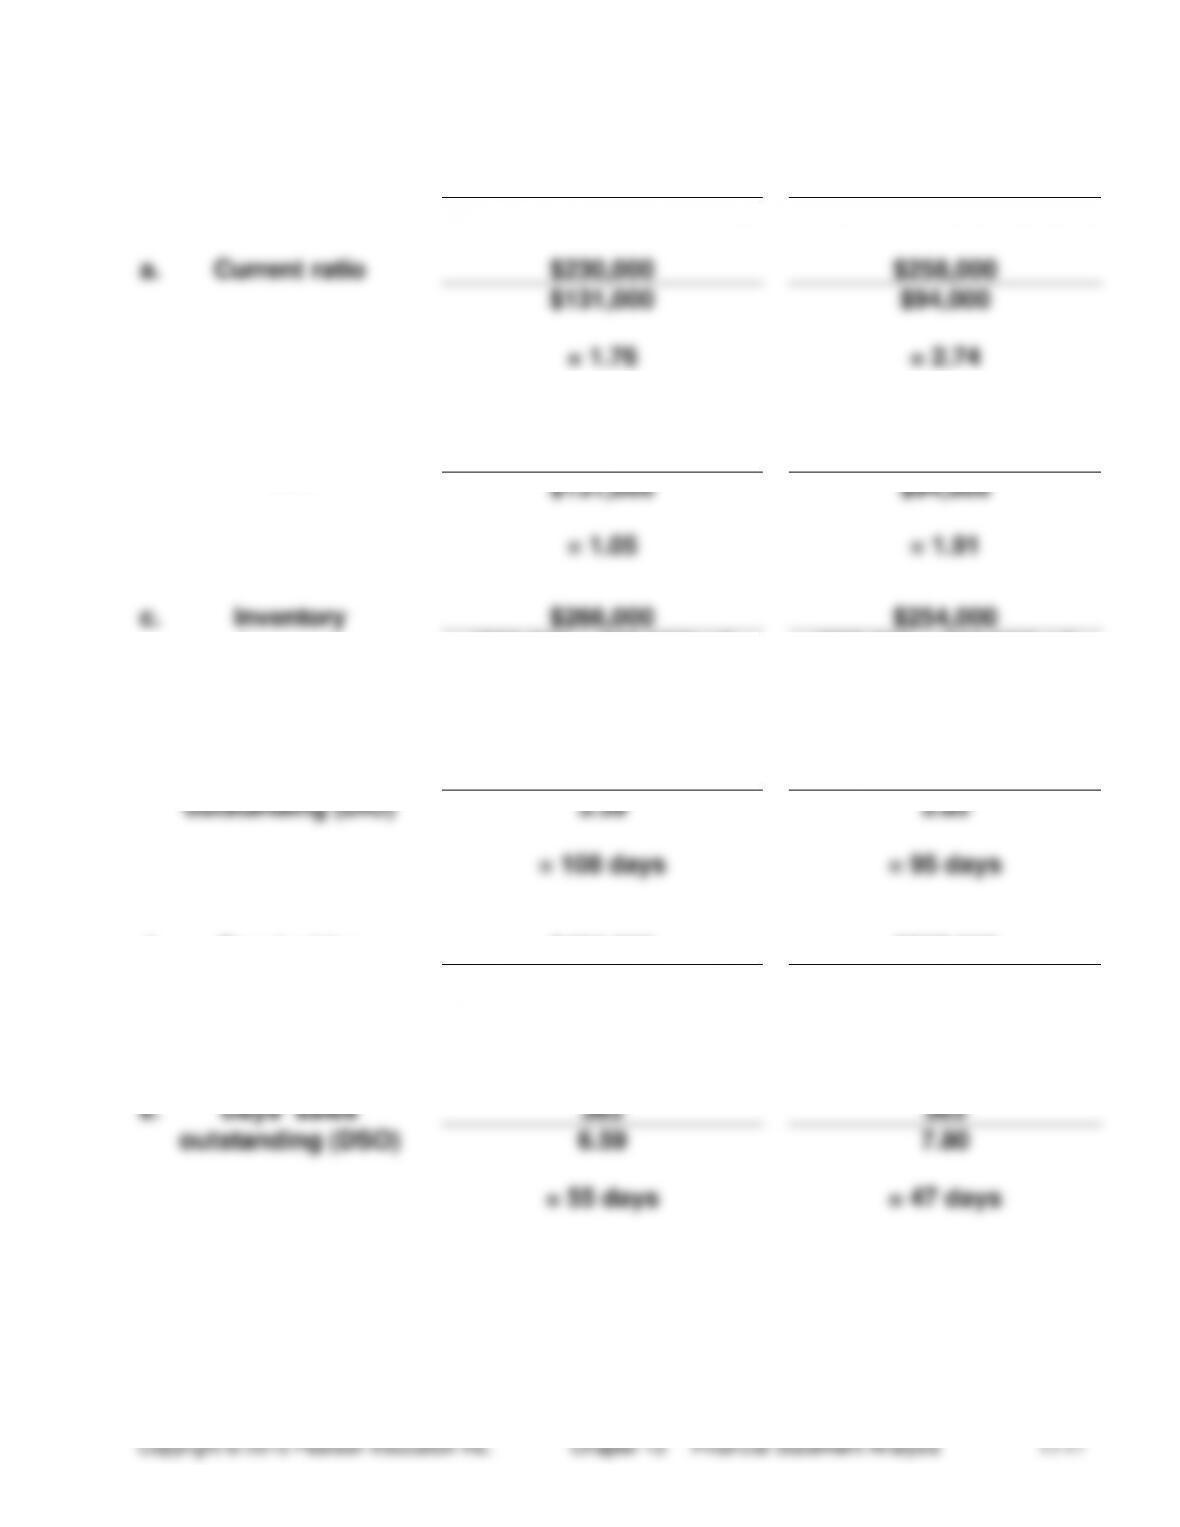
(10-15 min.) E 13-21A
Req. 1
Current Year
Prior Year
a.
Current ratio
$230,000
$258,000
$131,000
$94,000
= 1.76
= 2.74
b.
Quick (acid-test)
ratio
$48,000 + $17,000 +
$72,000
$84,000+ $21,000 +
$75,000
$131,000
$94,000
= 1.05
= 1.91
c.
Inventory
$266,000
$254,000
turnover
($85,000 + $72,000) / 2
($72,000 + $60,000) / 2
= 3.39
= 3.85
Days’ inventory
365
365
outstanding (DIO)
3.39
3.85
= 108 days
= 95 days
d.
Receivables
$484,000
$507,000
turnover
($72,000 + $75,000) / 2
($75,000 + $55,000) / 2
= 6.59
= 7.80
e.
Days’ sales
365
365
outstanding (DSO)
6.59
7.80
= 55 days
= 47 days
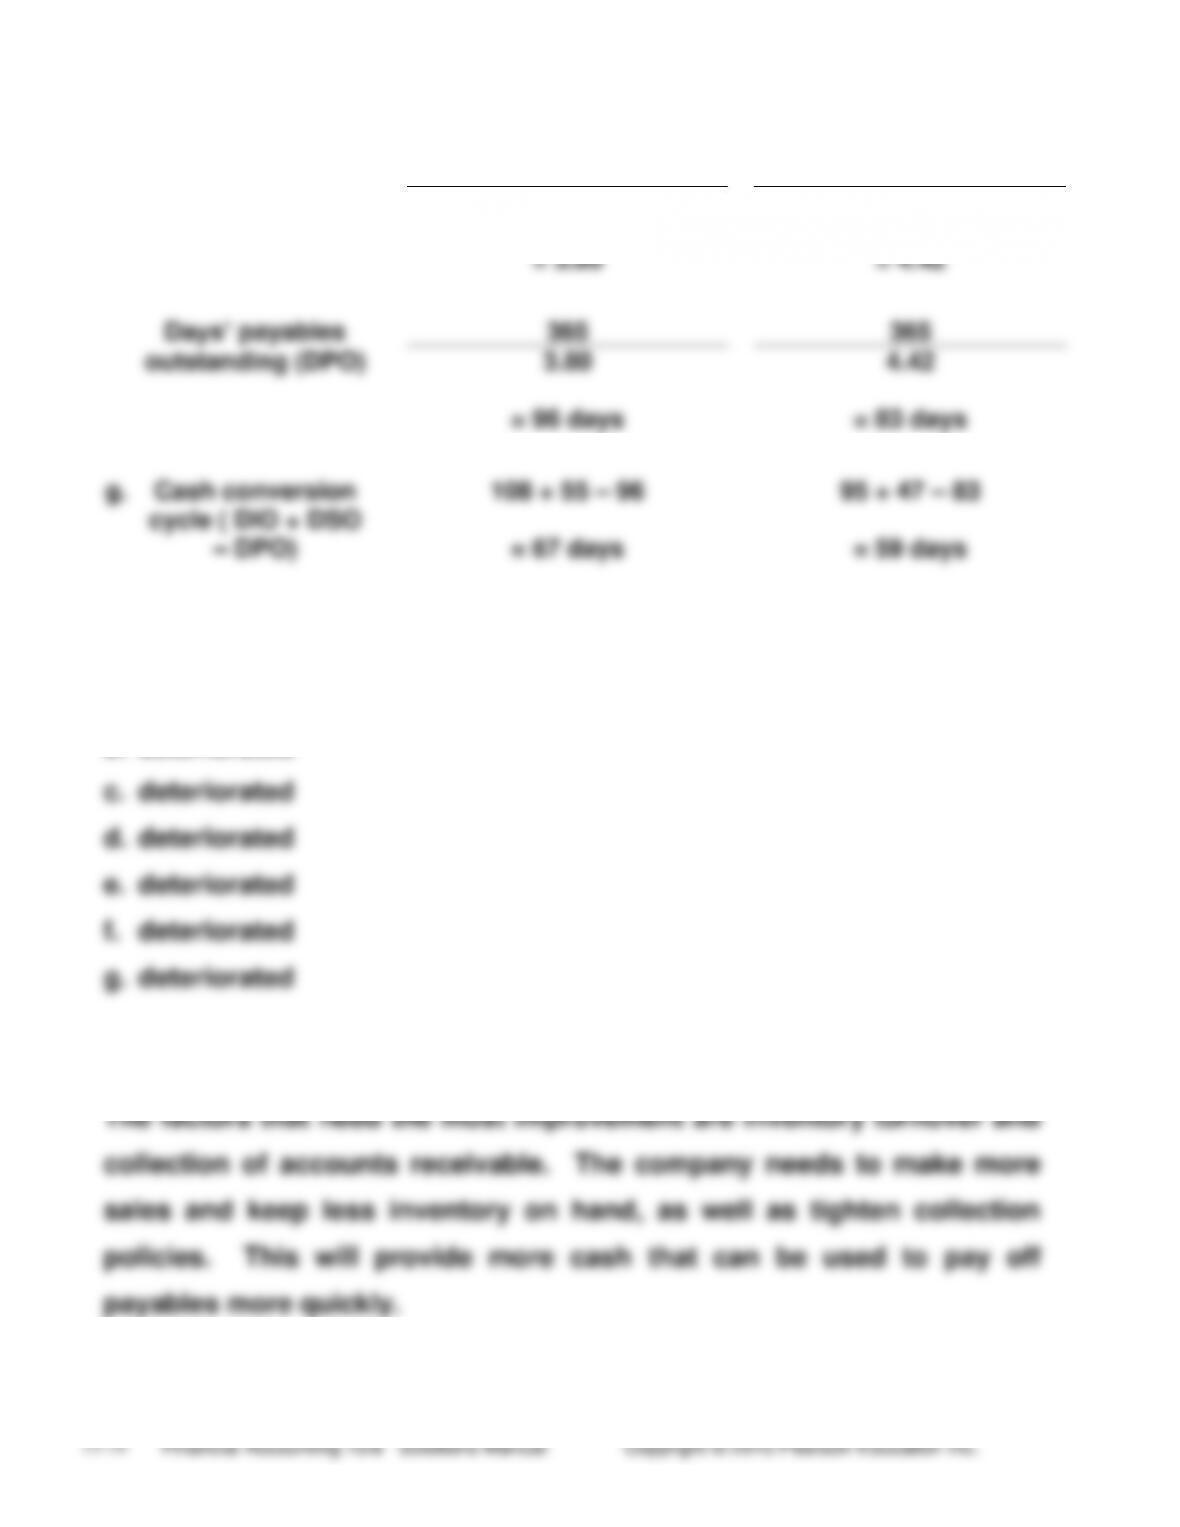
(continued) E 13-21A
f.
Payables
$266,000
$254,000
turnover
($75,000 + $65,000) / 2
($65,000 + $50,000) / 2
= 3.80
= 4.42
Days’ payables
365
365
outstanding (DPO)
3.80
4.42
= 96 days
= 83 days
g.
Cash conversion
108 + 55 – 96
95 + 47 – 83
cycle ( DIO + DSO
– DPO)
= 67 days
= 59 days
Req. 2
a. deteriorated
b. deteriorated
Req. 3
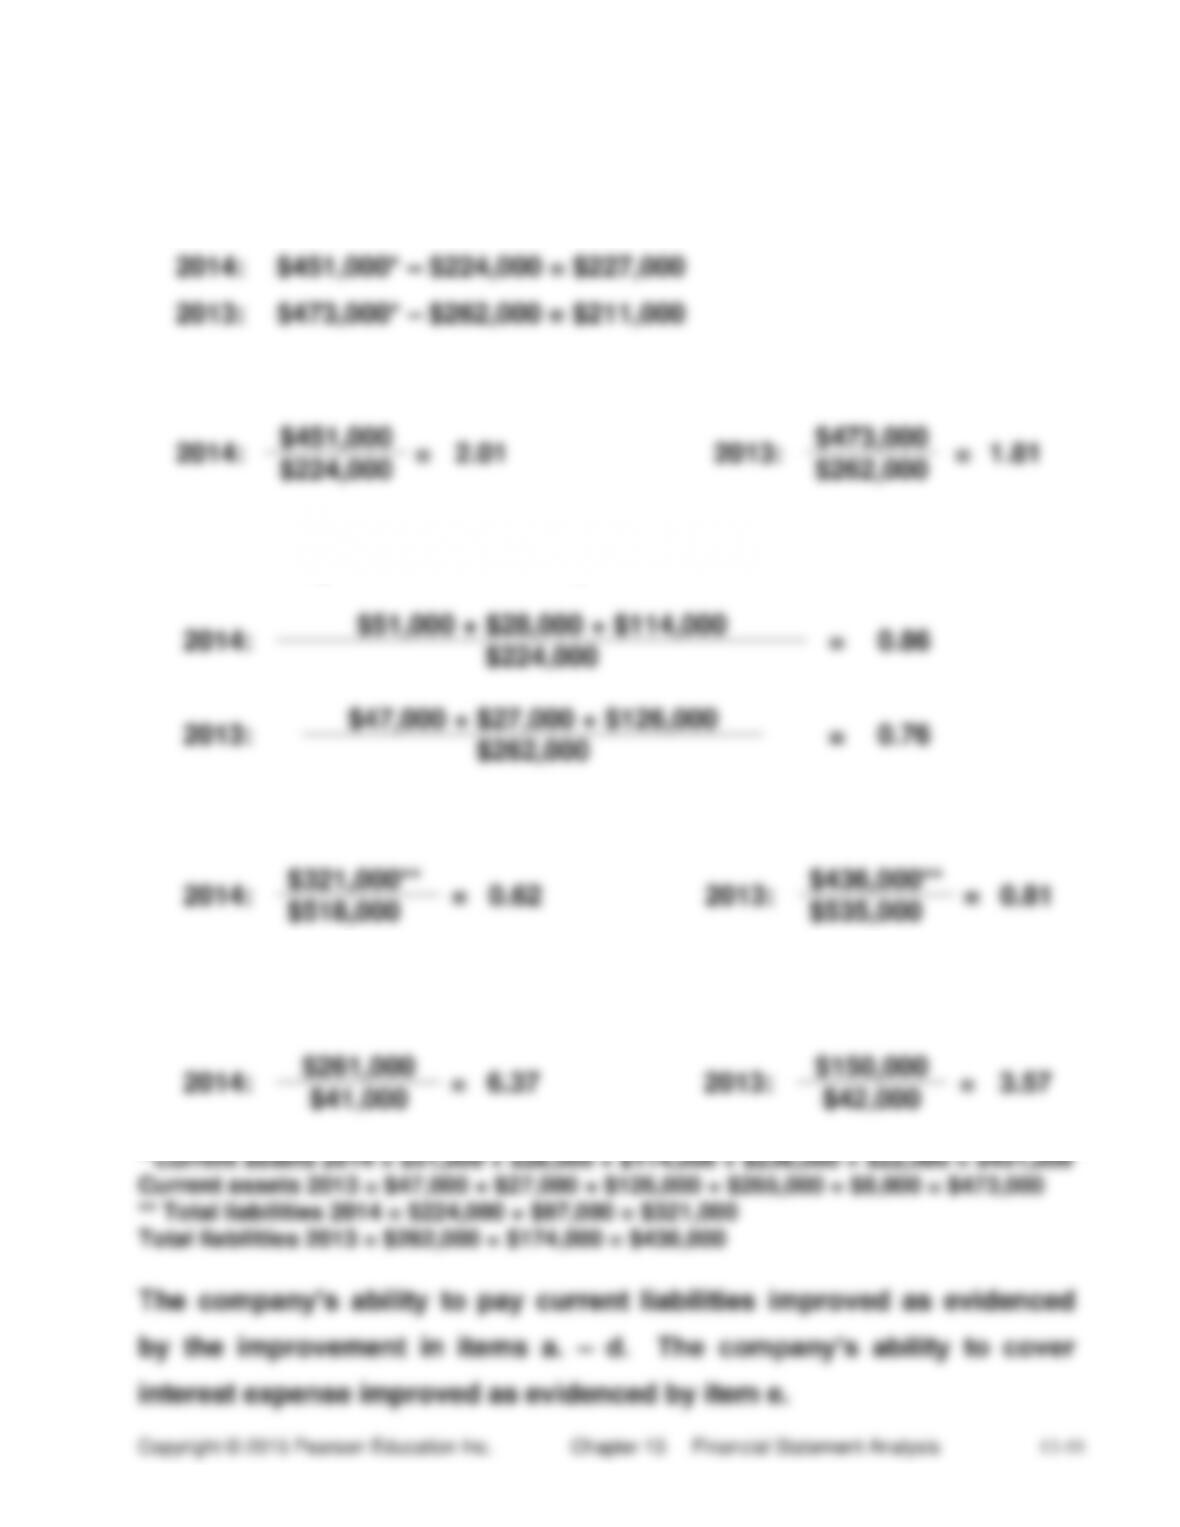
(15-20 min.) E 13-22A
a. Working capital (Current assets – Current liabilities)
2014:
$451,000* – $224,000 = $227,000
2013:
$473,000* – $262,000 = $211,000
b. Current ratio (Current assets ÷ Current liabilities)
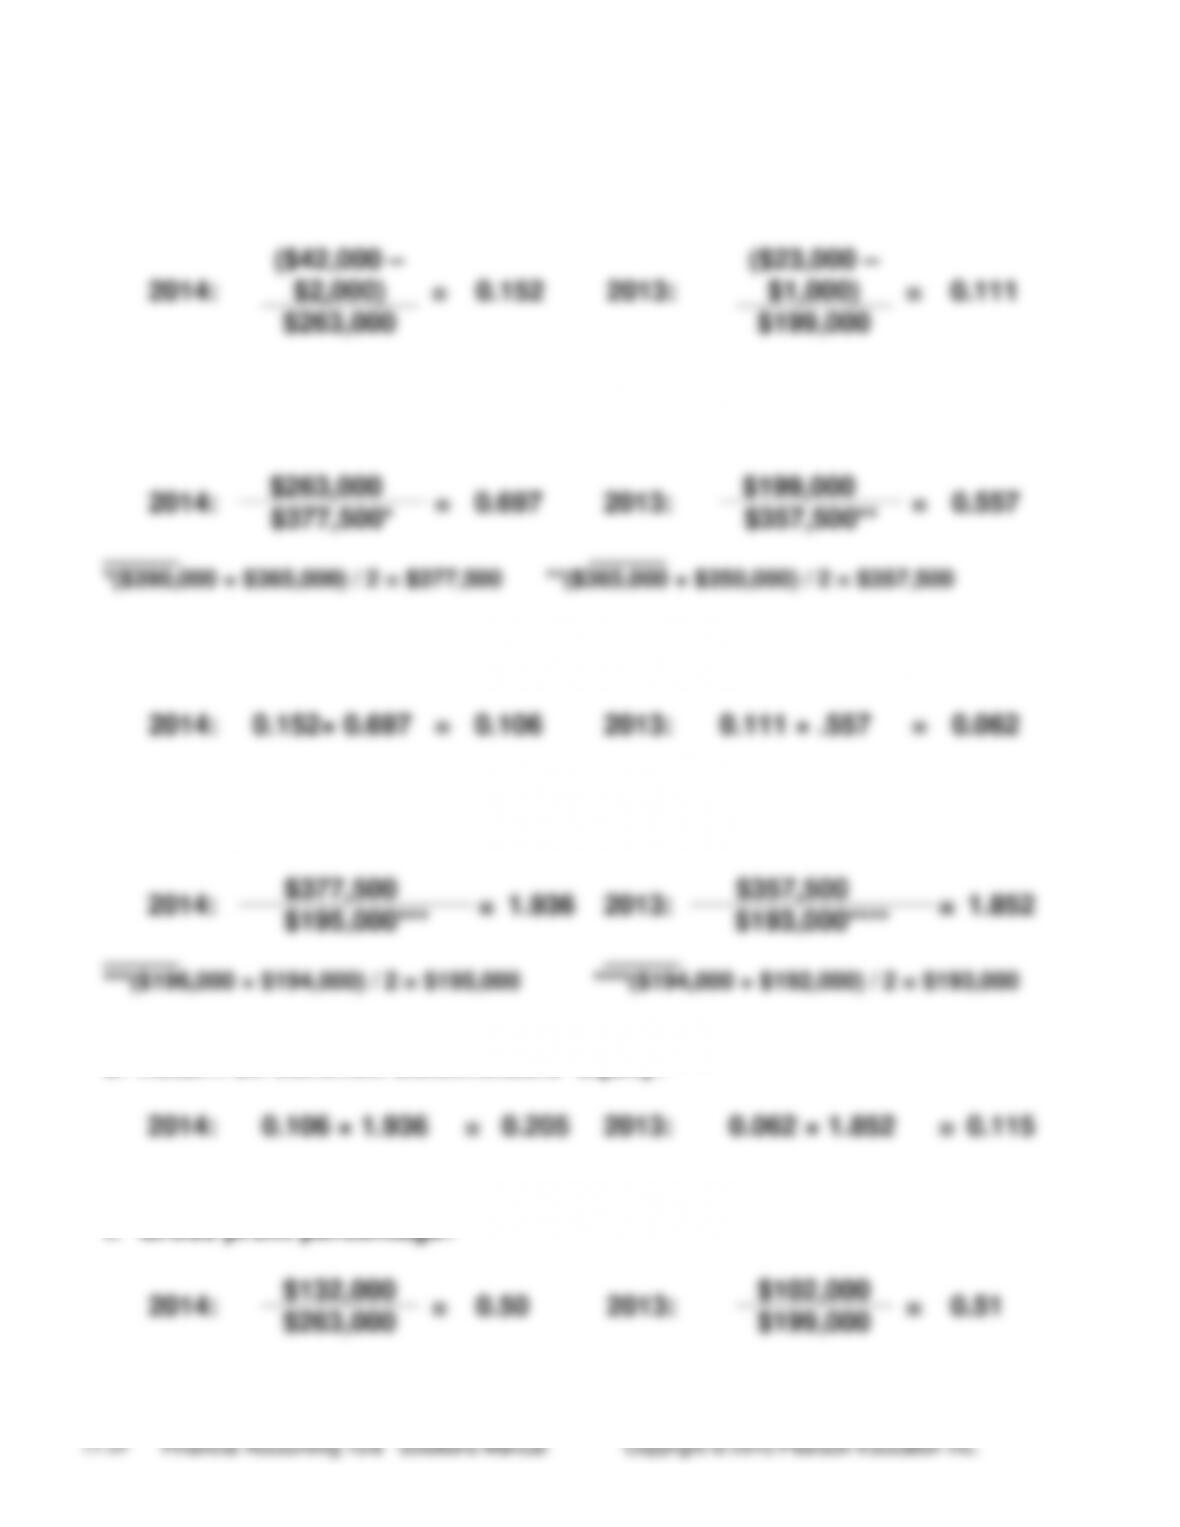
(10-15 min.) E 13-23A
a. Return on net sales: