Chapter 11 Evaluating Performance: Earnings Quality, the Income Statement, & the Statement of Comprehensive Income
11–53
Decision Cases
(15-20 min.) Decision Case 1
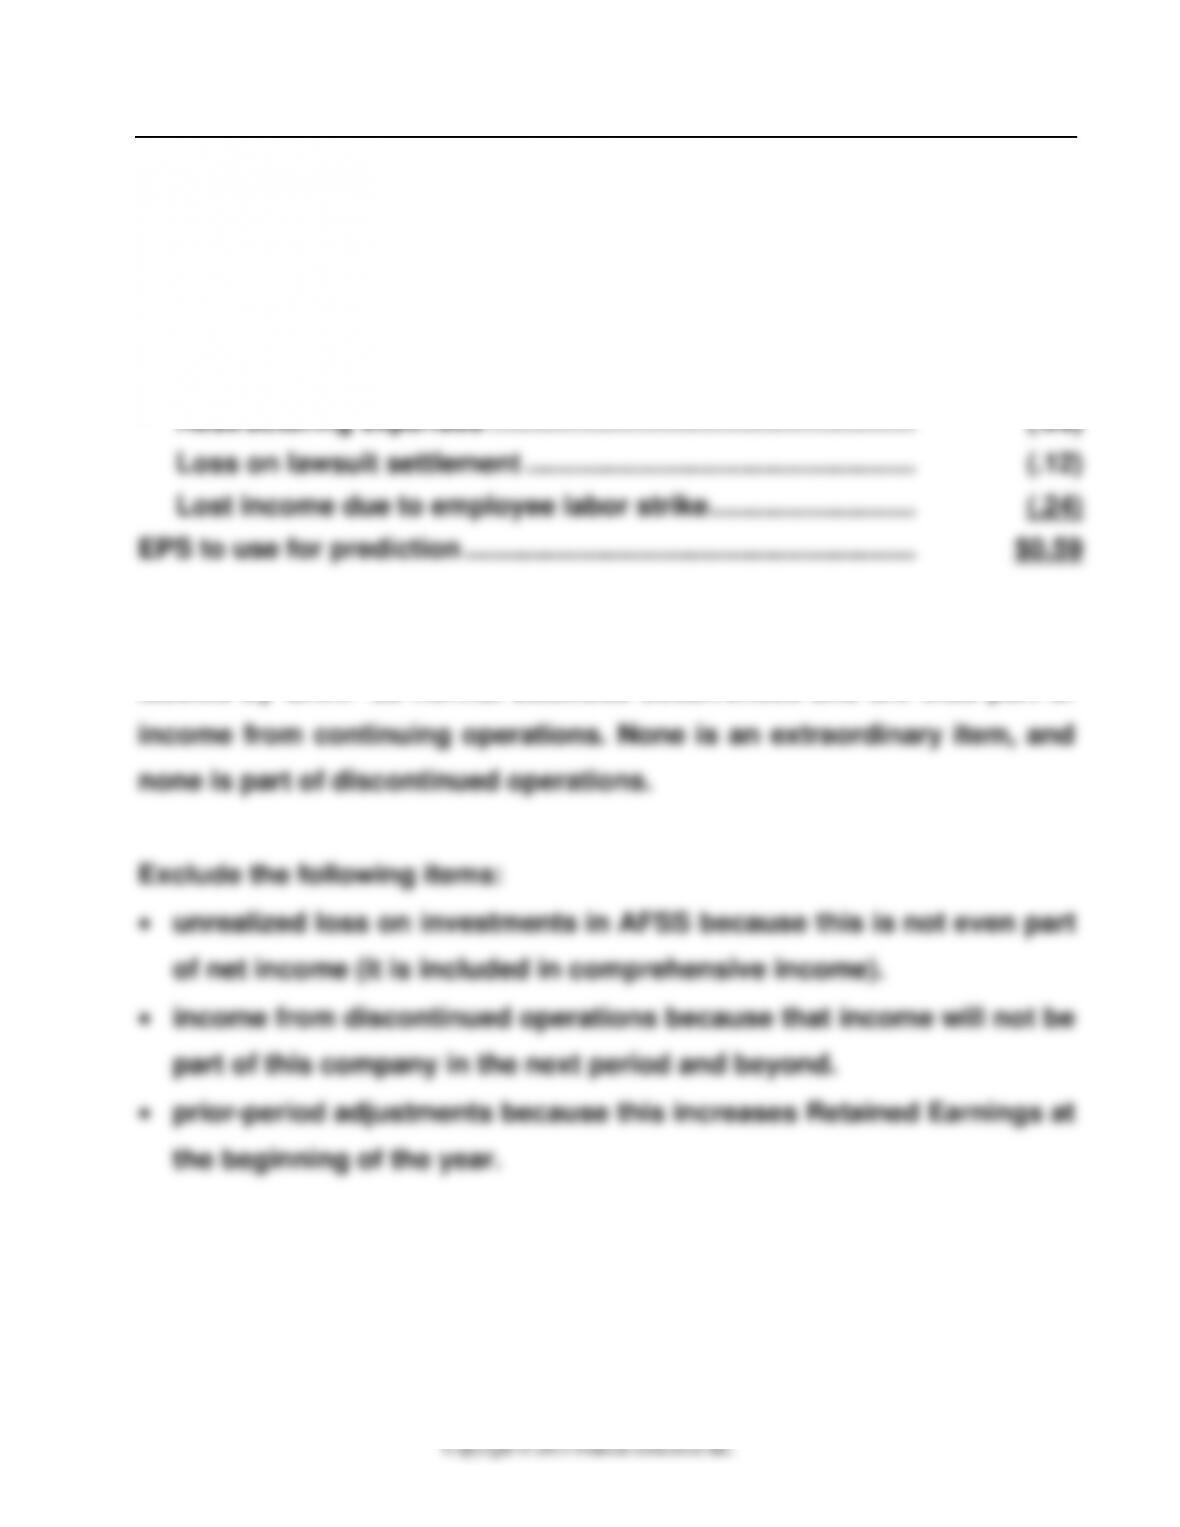
EPS to use for predicting future profits:
Unaudited EPS …………………………………………………………………. $1.19
Include:
Gain on sale of building ……………………………………………….. .05
Restructuring expenses ……………………………………………….. (.29)
Loss on lawsuit settlement …………………………………………… (.12)
Lost income due to employee labor strike ……………………… (.24)
EPS to use for prediction ………………………………………………….. $0.59
Include all the preceding items for your prediction because all are
labeled by GAAP as normal business occurrences and are thus part of
(15-20 min.) Decision Case 2
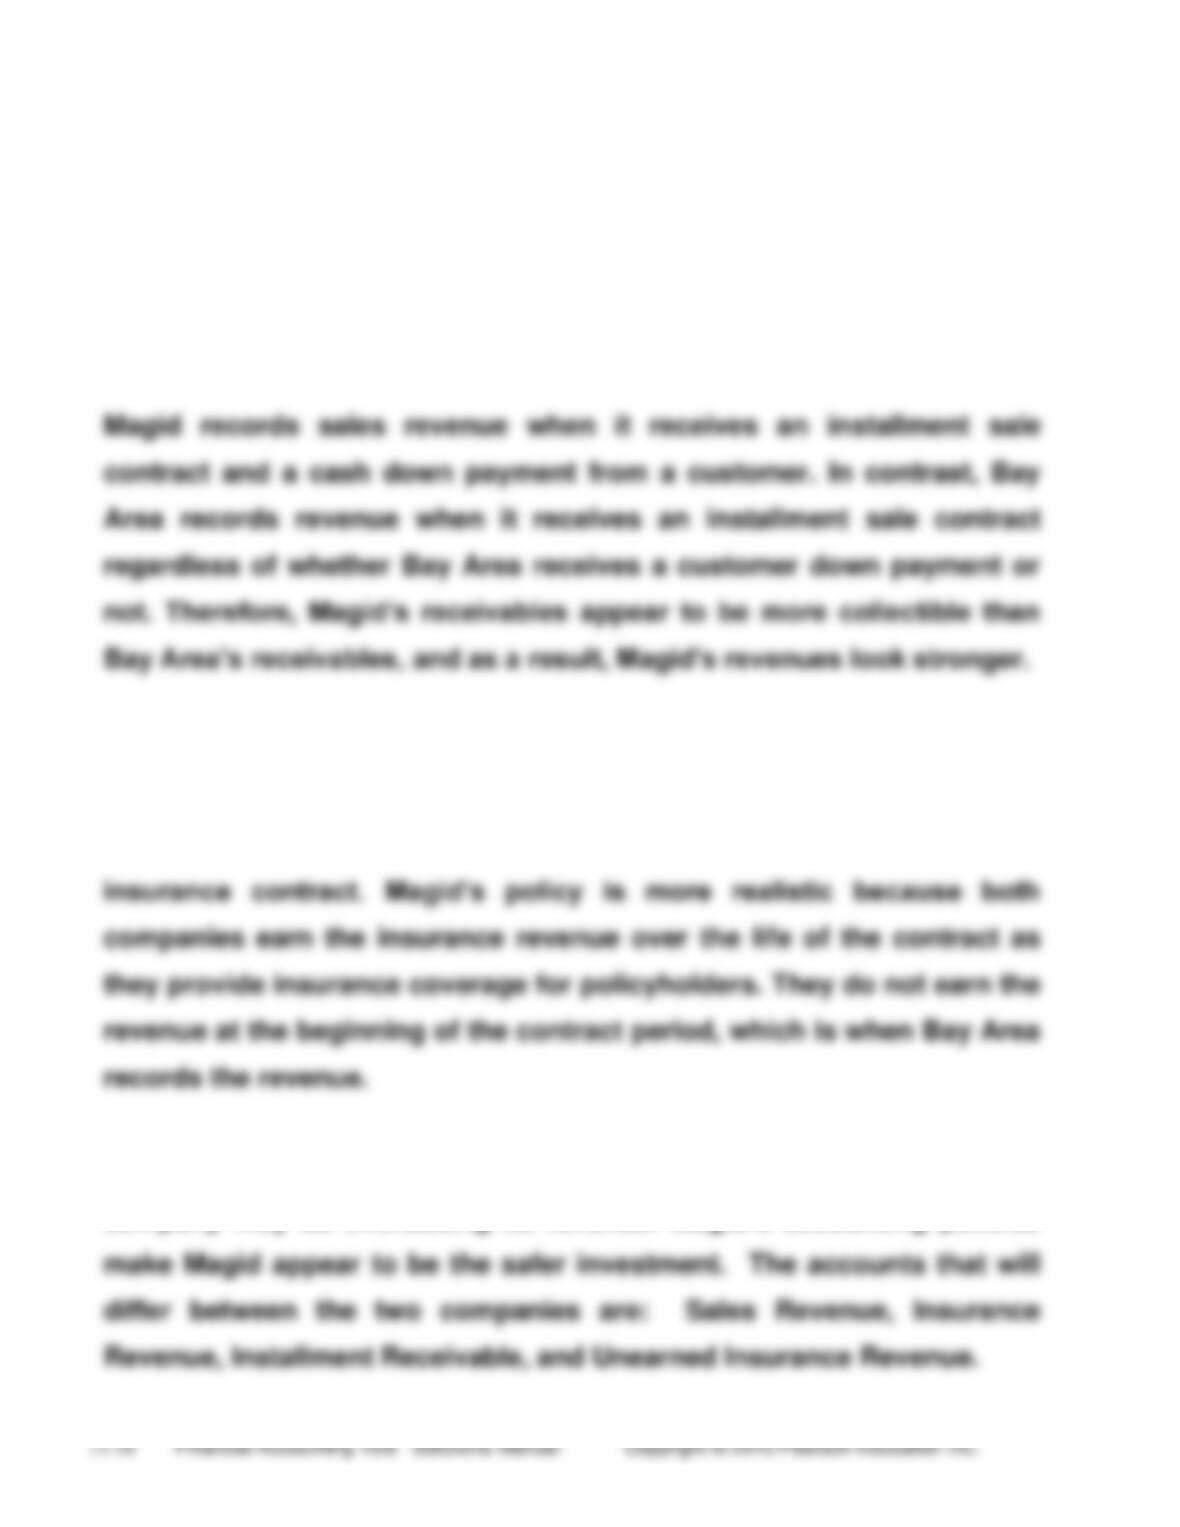
Magid’s earnings are of higher quality than those of Bay Area. Magid
follows more conservative (and more realistic) accounting policies than
Bay Area. Here are some examples:
SALES REVENUE
INSURANCE REVENUE
Magid records insurance revenue over the life of the policy, while Bay
Area records insurance revenue up front when the customer signs the
Overall, Bay Area’s policies for recording revenue suggest that the
company may be overstating its revenue. Magid’s accounting policies
Chapter 11 Evaluating Performance: Earnings Quality, the Income Statement, & the Statement of Comprehensive Income
11–55
Ethical Issue
Req. 1
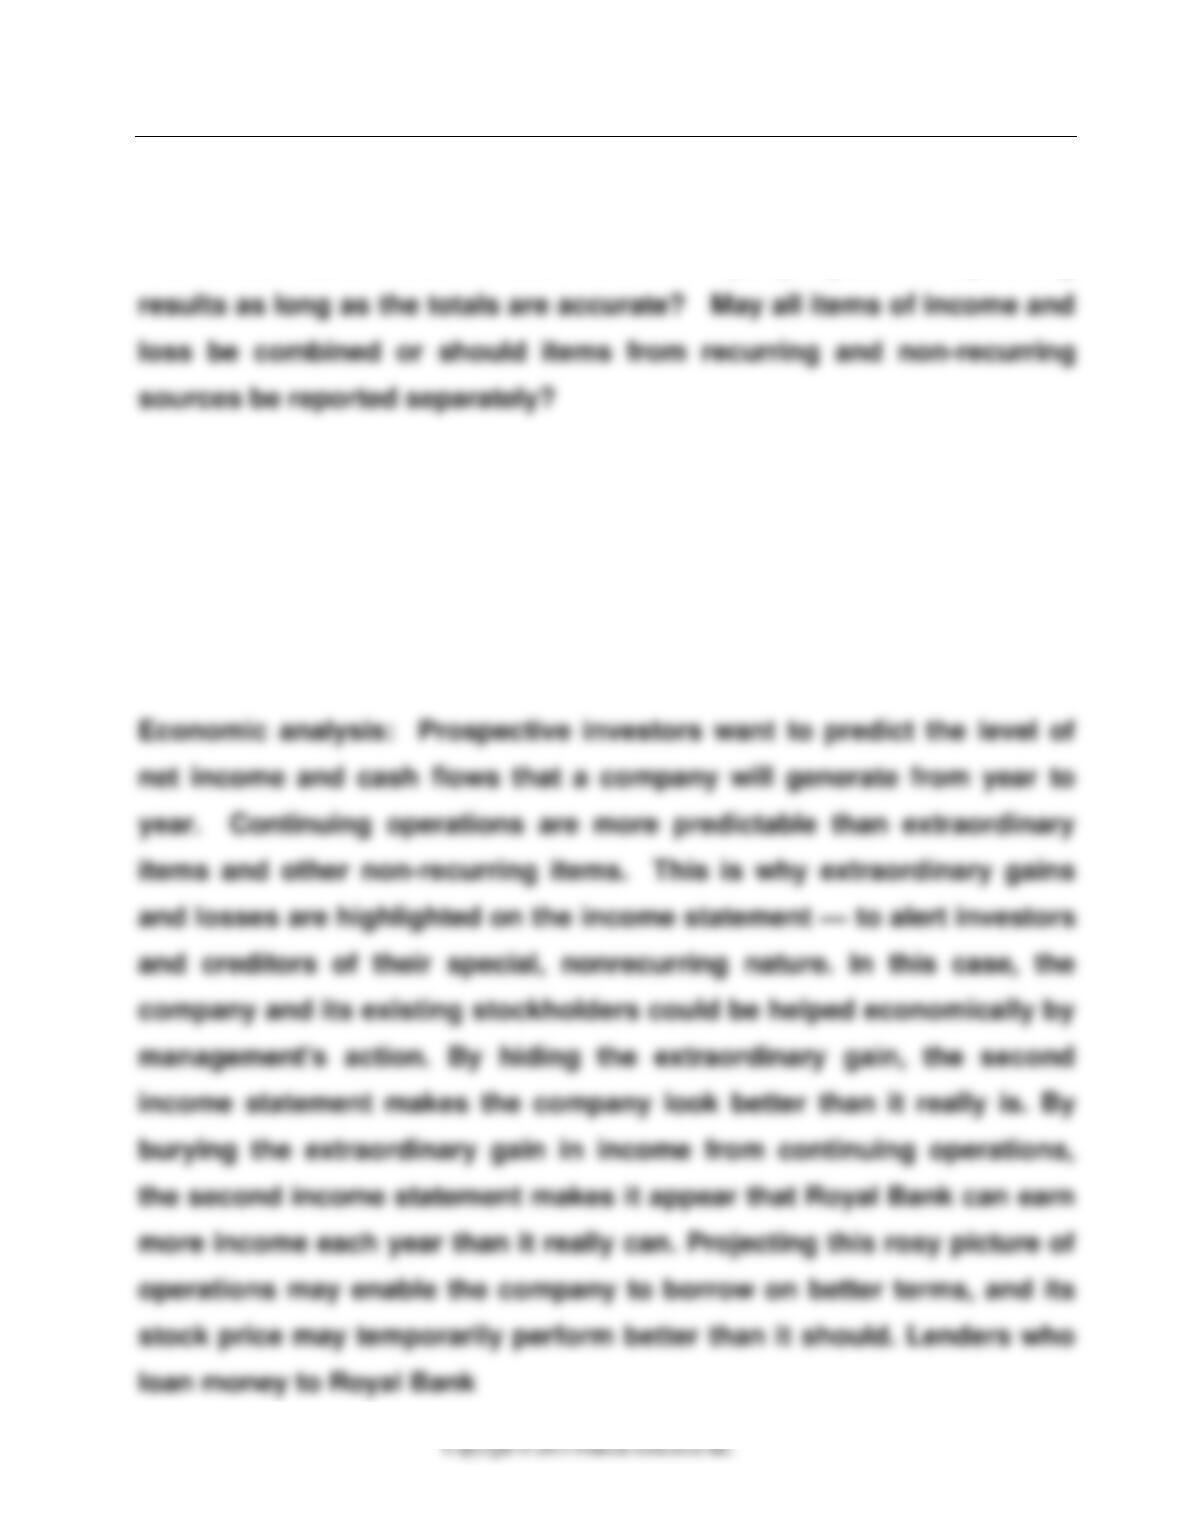
The ethical issue: Does it matter how a company reports its operating
Req. 2 and Req. 3
The stakeholders in this case include the bank, its officers and directors,
shareholders, prospective shareholders, its creditors, and stock
analysts.
(continued) Ethical Issue
and stockholders who buy the company’s stock based on the second
income statement can be hurt. They may lend to the company on too–
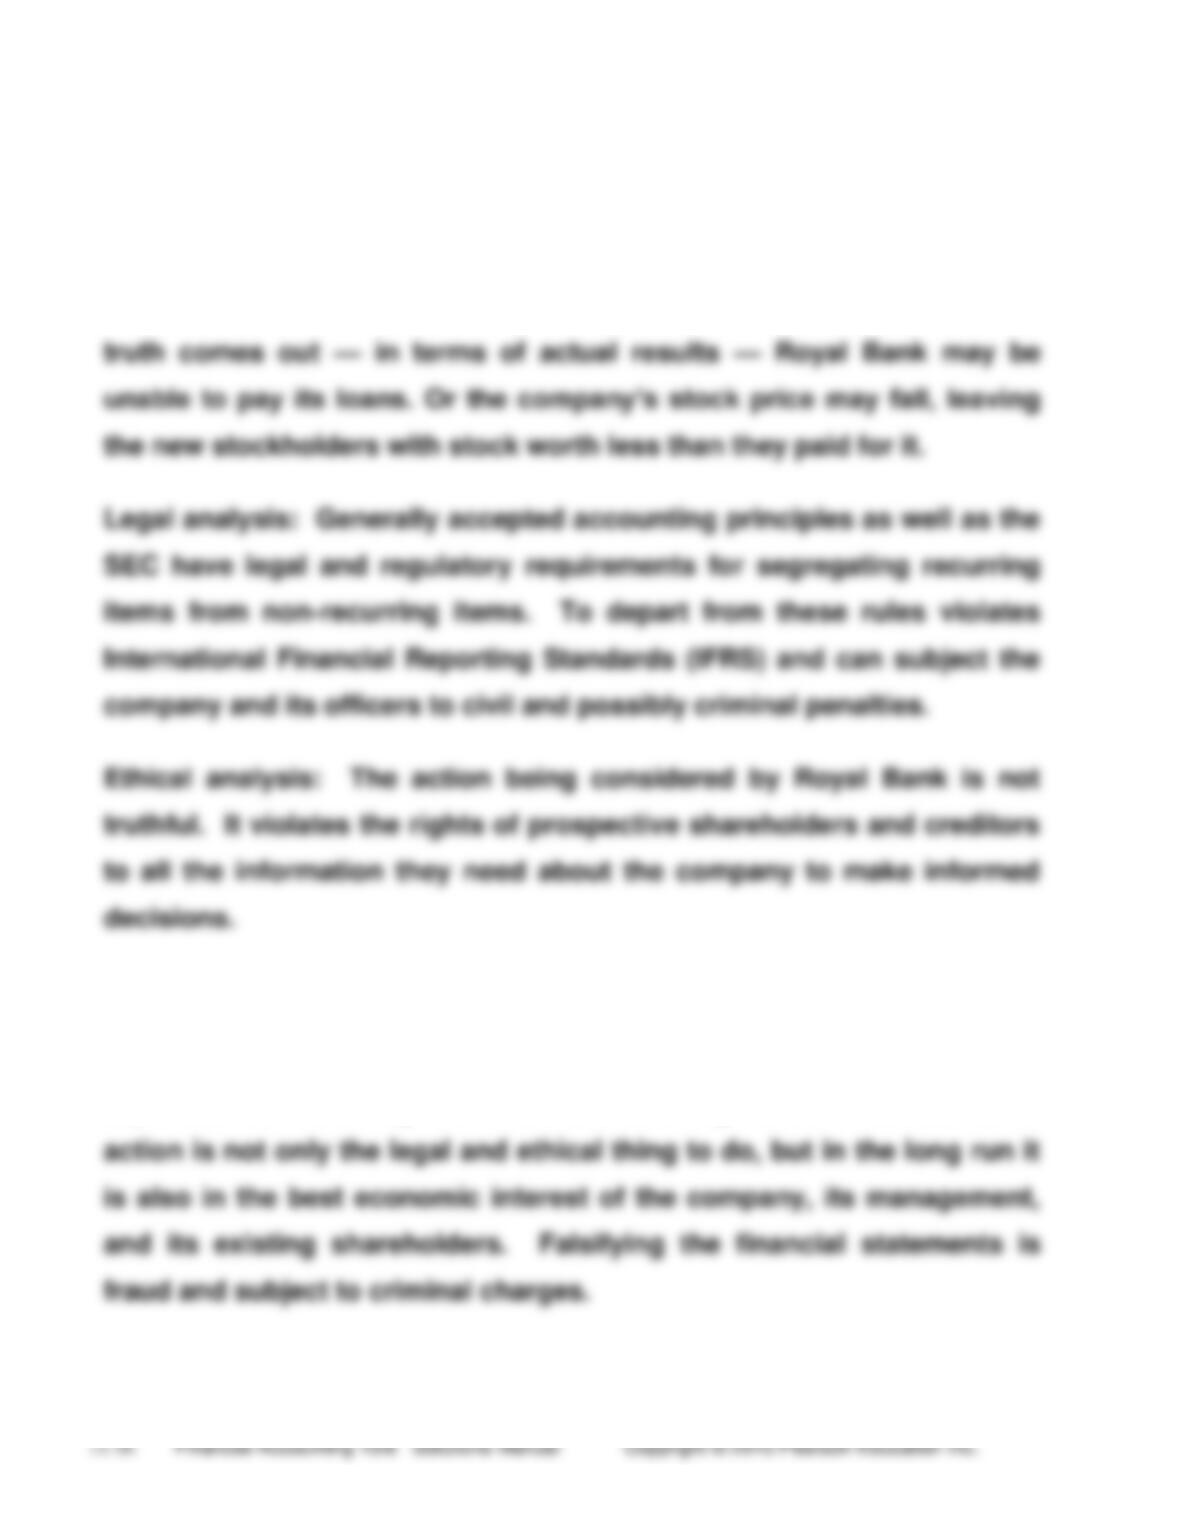
favorable terms, or they may pay too high a price for its stock. When the
Req. 4
The bank should report their results of operations in a way that
separates the recurring from the non-recurring items. This course of
Chapter 11 Evaluating Performance: Earnings Quality, the Income Statement, & the Statement of Comprehensive Income
11–57
Focus on Financials: Amazon.com, Inc.
(30-45 min.)
Req. 1
Amazon.com, Inc.’s income statement does not mention income from
continuing operations because there are no special items of income,
such as discontinued operations. All of Amazon.com, Inc.’s net income
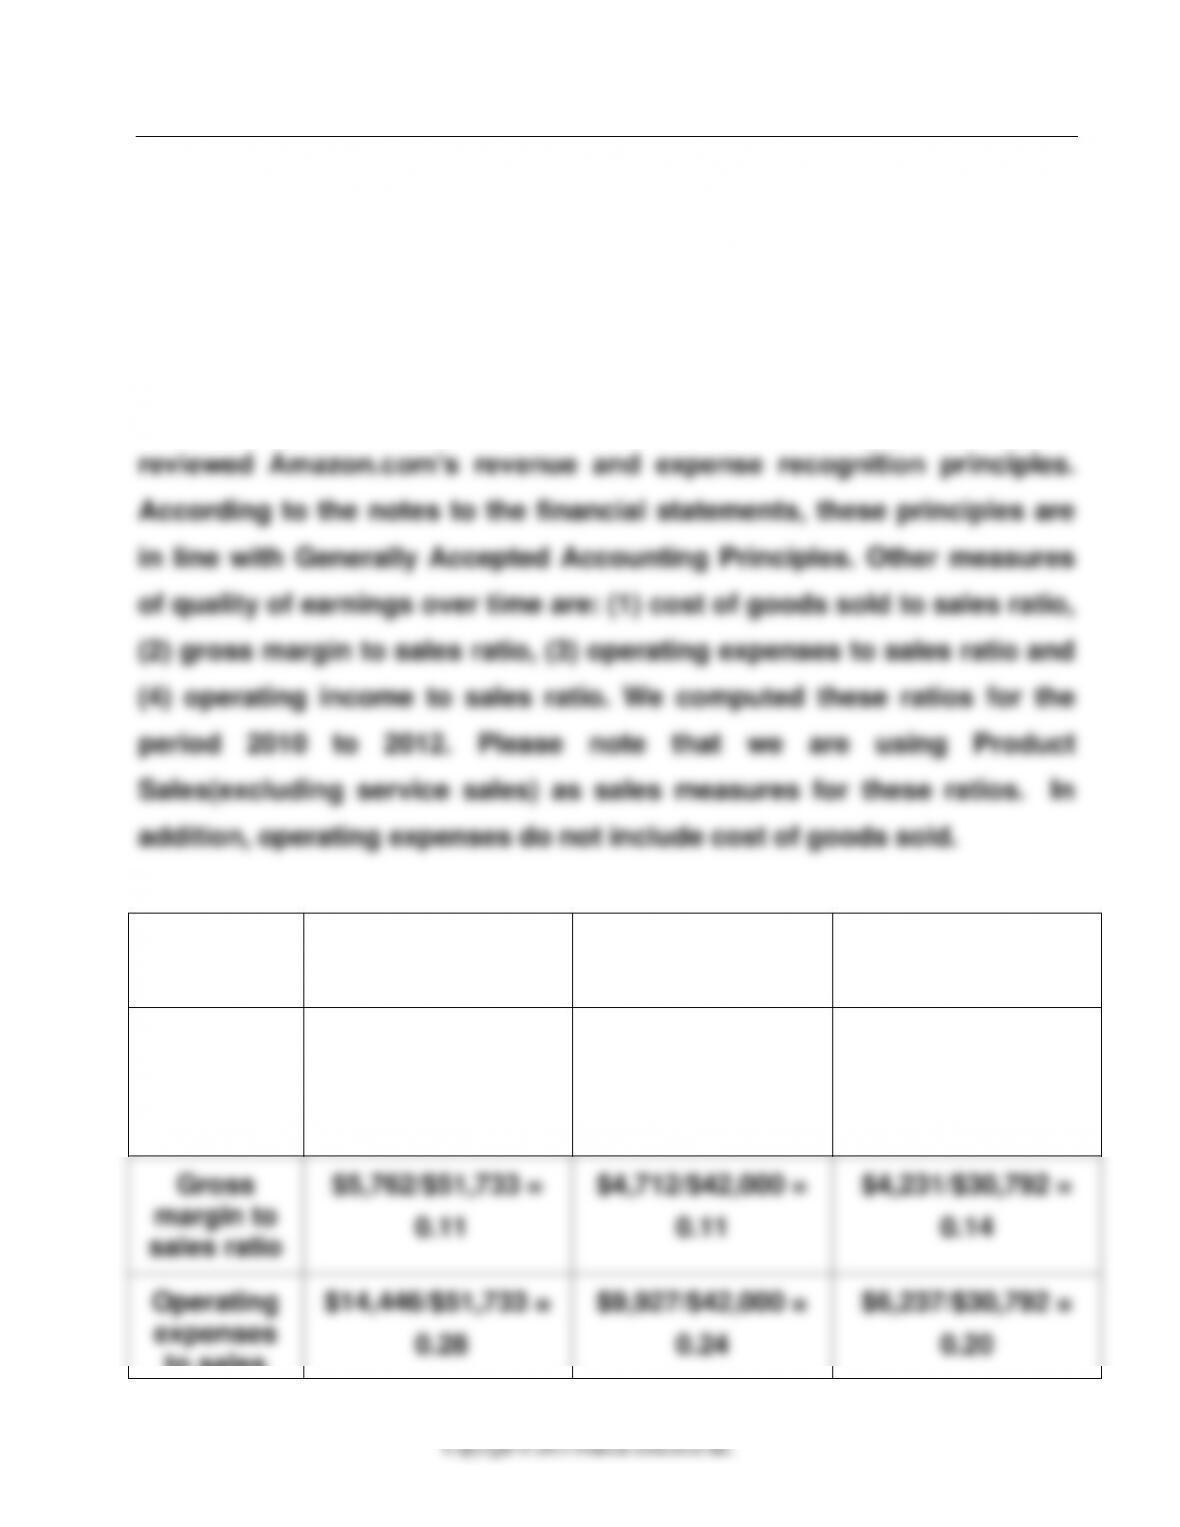
results from continuing operations. To evaluate quality of earnings, we
Measures
of Quality
of Earnings
2012
2011
2010
Cost of
goods sold
to sales
ratio
$45,971/$51,733 =
0.89
$37,288/$42,000 =
0.89
$26,561/$30,792 =
0.86
Gross
margin to
sales ratio
$5,762/$51,733 =
0.11
$4,712/$42,000 =
0.11
$4,231/$30,792 =
0.14
Operating
expenses
to sales
$14,446/$51,733 =
0.28
$9,927/$42,000 =
0.24
$6,237/$30,792 =
0.20
ratio
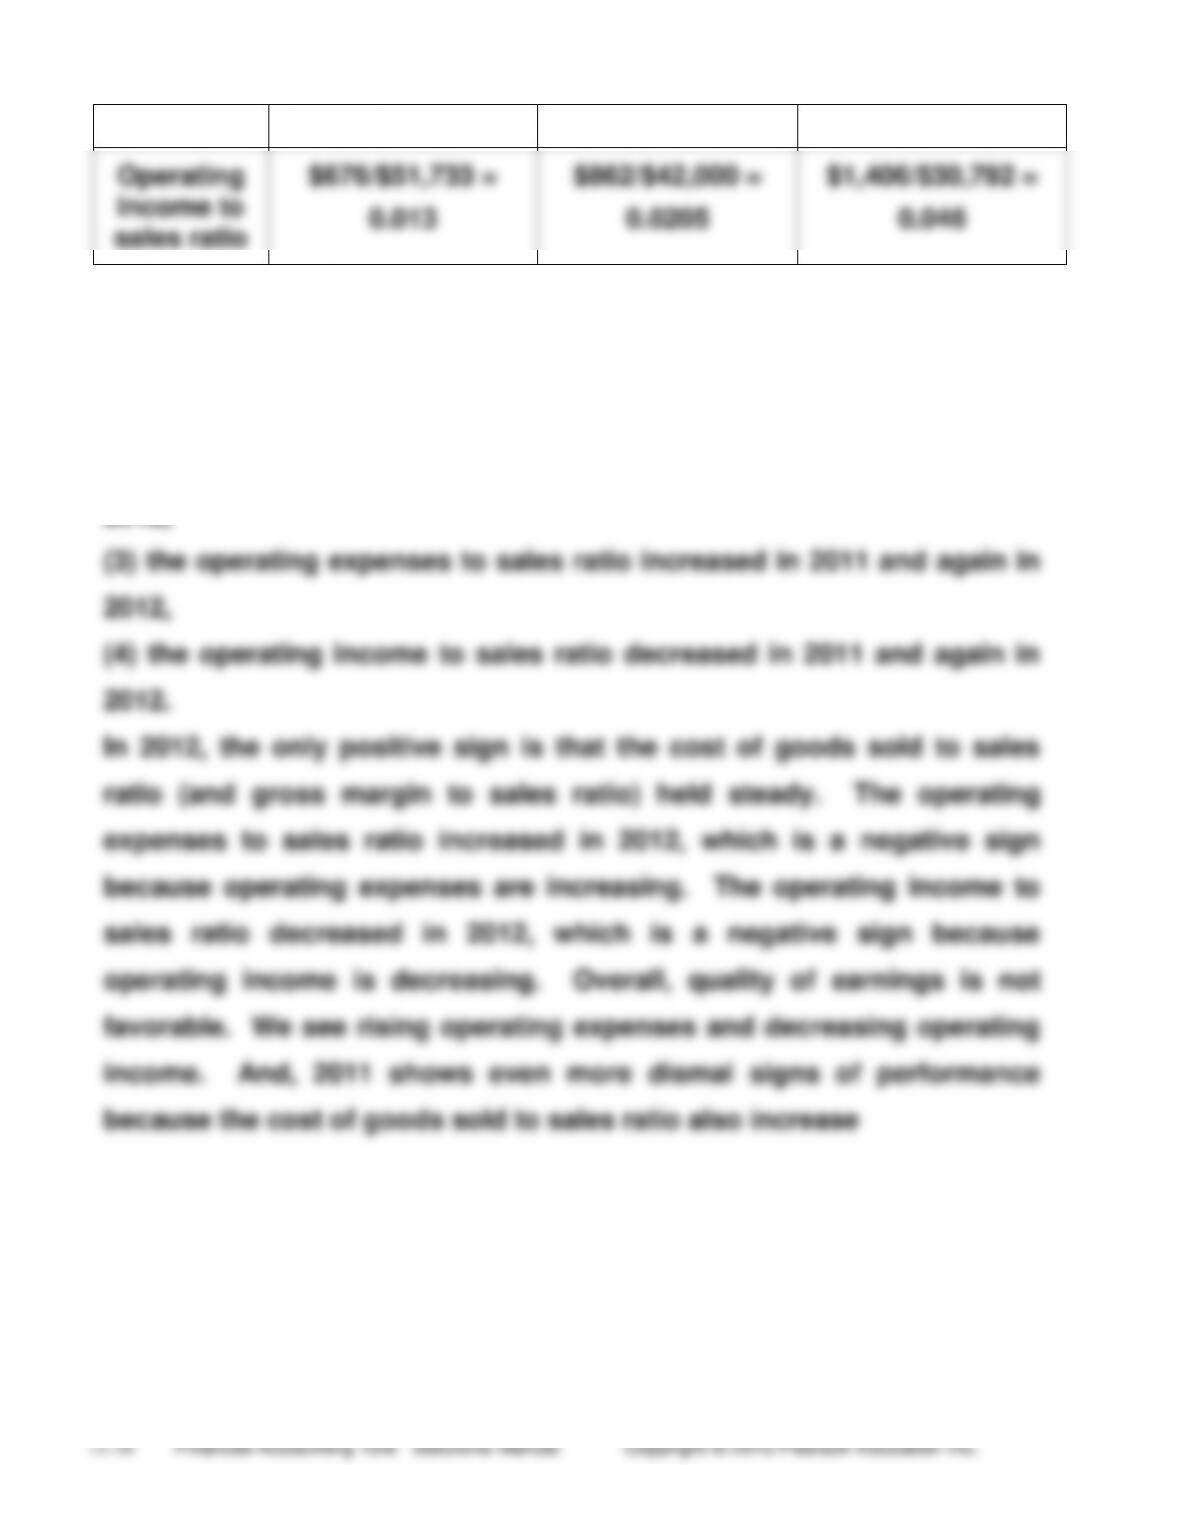
Operating
income to
sales ratio
$676/$51,733 =
0.013
$862/$42,000 =
0.0205
$1,406/$30,792 =
0.046
From this analysis, we see the following:
(1) the cost of goods sold to sales ratio increased in 2011 and held
steady in 2012,
(2) the gross margin to sales ratio decreased in 2011 and held steady in
2012,
Chapter 11 Evaluating Performance: Earnings Quality, the Income Statement, & the Statement of Comprehensive Income
11–59
(continued) Amazon.com
Req. 2
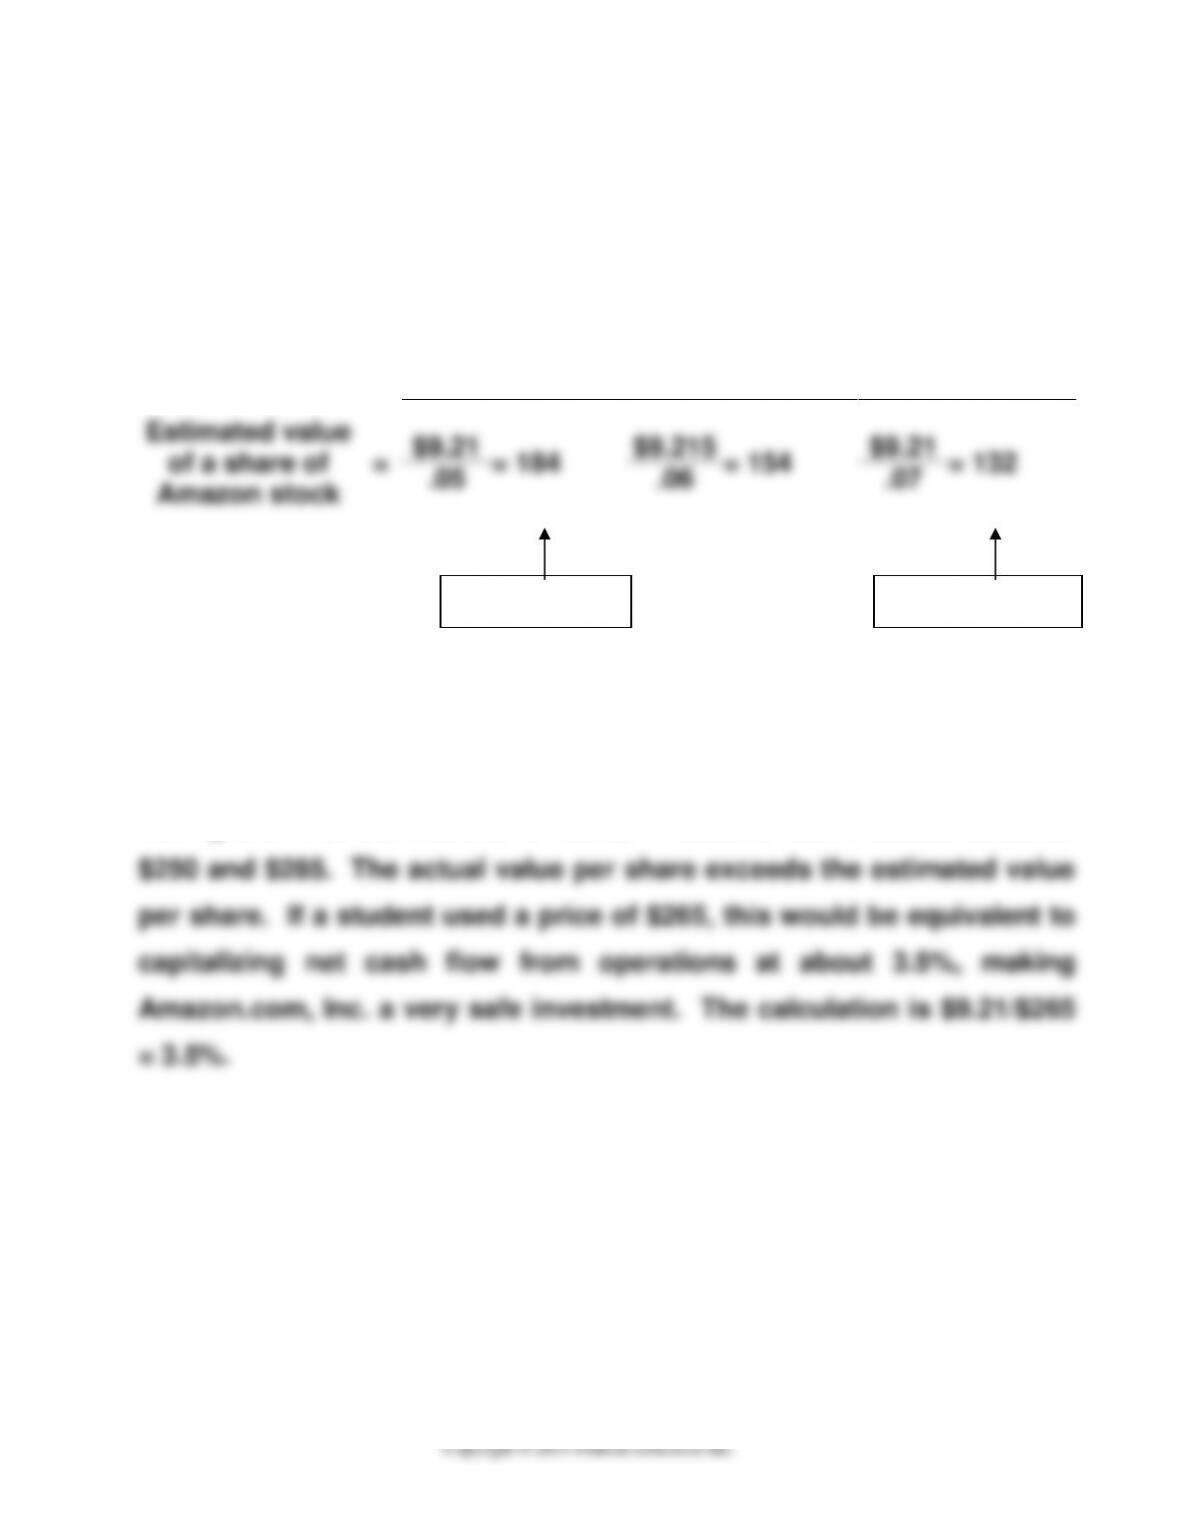
Cash flows from operations per share = $4,180 / 454 = 9.21
Investment Capitalization Rates
5%
6%
7%
Estimated value
of a share of
Amazon stock
=
$9.21
= 184
$9.215
= 154
$9.21
= 132
.05
.06
.07
Req. 3
Student answers will vary depending on when this problem is assigned.
During the first six months of 2013, Amazon’s stock traded between
Safe investment
Risky investment
Focus on Analysis: YUM! Brands, Inc.
(30 min.)
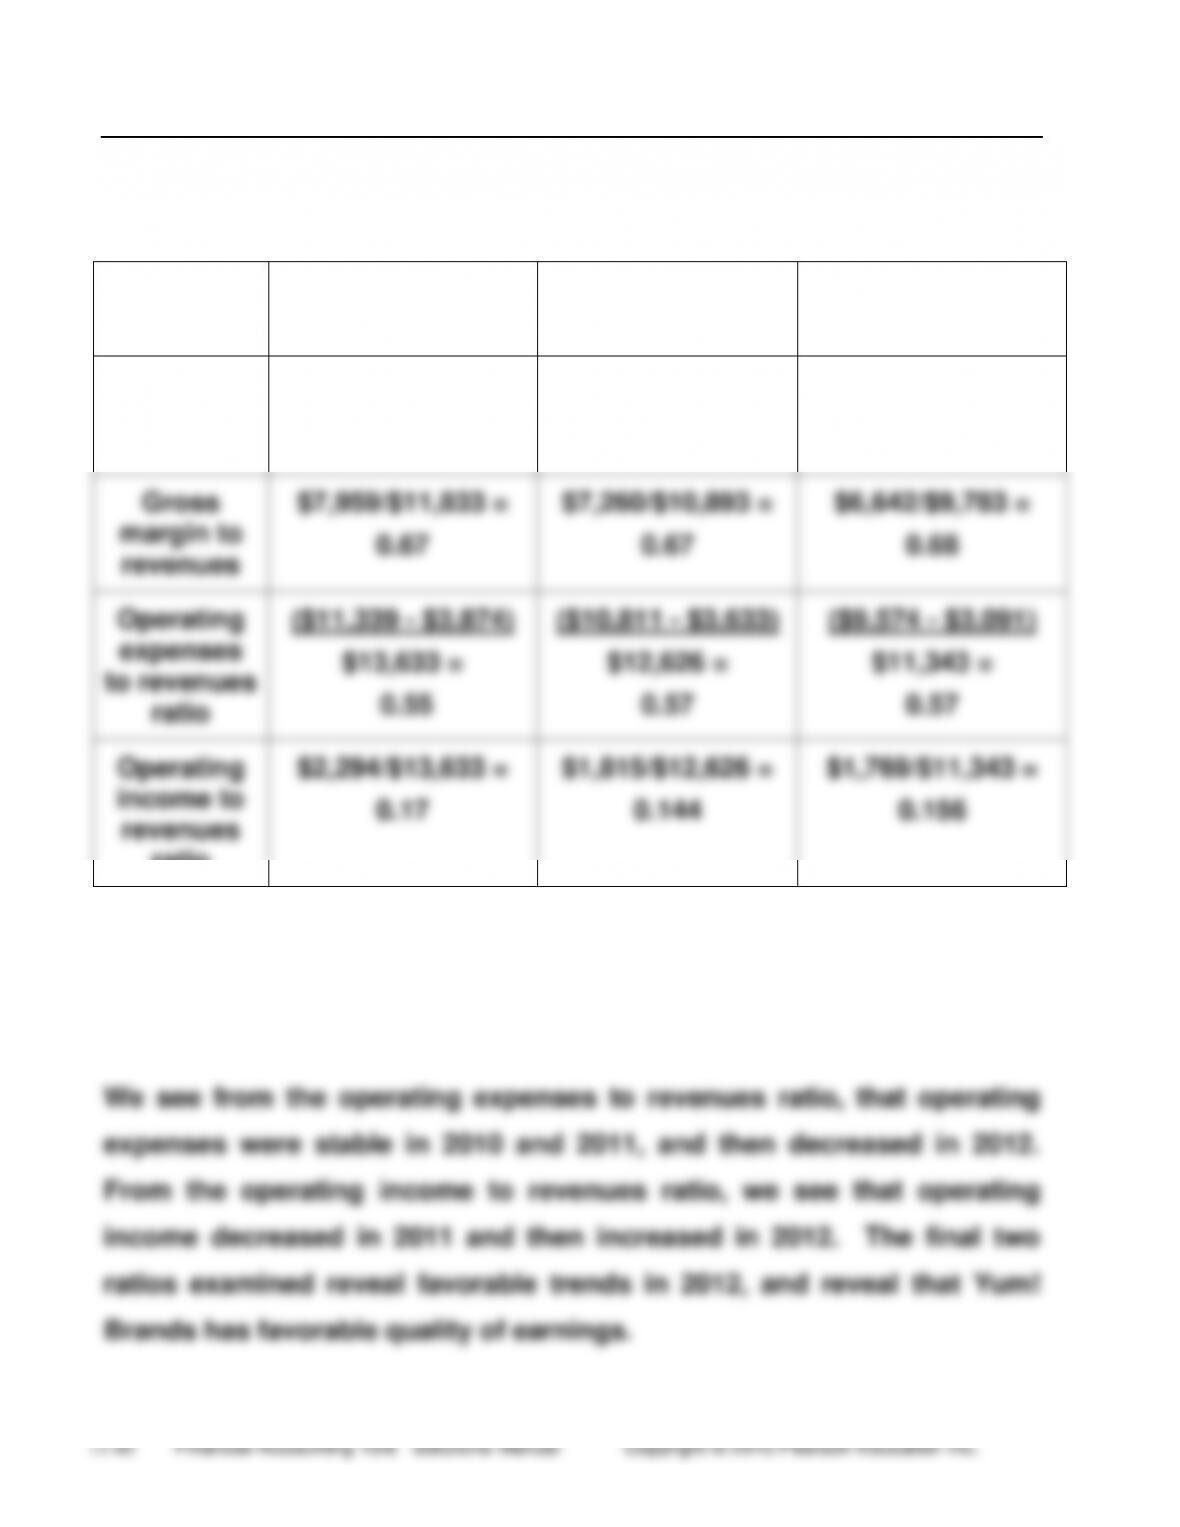
Req. 1
Measures
of Quality
of Earnings
2012
2011
2010
Cost of
goods sold
to revenues
$3,874/$11,833 =
0.33
$3,633/$10,893 =
0.33
$3,091/$9,783 =
0.32
Gross
margin to
revenues
$7,959/$11,833 =
0.67
$7,260/$10,893 =
0.67
$6,642/$9,783 =
0.68
Operating
expenses
to revenues
ratio
($11,339 – $3,874)
$13,633 =
0.55
($10,811 – $3,633)
$12,626 =
0.57
($9,574 – $3,091)
$11,343 =
0.57
Operating
income to
revenues
ratio
$2,294/$13,633 =
0.17
$1,815/$12,626 =
0.144
$1,769/$11,343 =
0.156
This table examines four ratios that investigate earnings quality. Cost of
goods sold to revenues have been stable over 2011 and 2012, which is a
favorable sign. The same comment applies to gross margin to revenues.
Chapter 11 Evaluating Performance: Earnings Quality, the Income Statement, & the Statement of Comprehensive Income
11–61
(continued) YUM! Brands, Inc.
The notes about revenue and expense recognition are also in line with
generally accepted accounting principles, which is favorable for quality
of earnings. Revenues from Company-owned restaurants are
Req. 2
They define their segments by geographic region: China, India YRI
(international excluding India and China), and the U.S. China is the
largest. The financial information they provide by segments is: for
(continued) YUM! Brands, Inc.
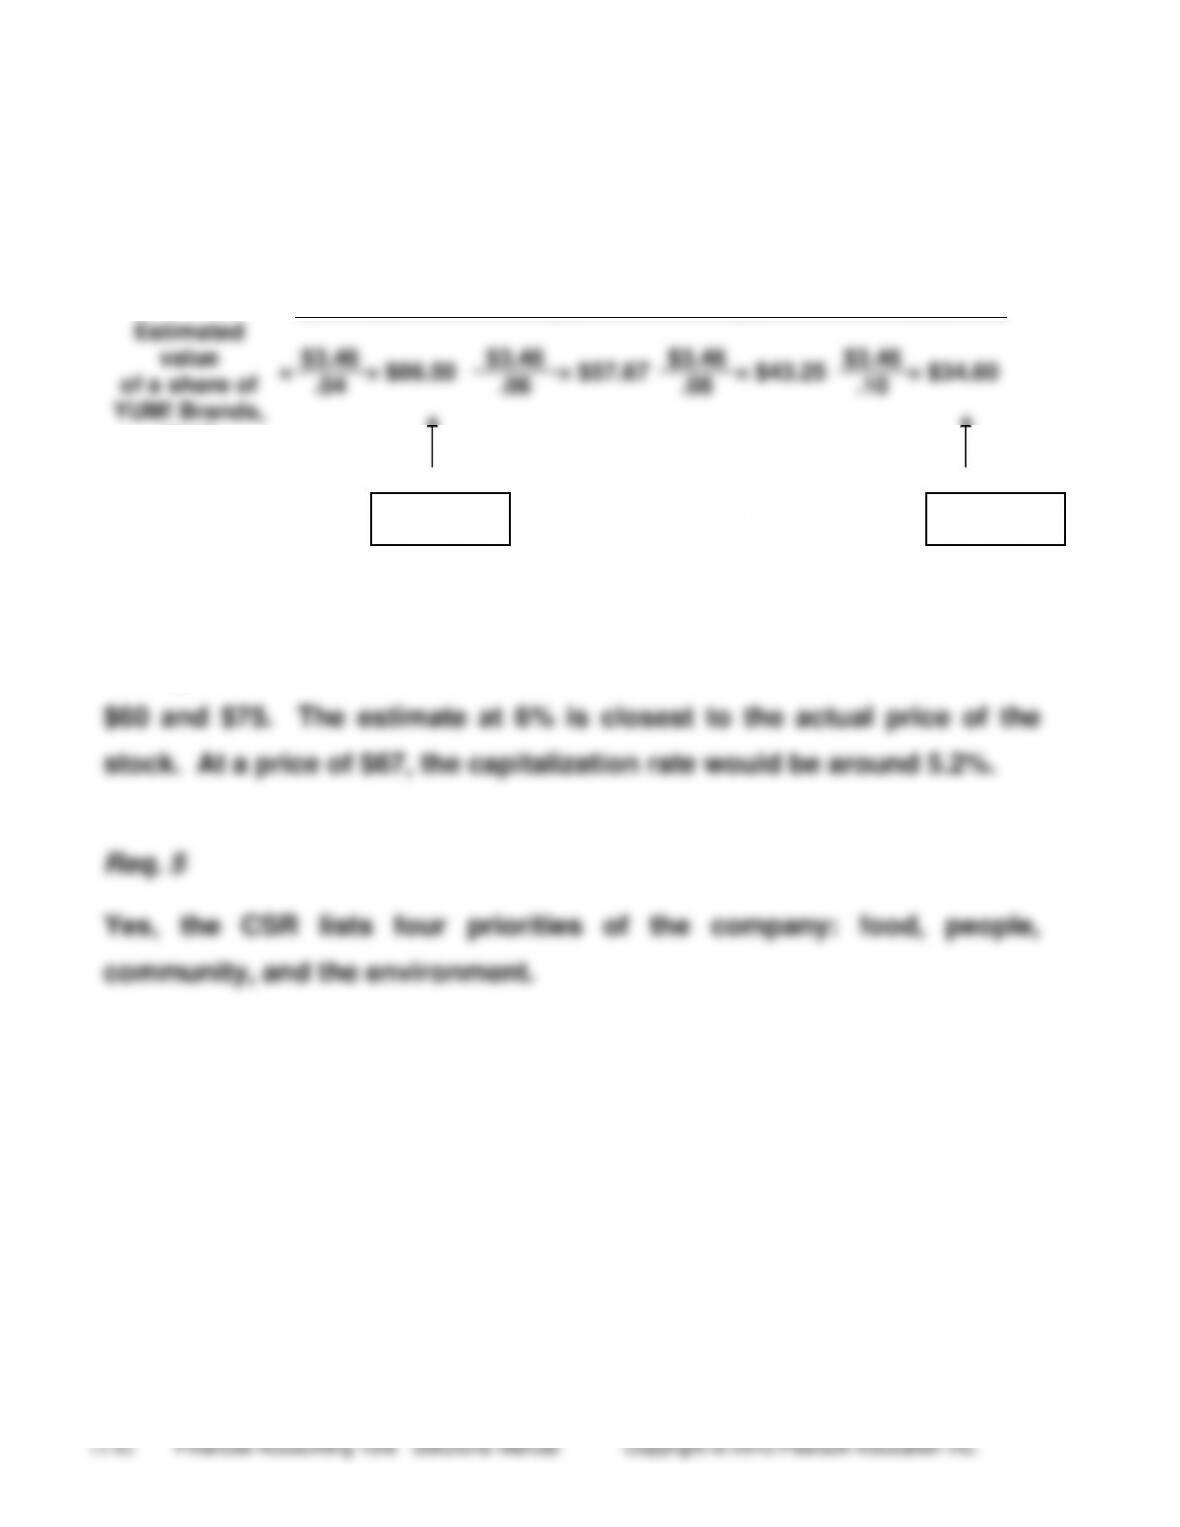
Req. 3
Investment Capitalization Rate
4%
6%
8%
10%
Estimated
value
of a share of
YUM! Brands,
stock
=
$3.46
= $86.50
$3.46
= $57.67
$3.46
= $43.25
$3.46
= $34.60
.04
.06
.08
.10
Req. 4
During the first six months of 2013, YUM! Brands’ stock traded between
Low Risk
High Risk

Chapter 11 Evaluating Performance: Earnings Quality, the Income Statement, & the Statement of Comprehensive Income
11–63
Group Project
1-2 hours