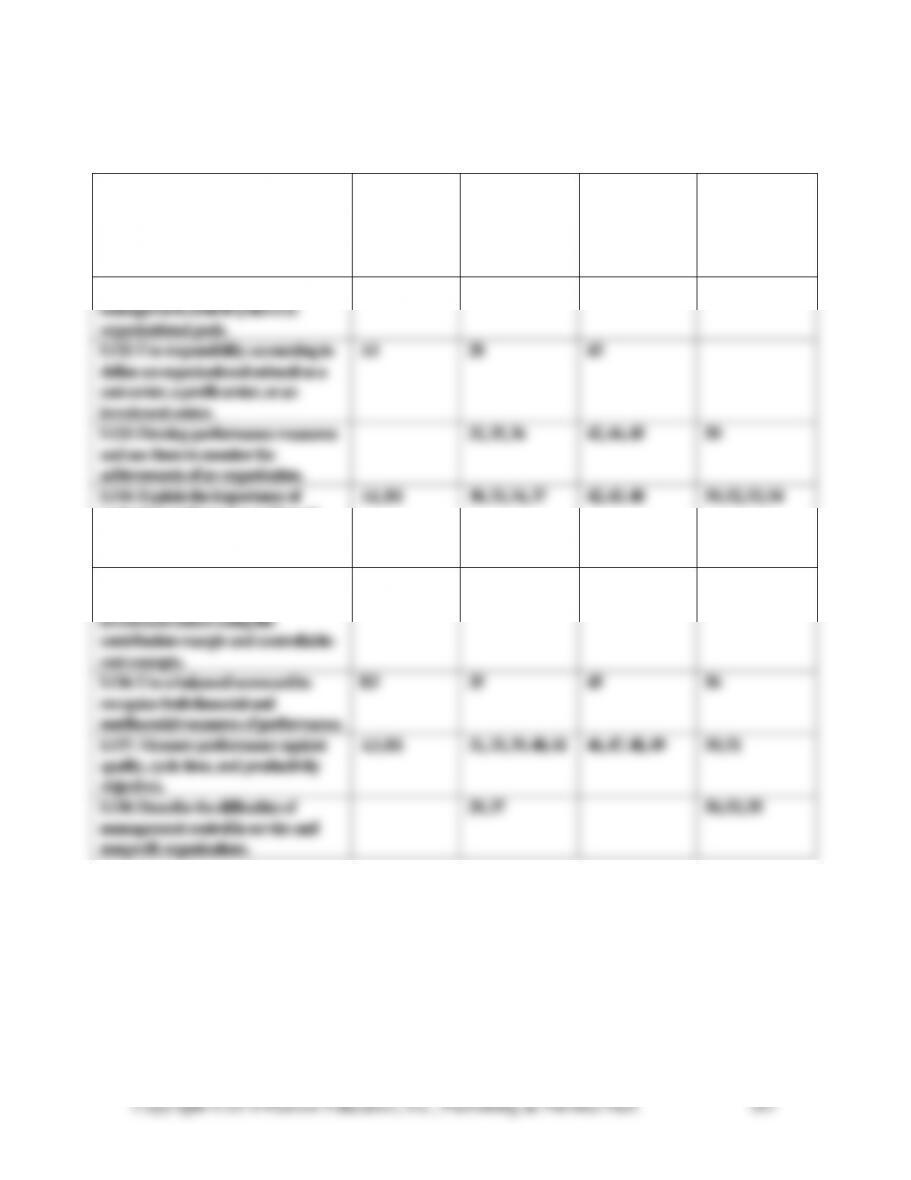
CHAPTER 9
COVERAGE OF LEARNING OBJECTIVES
LEARNING OBJECTIVE
FUNDA–
MENTAL
ASSIGN–
MENT
MATERIAL
CRITICAL
THINKING
EXERCISES
AND
EXERCISES
PROBLEMS
CASES,
EXCEL,
COLLAB., &
INTERNET
EXERCISES
LO1: Describe the relationship of
management control systems to
organizational goals.
28, 30, 36
50, 52, 53, 54
LO2: Use responsibility accounting to
define an organizational subunit as a
cost center, a profit center, or an
investment center.
A1
28
43
LO3: Develop performance measures
and use them to monitor the
achievements of an organization.
32, 35, 36
42, 44, 45
50
LO4: Explain the importance of
evaluating performance and how it
impacts motivation, goal congruence,
and employee effort.
A1, B1
30, 33, 34, 37
42, 43, 48
50, 52, 53, 54
LO5: Prepare segment income
statements for evaluating profit and
investment centers using the
contribution margin and controllable–
cost concepts.
A2, B2
38
43
52, 54
LO6: Use a balanced scorecard to
recognize both financial and
nonfinancial measures of performance.
B3
35
45
56
LO7: Measure performance against
quality, cycle time, and productivity
objectives.
A3, B1
31, 33, 39, 40, 41
46, 47, 48, 49
50, 51
LO8: Describe the difficulties of
management control in service and
nonprofit organizations.
29, 37
50, 53, 55
Copyright ©2014 Pearson Education, Inc., Publishing as Prentice Hall.
368
CHAPTER 9
Management Control Systems and Responsibility Accounting
9-A1 (20 min.)
Excel Electronics Company may have a legitimate claim against the supplier that
would offset the penalty. However, the disposition of any claim is a separate issue.
The penalty of $30,000 should be charged to the purchasing department. Amy
Greer may have done everything in her power to see that the special part was delivered
Copyright ©2014 Pearson Education, Inc., Publishing as Prentice Hall.
369
9-A2 (30-40 min.) See Exhibit 9-A2 on the following page.
9-A3 (15-20 min.)
1. Without adjusting for inflation, it appears that both companies had large
increases in productivity in terms of revenues per employee.
20X1 20X7
2. Using productivity measures that are correctly adjusted for inflation, we see that
Forsythe had an increase in productivity between 20X1 and 20X7. In contrast,
Sorteberg decreased its productivity by $121,136 – $115,179 = $5,957 per
employee, a decrease of 5,957 ÷ 121,136 = 4.9%. Although both Forsythe and
Sorteberg had an increase in number of employees, the larger sales increase for
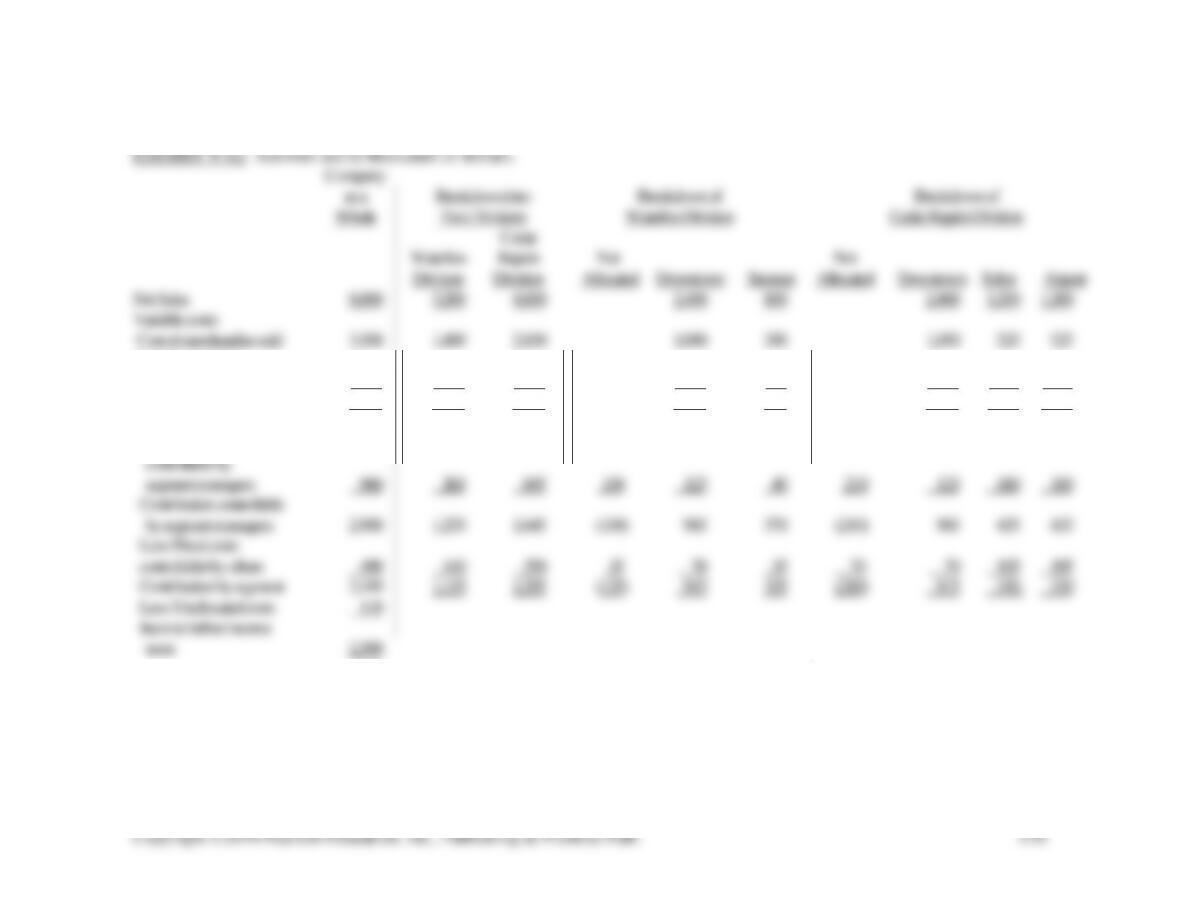
Variable operating
expenses 640 280 360 240 40 240 60 60
Total variable costs 4,140 1,680 2,460 1,290 390 1,290 585 585
Contribution margin 3,860 1,520 2,340 1,110 410 1,110 615 615
Less: Fixed costs
Copyright ©2014 Pearson Education, Inc., Publishing as Prentice Hall.
371
9-B1 (15-20 min.)
1. It is not possible to determine the validity of Liz Elder’s claim that the system is
disadvantageous to her department. It would be valid only if, on a proportional
basis, the number of unidentified rejects caused by the other departments were
2. There are two solutions to this problem. First, remove the apportioned rejects
from the reports and charge the managers with only the rejects identified with

9-B2 (30-35 min.)
2. The incremental costs of running such sightseeing tours can be identified with
much more confidence than in many other instances. Net income will be
improved by the excess of tour revenue over incremental costs; routine allocations
3. If the entire $200,000 of separable discretionary fixed costs can be avoided by
dropping Division No. 1, net income would decrease by the controllable
contribution of $900,000. If only part of the separable discretionary fixed costs
can be avoided, net income would decrease by between $900,000 and the
contribution margin of $1,100,000.
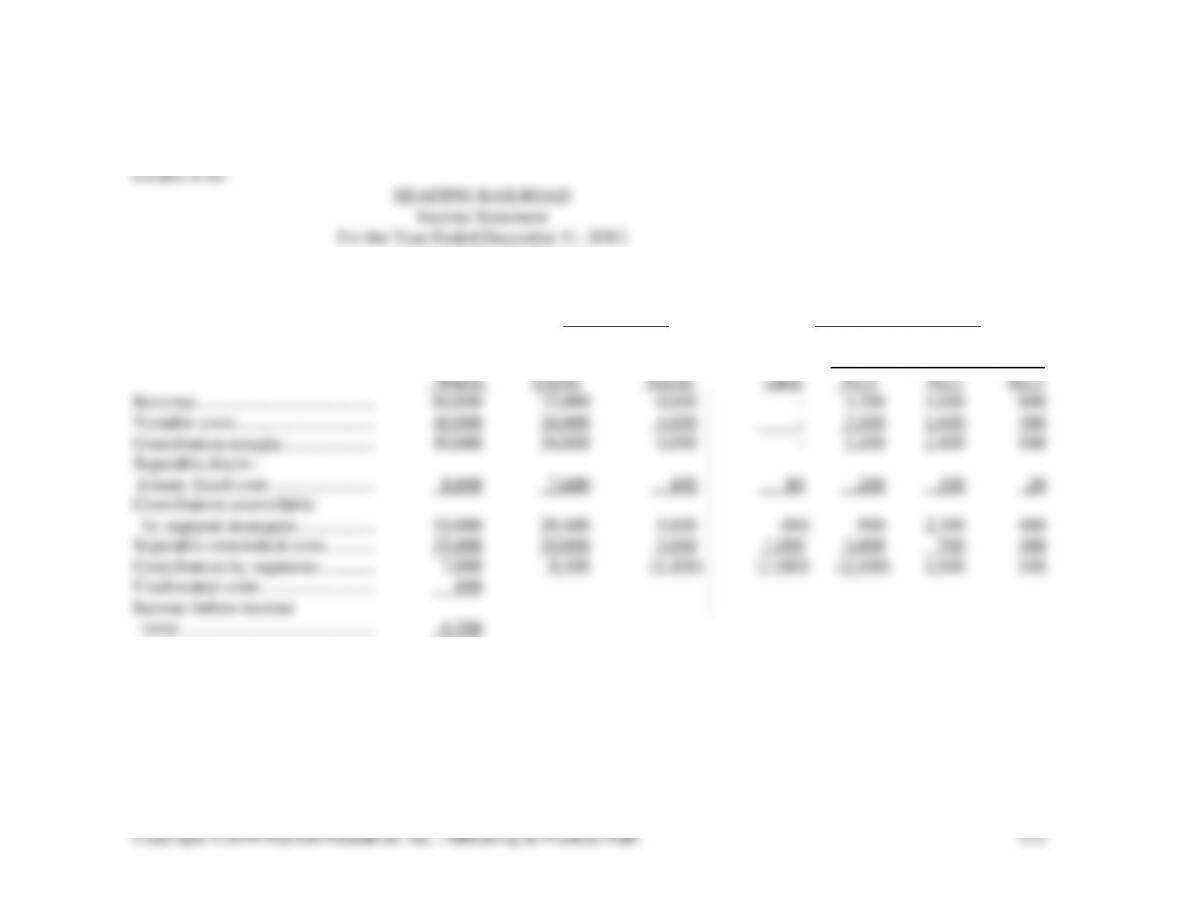
(in thousands of dollars)
Breakdown into Possible Breakdown of
Two Divisions Passenger Traffic Only
Railroad Pas- Not
as a Freight senger Allo- Division
9-B3 (25 min)
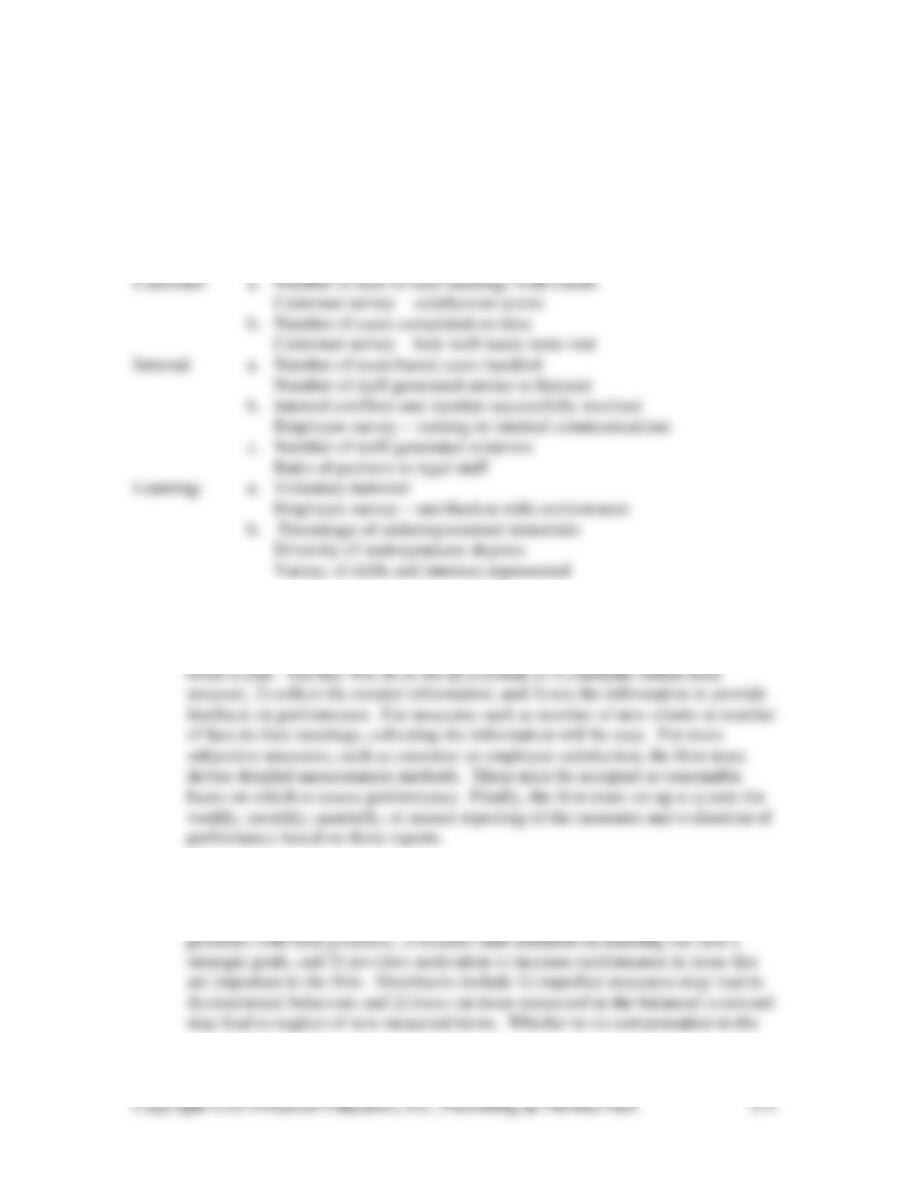
1. Students will come up with many possible measurements. Among the possibilities
are:
Financial: a. Growth in profitability
Number of new clients
Revenues from new clients
2. The firm will want to balance the benefits from the balanced scorecard with the
costs of using it. The firm might routinely collect customer satisfaction scores at
the completion of each case. It might collect employee satisfaction scores once or
3. The impact of a balanced scorecard will be greater if the firm bases individual
performance evaluations and compensation on the scorecard results. This can
have both benefits and drawbacks. Among the benefits are 1) aligns staff

Copyright ©2014 Pearson Education, Inc., Publishing as Prentice Hall.
375
balanced scorecard results is a matter of judgment – whether the benefits
outweigh the drawbacks.
9-1 A management control system is a logical integration of techniques to gather and
9-2 A management control system
❑ clearly defines and communicates the organization’s goals
9-3 The major components of a management control system are:
❑ Setting goals and targets
9-4 A key success factor is a characteristic or attribute that must be achieved in order
to drive the organization towards its goals. Note the difference between a key
success factor and an action. Actions require effort and can be observed on a
9-5 Goals without performance measures may not be completely useless, but
9-6 Some typical corporate goals other than those which immediately improve profit
9-7 Key success factors are those aspects of performance that are essential to achieve

9-8 Examples of sacrificing long-range goals to short-run performance gain are:
a. Wasteful disposal of inventory to improve the turnover rate.
9-9 Three types of responsibility centers are:
9-10 Investment centers go a step farther than profit centers. Both measure profits, but
9-11 Good performance measures will:
• Relate to the organization’s goals.
• Balance long-term and short-term considerations.
9-12 Examples of nonfinancial measures of performance are percentage of products
9-13 Goal congruence and motivation are two aspects important to achieving an
organization’s goals through managers’ actions and decisions. Goal congruence is
9-14 Managers are expected to explain the entire profit of a profit center, but they are
not necessarily evaluated on the entire profit. Managers have the best information

9-15 No. Variable costs vary in direct proportion to output, and fixed costs do not.
However, even in the short run a fixed cost may be controllable by some person
9-16 No. Deducting separable discretionary costs from the contribution margin
managers.
stores.
9-18 Managers should be judged on how well they attain their currently attainable
9-19 No. The contribution margin format does not ignore items that are not a part of
the contribution margin. Rather, it separates costs by their behavior (variable and
9-20 A balanced scorecard is a performance report that contains measures of all the key
9-21 Key performance indicators are measures that drive the organization to achieve its
goals.
9-22 The four categories are:
(a) prevention — costs incurred to prevent the production of defective products or
services,

Copyright ©2014 Pearson Education, Inc., Publishing as Prentice Hall.
378
9-23 Many companies are finding that it is less costly to prevent defects than it is to
identify and correct defects.
9-24 Control of nonfinancial performance requires setting objectives, measuring
9-25 Three measures of productivity are:
(a) Standard direct labor hours allowed for good output achieved
9-26 Comparing productivity measures over time is complicated by changes in the
production process and by inflation. Consider changes in the production process
time.
9-27 Yes. There are several reasons that developing control systems in nonprofit
organizations is more difficult than in profit-seeking organizations, including:
(a) There are often multiple goals, and often the goals are not explicit.
9-28 This question cannot be answered directly from the text. It requires students to
think about an issue closely related to those in the text.
An article in FE: The Magazine for Financial Executives (Vol. 1, No. 8)
1. “The primary focus should be on setting up profit centers. A decentralized
organization allows for expanding profit center accounting. Profit center
2. “A second structural factor in a large, decentralized organization
committed to innovation calls for divisional financial executives to have a direct,
solid-line reporting to the divisional general manager. However, a solid-line
reporting of divisional financial executives to a corporate senior financial
executive virtually precludes an entrepreneurial spirit at the division level.”

Copyright ©2014 Pearson Education, Inc., Publishing as Prentice Hall.
380
headquarters through the monthly financial reporting. The challenge is to provide
a system that maintains financial strength while allowing the flexibility and
independence that produce superior results through innovation and
entrepreneurism.”
e. Analyzing operating results — “One factor in this area stood out: the frequent
reference to comparisons of actual results to budget, giving full weight to non-
controllable factors and to changed conditions.”
9-29 New York City provides a good case study in the consequences of not identifying
and measuring the financial responsibilities of managers and how adding such
measures can lead to organizational success. A responsibility accounting system
keeps top management informed about activities and decisions made by middle-
9-30 In an article in the Web magazine Optimize (April 2003) Bruce Guptill discussed
customer-centric metrics. The four most popular metrics were:
4) increased customer behavior. In addition to these metrics, Volvo might
9-31 Quality, cycle time, and productivity are related because improvements in cycle
time and productivity are dependent upon high quality processes and inputs. High
9-32 There are many possible answers for each company or organization. Examples
are:
• Delta Airlines: Percent on-time arrivals, capacity utilization
9-33 (20 min.)
Plant maintenance should be charged the standard maintenance labor rate of
$14.00. This assumes that the welders are qualified to do the normal plant maintenance
work. It is up to the plant maintenance supervisor to get $14.00 worth of work from the
welders.
The $6.00 hourly rate difference ($20.00 – $14.00) should certainly not be
charged to plant maintenance since the regular help need be paid only $14.00. The $6.00
1. Compensation:
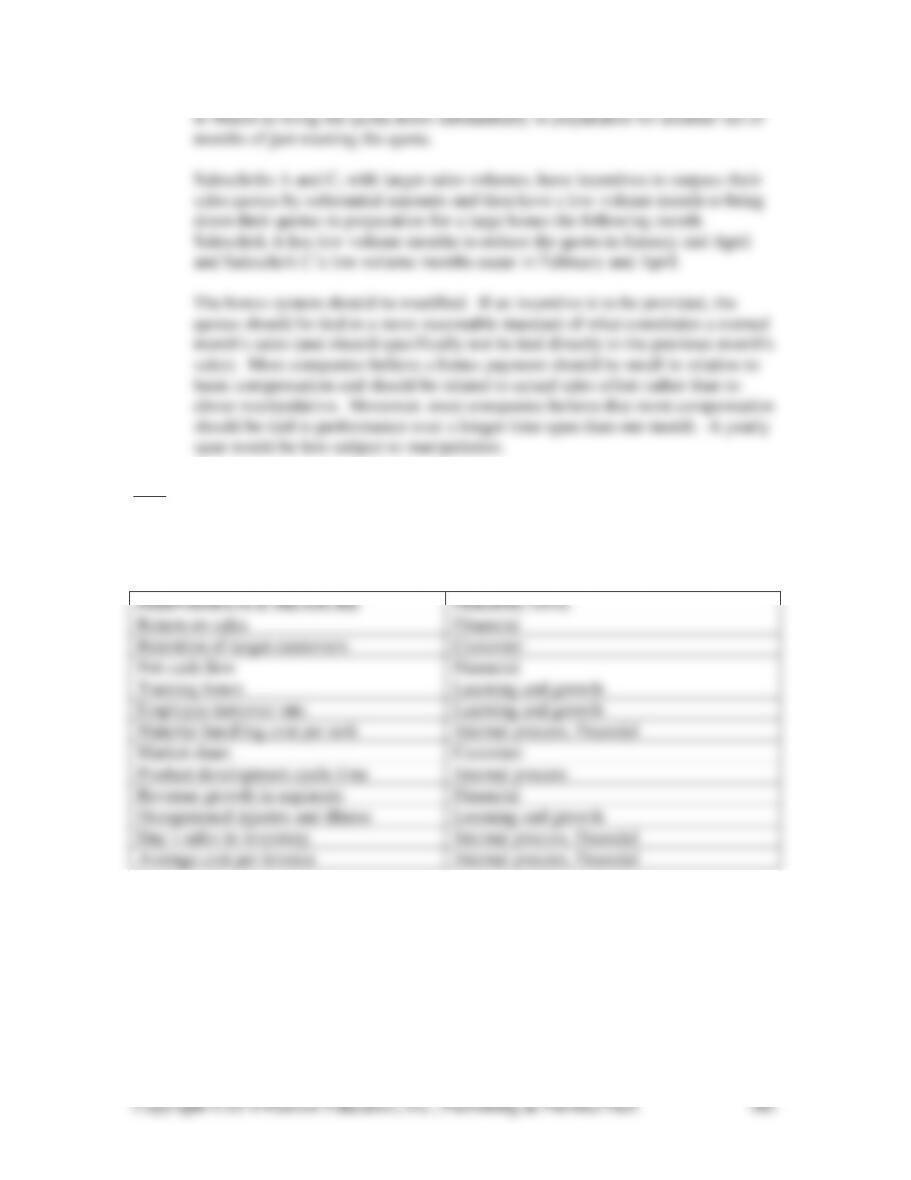
If quota is met: ¥50,000 + ¥68,000+.05 x (actual – quota)
If quota is not met: ¥50,000
2. Notice the wide variation in month-to-month sales and the even wider variation
in compensation. The variation suggests that sales are only partially under the
control of the salesclerks. Therefore, it is likely to be almost impossible for the
salesclerks to continually increase sales by 3% per month.
Given sales quotas of 103% of the previous month’s actual sales, the bonus of
Copyright ©2014 Pearson Education, Inc., Publishing as Prentice Hall.
382
in March to bring the quota down substantially in preparation for another run of
months of just meeting the quota.
Salesclerks A and C, with larger sales volumes, have incentives to surpass their
sales quotas by substantial amounts and then have a low volume month to bring
down their quotas in preparation for a large bonus the following month.
Salesclerk A has low volume months to reduce the quota in January and April
and Salesclerk C’s low volume months occur in February and April.
The bonus system should be modified. If an incentive is to be provided, the
quotas should be tied to a more reasonable standard of what constitutes a normal
month’s sales (and should specifically not be tied directly to the previous month’s
sales). Most companies believe a bonus payment should be small in relation to
basic compensation and should be related to actual sales effort rather than to
clever manipulation. Moreover, most companies believe that most compensation
should be tied to performance over a longer time span than one month. A yearly
span would be less subject to manipulation.
9-35 (10 min.)
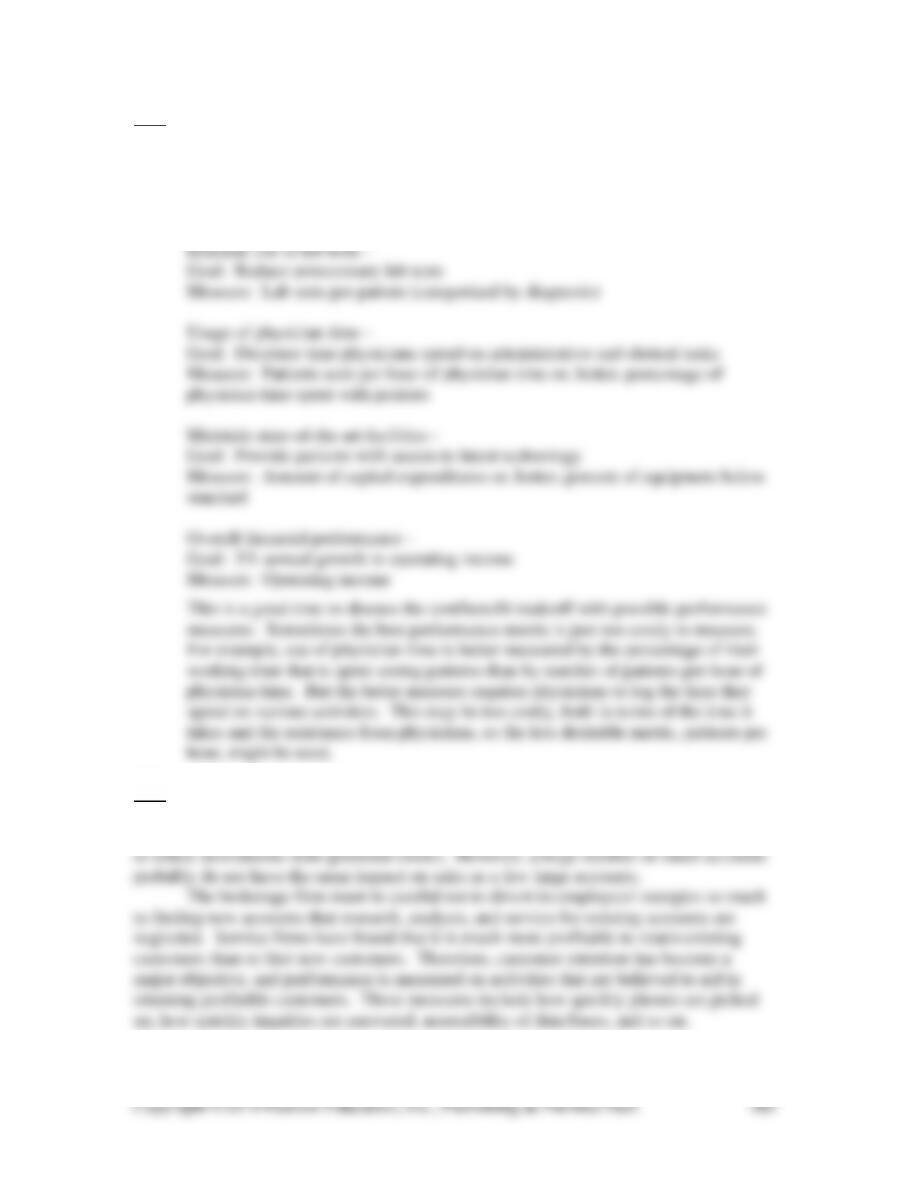
Students may classify some of these measures differently than shown here. The point
should be made that the important feature in a balance scorecard is to have all
perspectives represented.
PERFORMANCE MEASURE
PERSPECTIVE
Return on sales
Financial
Retention of target customers
Customer
Net cash flow
Financial
Training hours
Learning and growth
Employee turnover rate
Learning and growth
Material handling cost per unit
Internal process, financial
Market share
Customer
Product development cycle time
Internal process
Revenue growth in segments
Financial
Occupational injuries and illness
Learning and growth
Day’s sales in inventory
Internal process, financial
Average cost per invoice
Internal process, financial
9-36 (10-15 min.) Students will suggest many different goals and measures in each
area. This solution lists one possibility for each of the five areas.
Customer Satisfaction –
Goal: Reduce customer waiting time
Measure: Average time from check-in until seeing a physician
9-37 (15-20 min.)
Increasing sales activity can be related to increased number of new accounts; thus
many stock brokerages set objectives for its brokers to make a set number of “cold calls”
9-38 (15 – 20 min.)
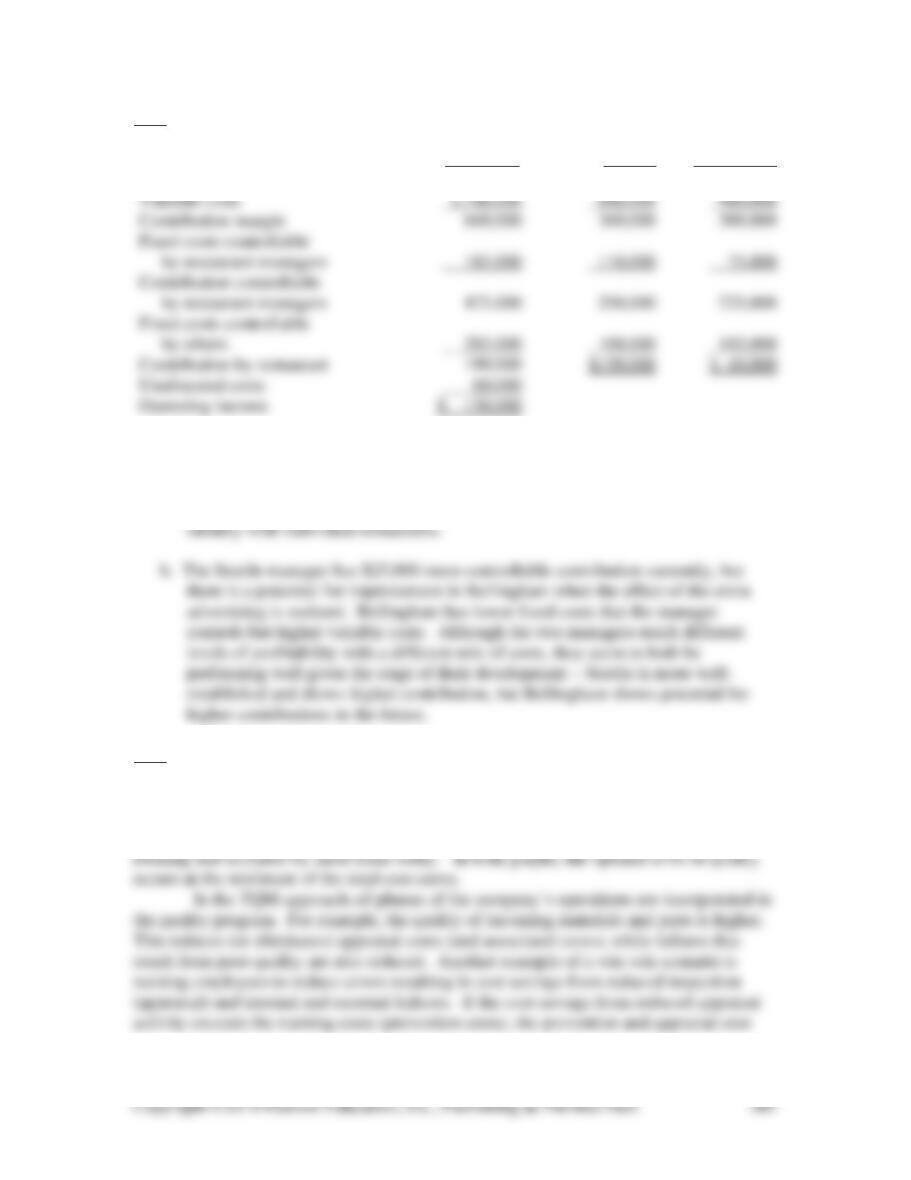
1.
Company Seattle Bellingham
Revenues $2,400,000 $1,200,000 $1,200,000
2. a. The new restaurant in Bellingham is not yet as profitable as the Seattle restaurant.
The advertising campaign to build up the customer base in Bellingham weighs on
the profits of the Bellingham restaurant. However, both restaurants have a
positive contribution after subtracting all costs that the company can specifically
9-39 (10-15 min.)
The figures on the next page can be used as both a solution to this exercise and
point of further discussion. The left-hand graph in the exercise (and the top graph below)
represents the traditional view of quality costs, while the right-hand graph in the exercise
(and the bottom graph below) represent the view espoused by “total–quality” guru
Copyright ©2014 Pearson Education, Inc., Publishing as Prentice Hall.
385
curve will shift downward, as shown in the Total Quality Management panel. As a result,
the minimum of the total cost curve shifts to the right.
The minimum total cost occurs at a higher level of quality under the TQM view.
Also note that the total cost of quality is lower for firms producing higher quality
products or services. Deming predicted this by pointing to the close relationship between
quality and costs such as waste, rework, returns, lost sales, and inspection.
9-40 (10-15 min.)
1. One trend is the overall upward trend in defective units. The overall rate of
defective units has almost doubled during the last 8 weeks, from about .75% the
2. It is essential to arrest and reverse the overall trend toward more defective units.
Even by the first week of this eight-week period, the defective rate was well
above the target of .5%, and it grew each of the eight weeks. The control chart