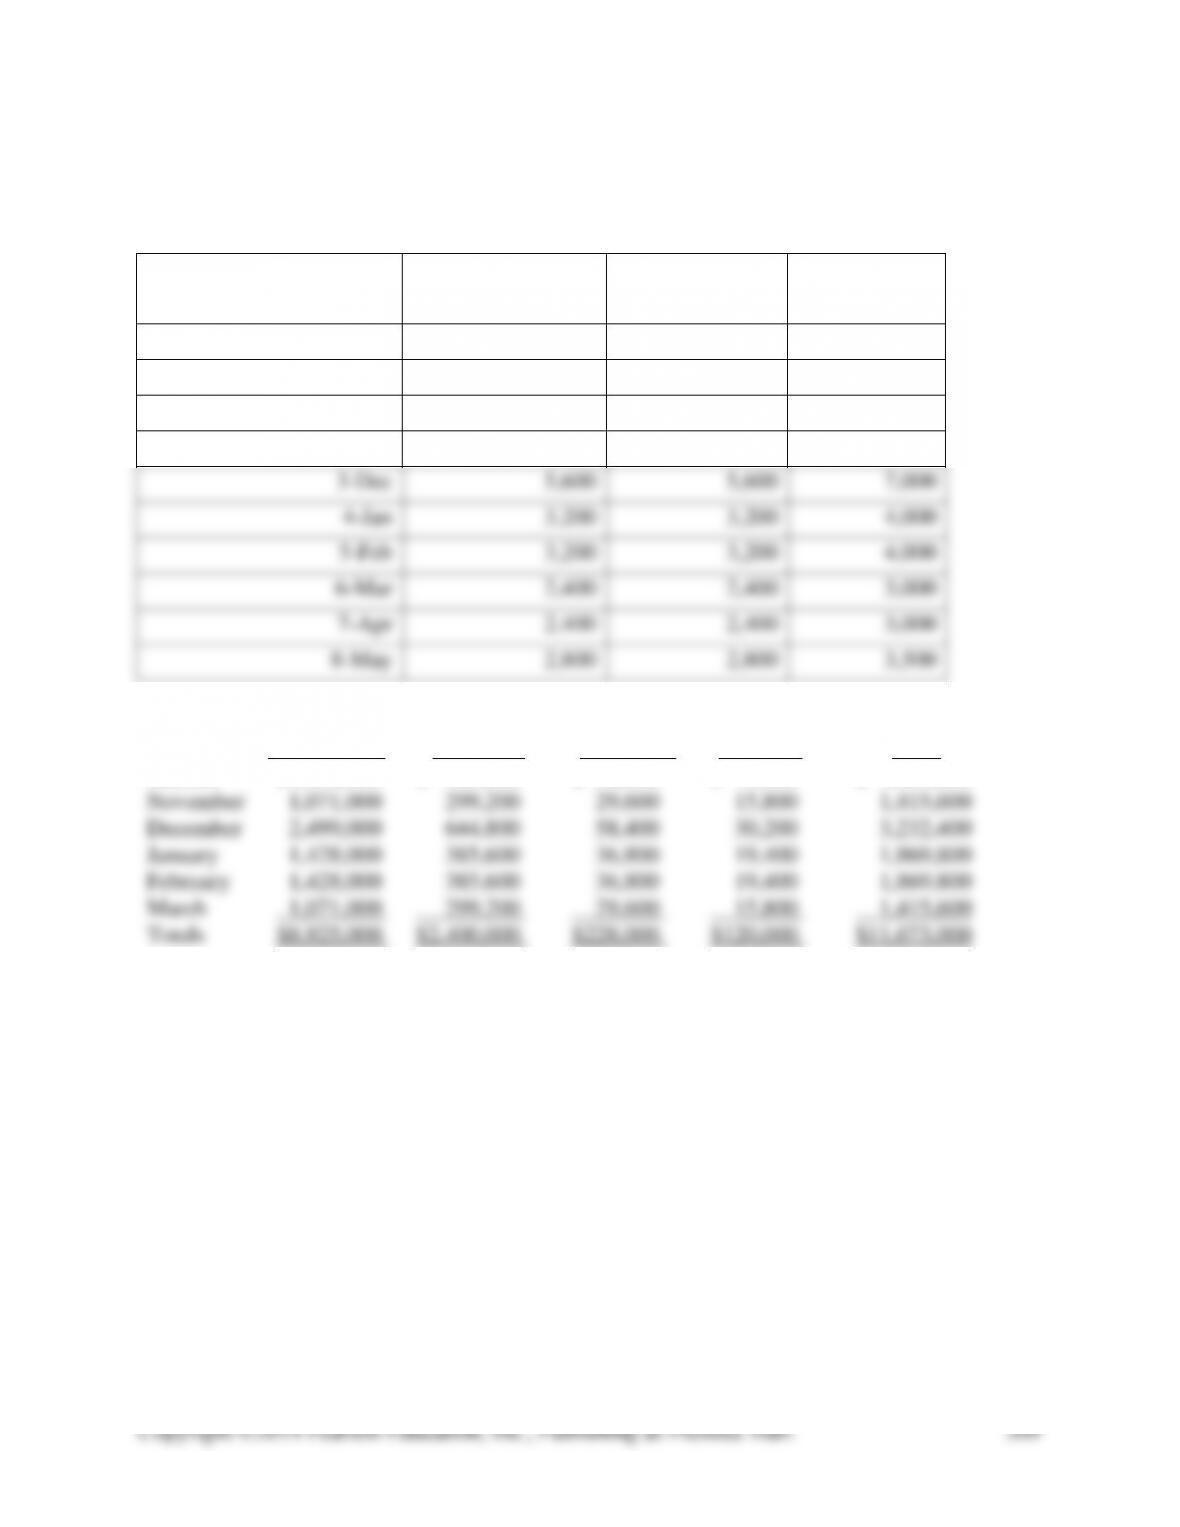
EXHIBIT 7-42A
HIGH DEFINITION LCD DIVISION
Sales forecasts
50” Displays
42” Displays
Sales mix
1
1.25
Month
Sales change
1
1
1-Oct
3,200
3,200
4,000
2-Nov
2,400
2,400
3,000
3-Dec
5,600
5,600
7,000
4-Jan
3,200
3,200
4,000
5-Feb
3,200
3,200
4,000
6-Mar
2,400
2,400
3,000
7-Apr
2,400
2,400
3,000
8-May
2,800
2,800
3,500
OPERATING EXPENSES
Components Assembly Packaging Shipping Total
October $1,428,000 $ 385,600 $ 36,800 $ 19,400 $ 1,869,800
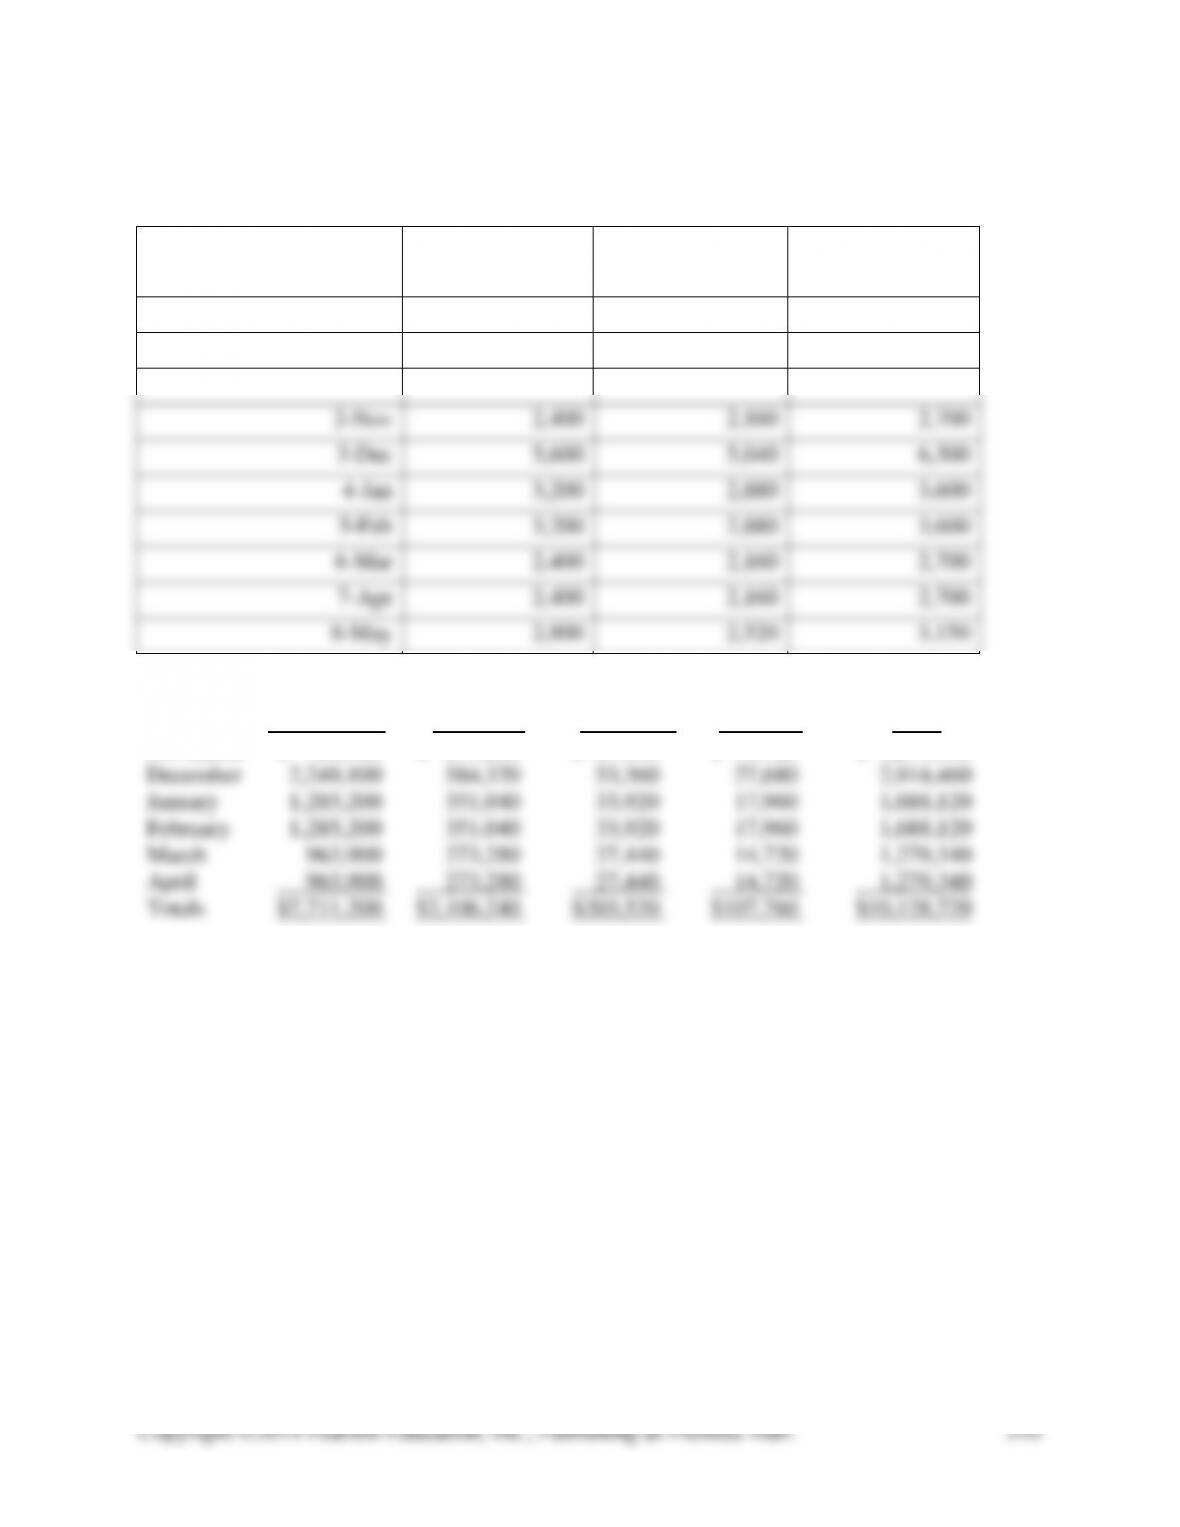
EXHIBIT 7-42B
Revised Budget for 10% Sales Decrease
Sales forecasts
50” Displays
42” Displays
Sales mix
1
1.25
Month
Sales change
0.9
0.9
2-Nov
2,400
2,160
2,700
3-Dec
5,600
5,040
6,300
4-Jan
3,200
2,880
3,600
5-Feb
3,200
2,880
3,600
6-Mar
2,400
2,160
2,700
7-Apr
2,400
2,160
2,700
8-May
2,800
2,520
3,150
OPERATING EXPENSES
Components Assembly Packaging Shipping Total
November $ 963,900 $ 273,280 $ 27,440 $ 14,720 $ 1,279,340
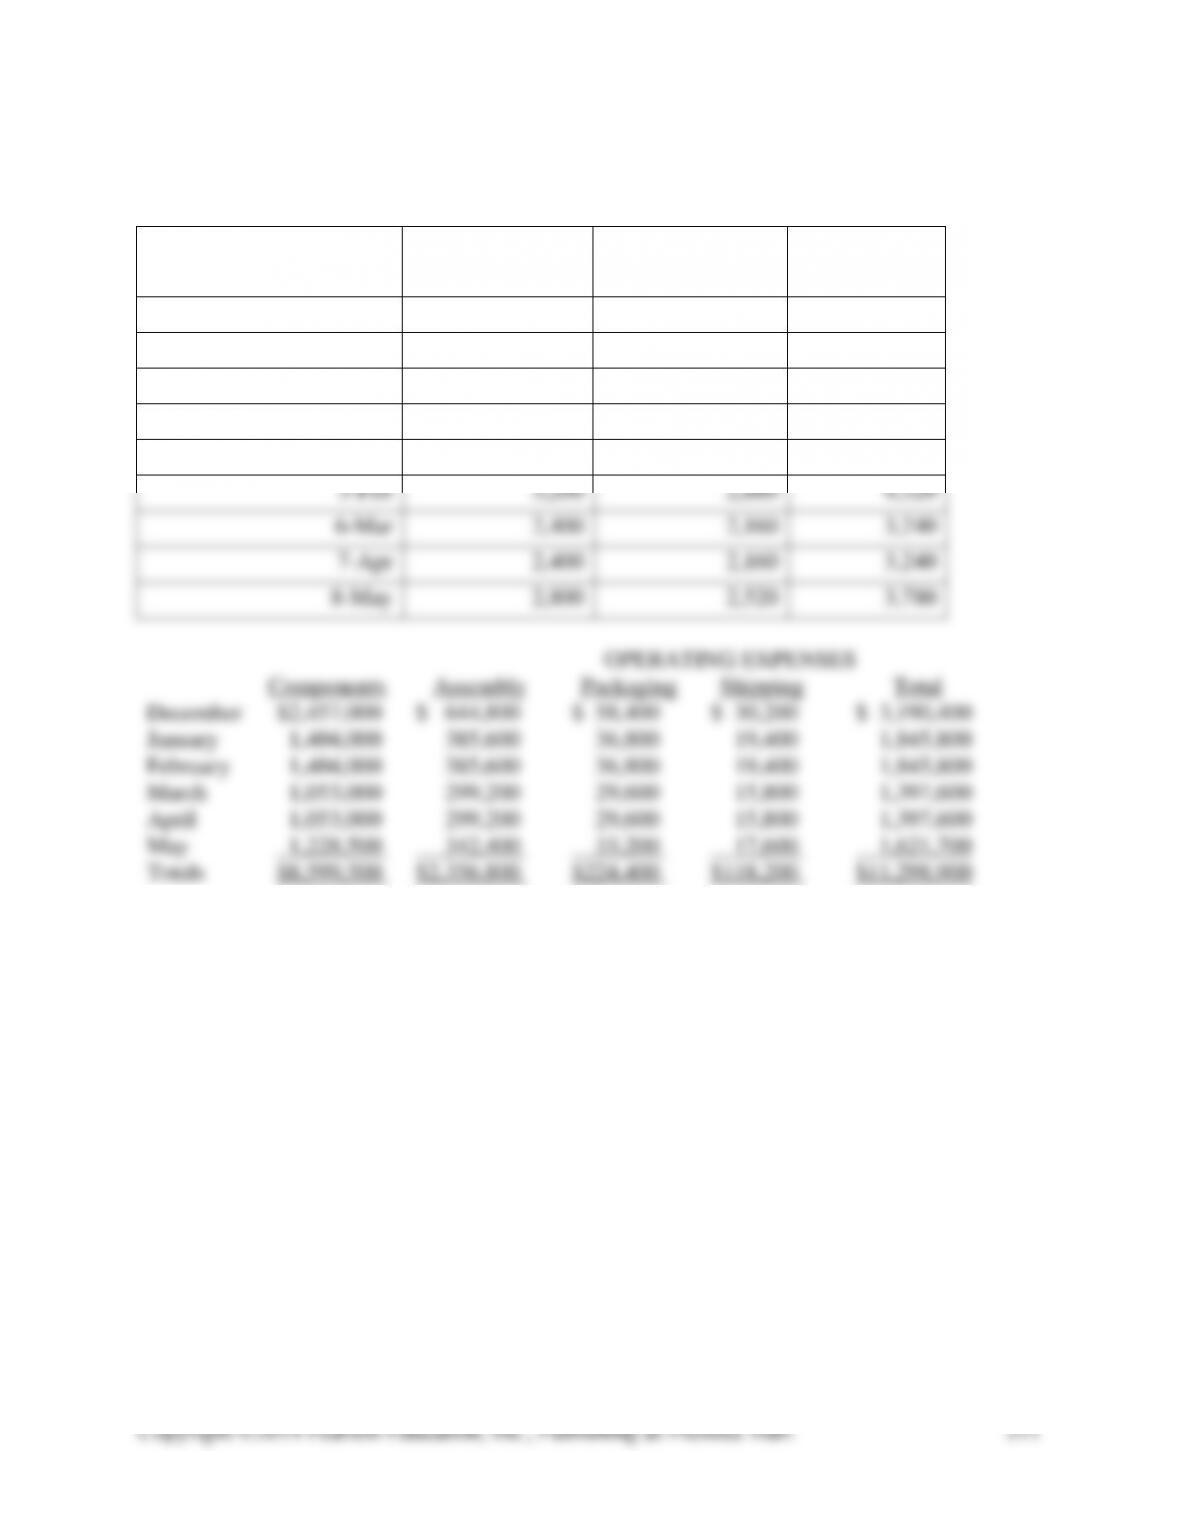
EXHIBIT 7-42C
Revised Budget for Increased Sales of 42” Displays
Sales forecasts
50” Displays
42” Displays
Sales mix
1
1.5
Month
Sales growth
0.9
0.9
3-Dec
5,600
5,040
7,560
4-Jan
3,200
2,880
4,320
5-Feb
3,200
2,880
4,320
6-Mar
2,400
2,160
3,240
7-Apr
2,400
2,160
3,240
8-May
2,800
2,520
3,780
OPERATING EXPENSES
Components Assembly Packaging Shipping Total
December $2,457,000 $ 644,800 $ 58,400 $ 30,200 $ 3,190,400
January 1,404,000 385,600 36,800 19,400 1,845,800
February 1,404,000 385,600 36,800 19,400 1,845,800
March 1,053,000 299,200 29,600 15,800 1,397,600
April 1,053,000 299,200 29,600 15,800 1,397,600
May 1,228,500 342,400 33,200 17,600 1,621,700
Totals $8,599,500 $2,356,800 $224,400 $118,200 $11,298,900
7-43 (80-100 min.)
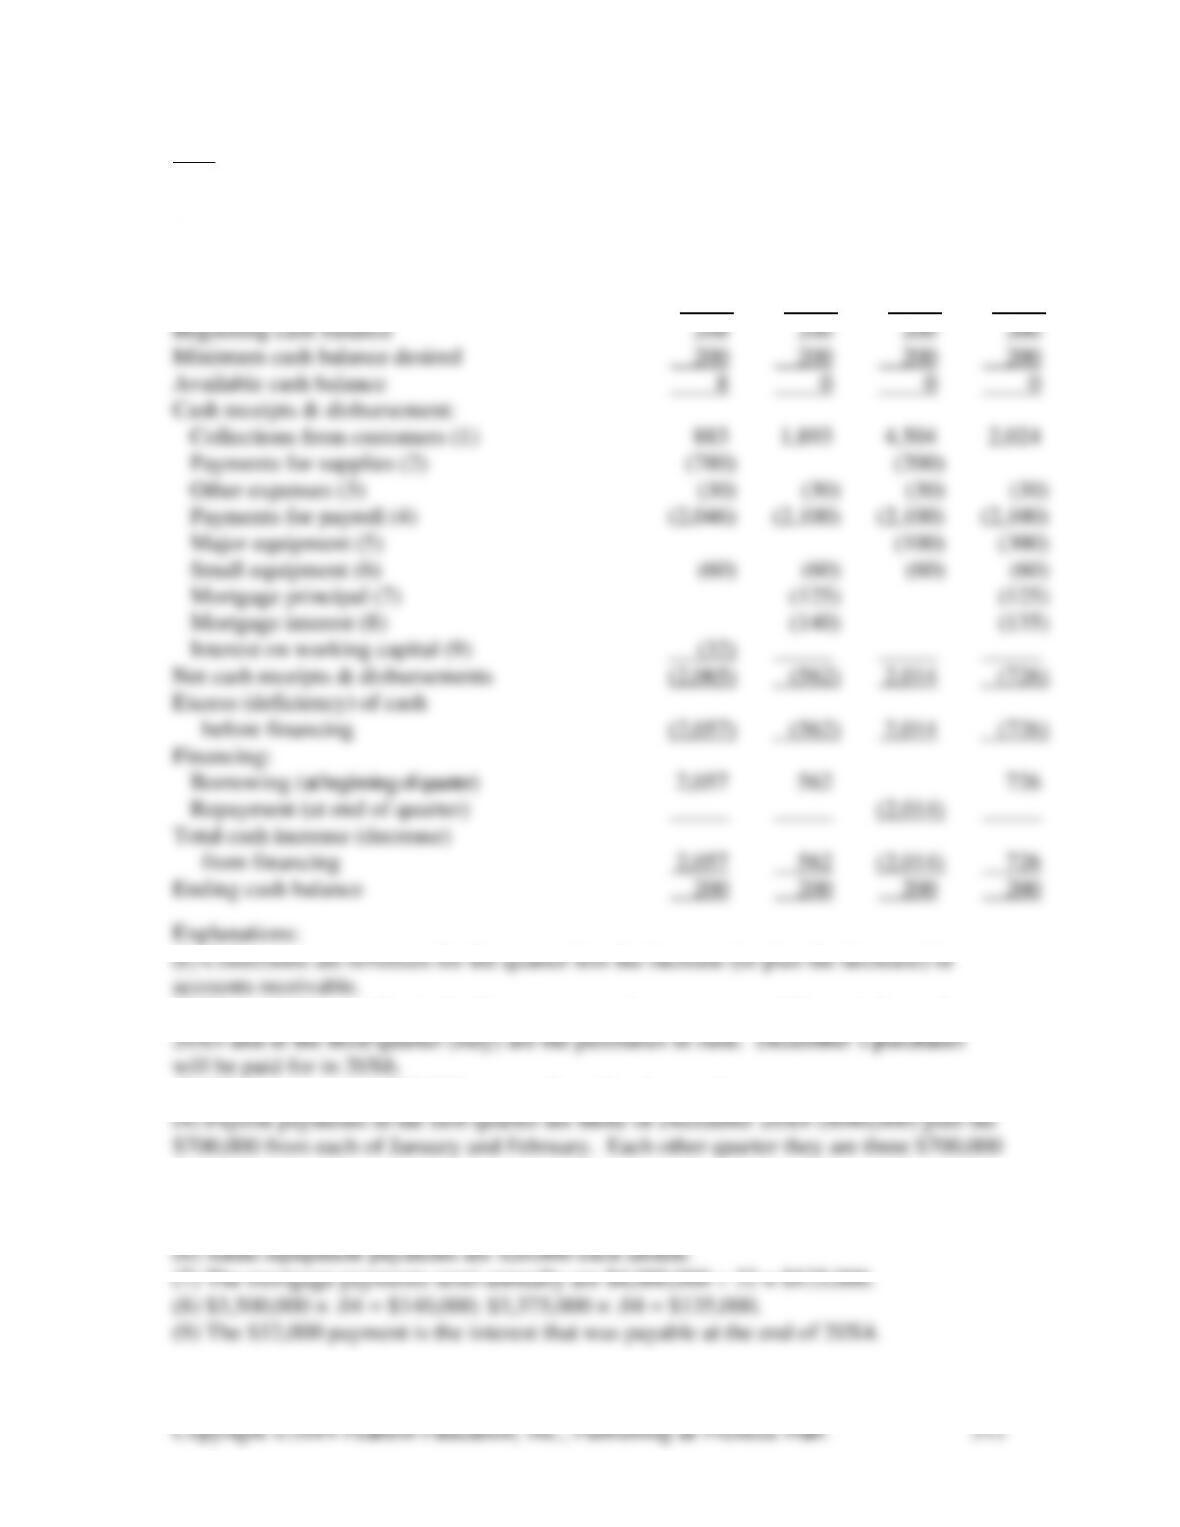
1. On January 1, Salt Lake Light Opera needs to borrow $2,057,000, on April 1 it
needs an additional $562,000, on September 31 it can repay $2,014,000, but on October 1
it must again borrow $726,000. This can be seen from the following analysis (in
thousands of dollars):
Qtr. 1 Qtr. 2 Qtr. 3 Qtr. 4
(2) Payments for supplies in the first quarter are the accounts payable carried over from
(3) Other expenses are $10,000 per month, paid as incurred.
payments.
(5) $100,000 of major equipment payments are made in September, October, November,
and December.
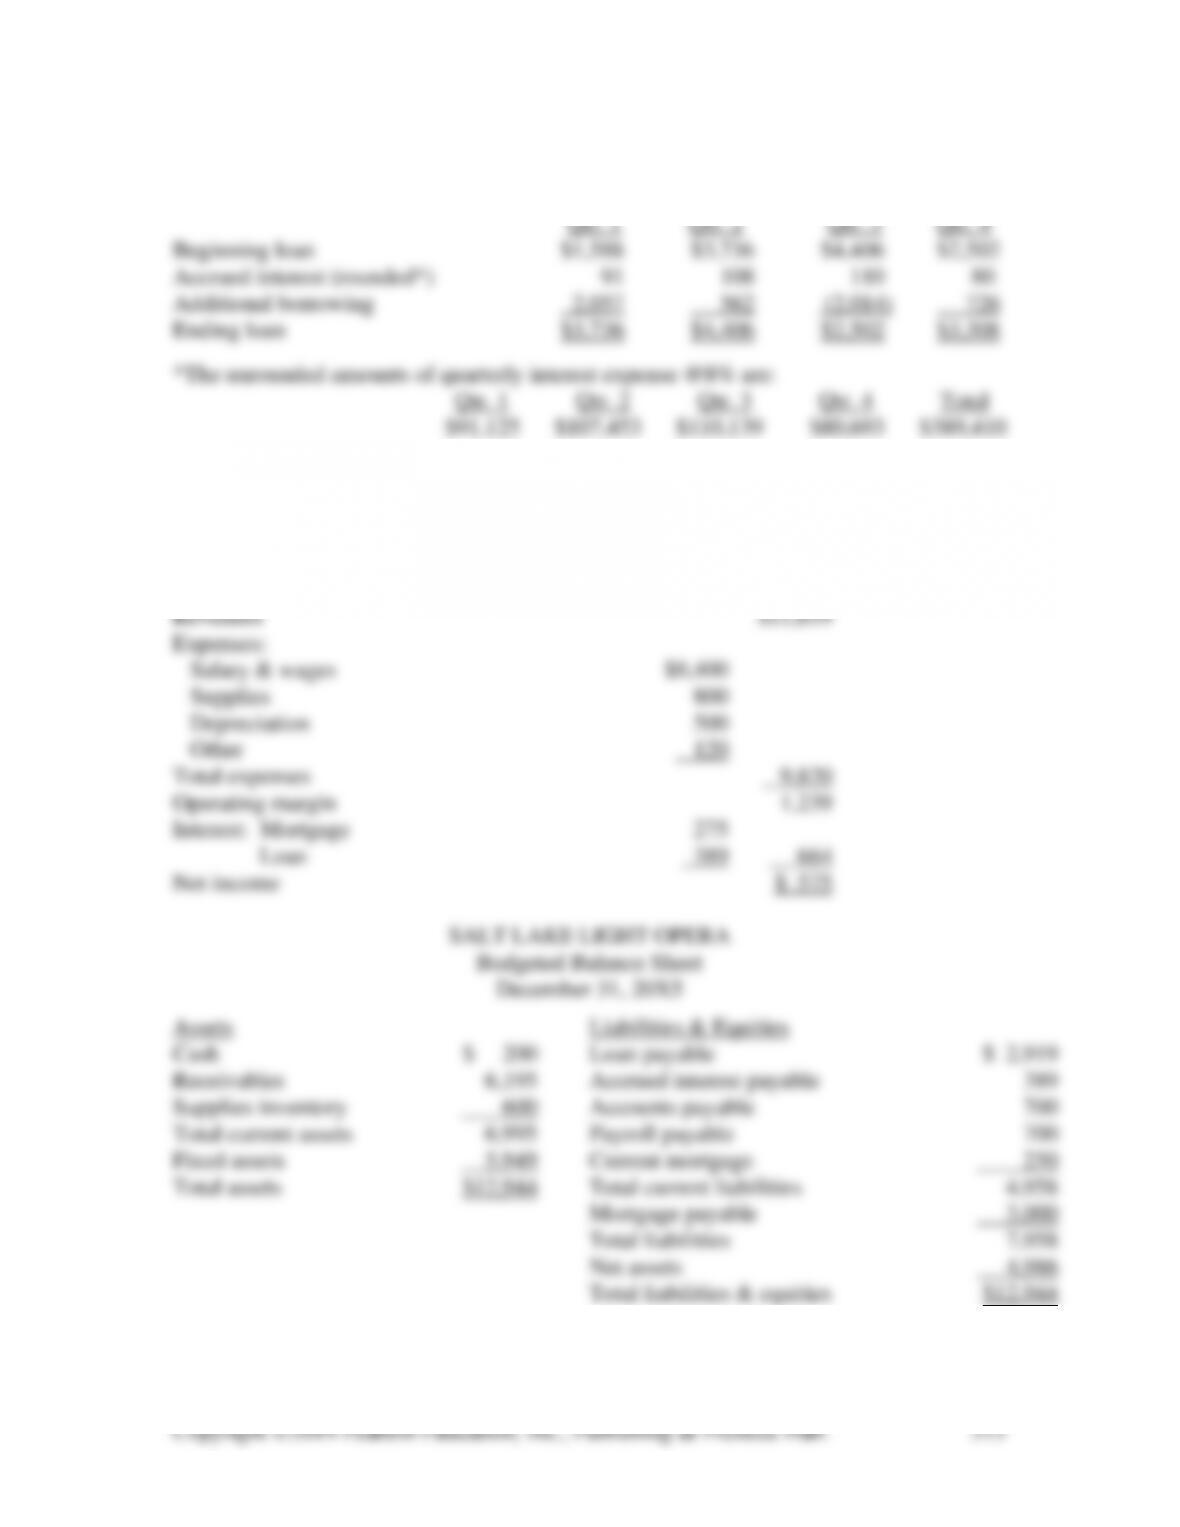
The result of 20X5 operations will be an increase in the working capital loan from
$1,588,000 (without the accrued interest) to $3,308,000, an increase of $1,720,000:
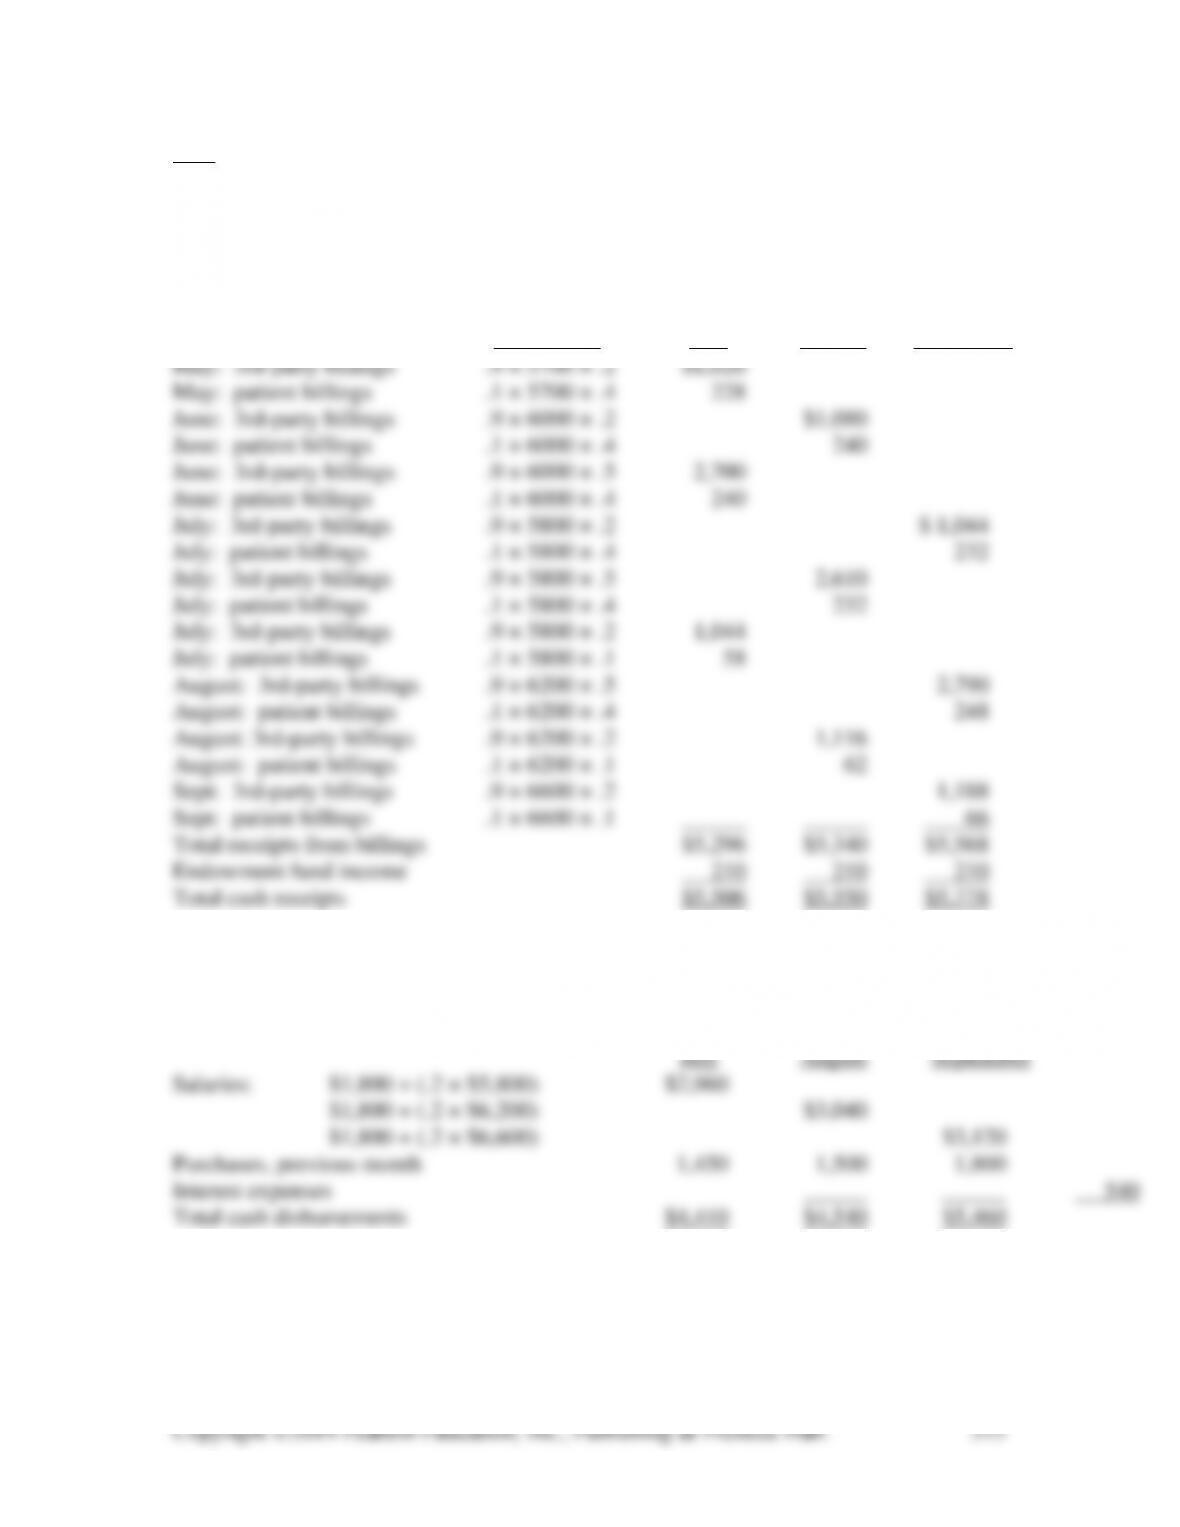
2. Salt Lake Light Opera’s projected income statement and balance sheet for 20X5
are (in thousands):
SALT LAKE LIGHT OPERA
Budgeted Income Statement
For the Year Ended December 31, 20X5

3. Salt Lake Light Opera has a net income of $575,000 but a shortfall in cash requiring
borrowing of $1,720,000 ($1,331,000 borrowed plus accrued interest of $389,000). This
is not uncommon for a growing organization. However, it is borrowing on a short-term
7-44 (40-60 min.)
1. HIGHLINE HOSPITAL
Budgeted Cash Receipts
For the Quarter Ending September 30, 20X7
(in thousands)
Calculation July August September
2. Budgeted Cash Disbursements
For the Quarter Ending September 30, 20X7
(in thousands)
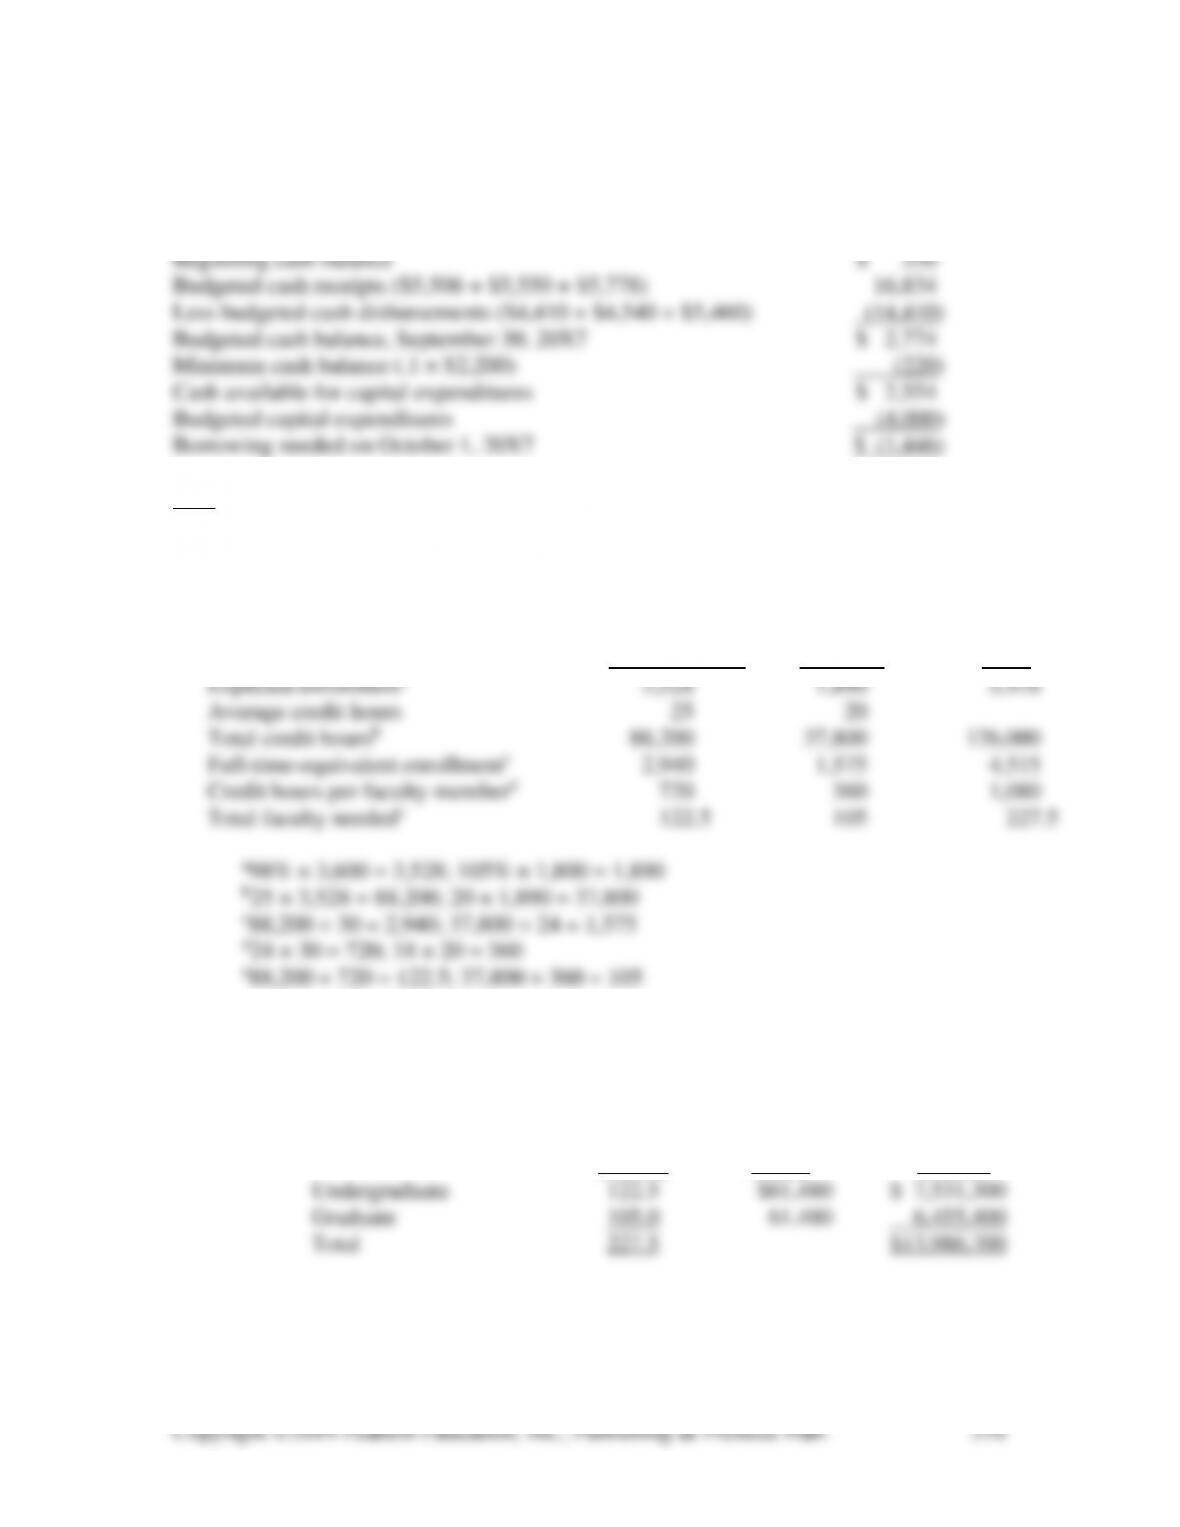
3. Budgeted Cash Receipts and Disbursements
For the Third Quarter, 20X7
(in thousands)
7-45 (50-60 min.)
1. NEBRASKA STATE UNIVERSITY
Projected Enrollment, Credits, and Faculty
Academic Year 20X7-20X8
Undergraduate Graduate Total
2. NEBRASKA STATE UNIVERSITY
Faculty Salaries Budget
Academic Year 20X7-20X8
Total
Faculty Average Faculty
Needed Salary Salaries
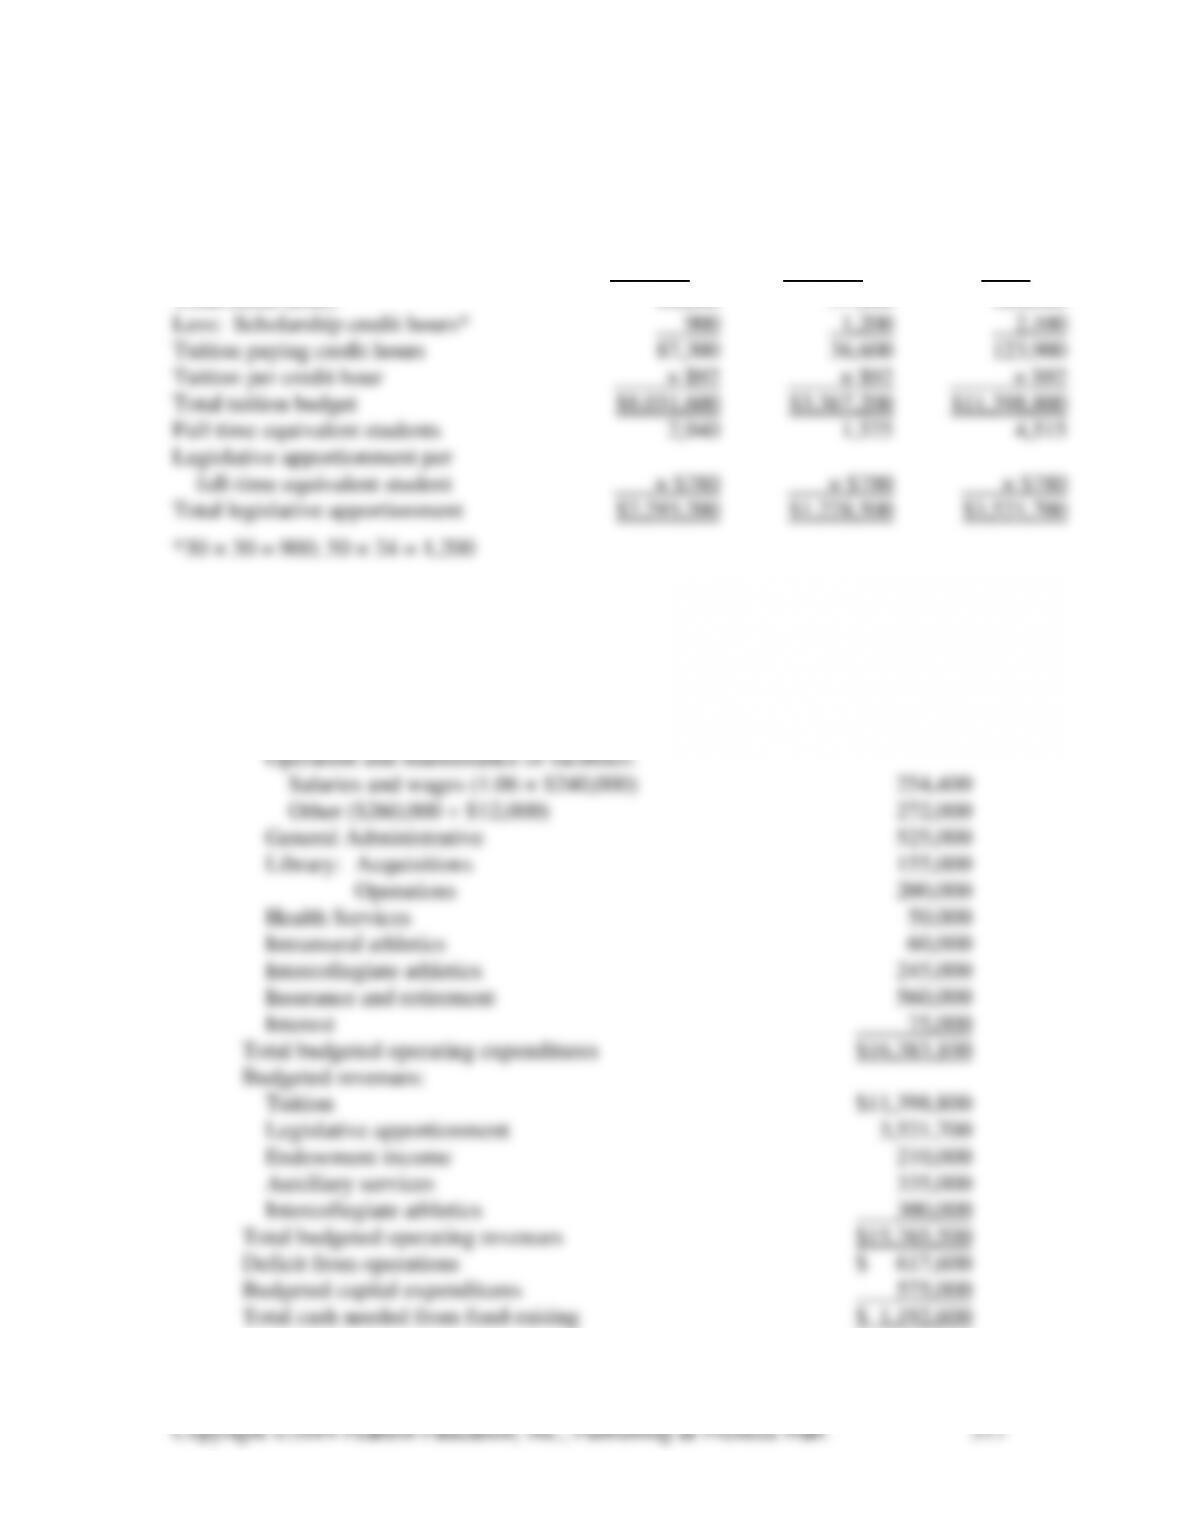
3. NEBRASKA STATE UNIVERSITY
Tuition and Legislative Revenue Budget
Academic Year 20X7-20X8
Undergrad Graduate
Division Division Total
Total credit hours 88,200 37,800 126,000
4. NEBRASKA STATE UNIVERSITY
Annual Budget Shortfall
Academic Year 20X7-20X8
Budgeted operating expenditures:
Faculty salaries $13,986,700
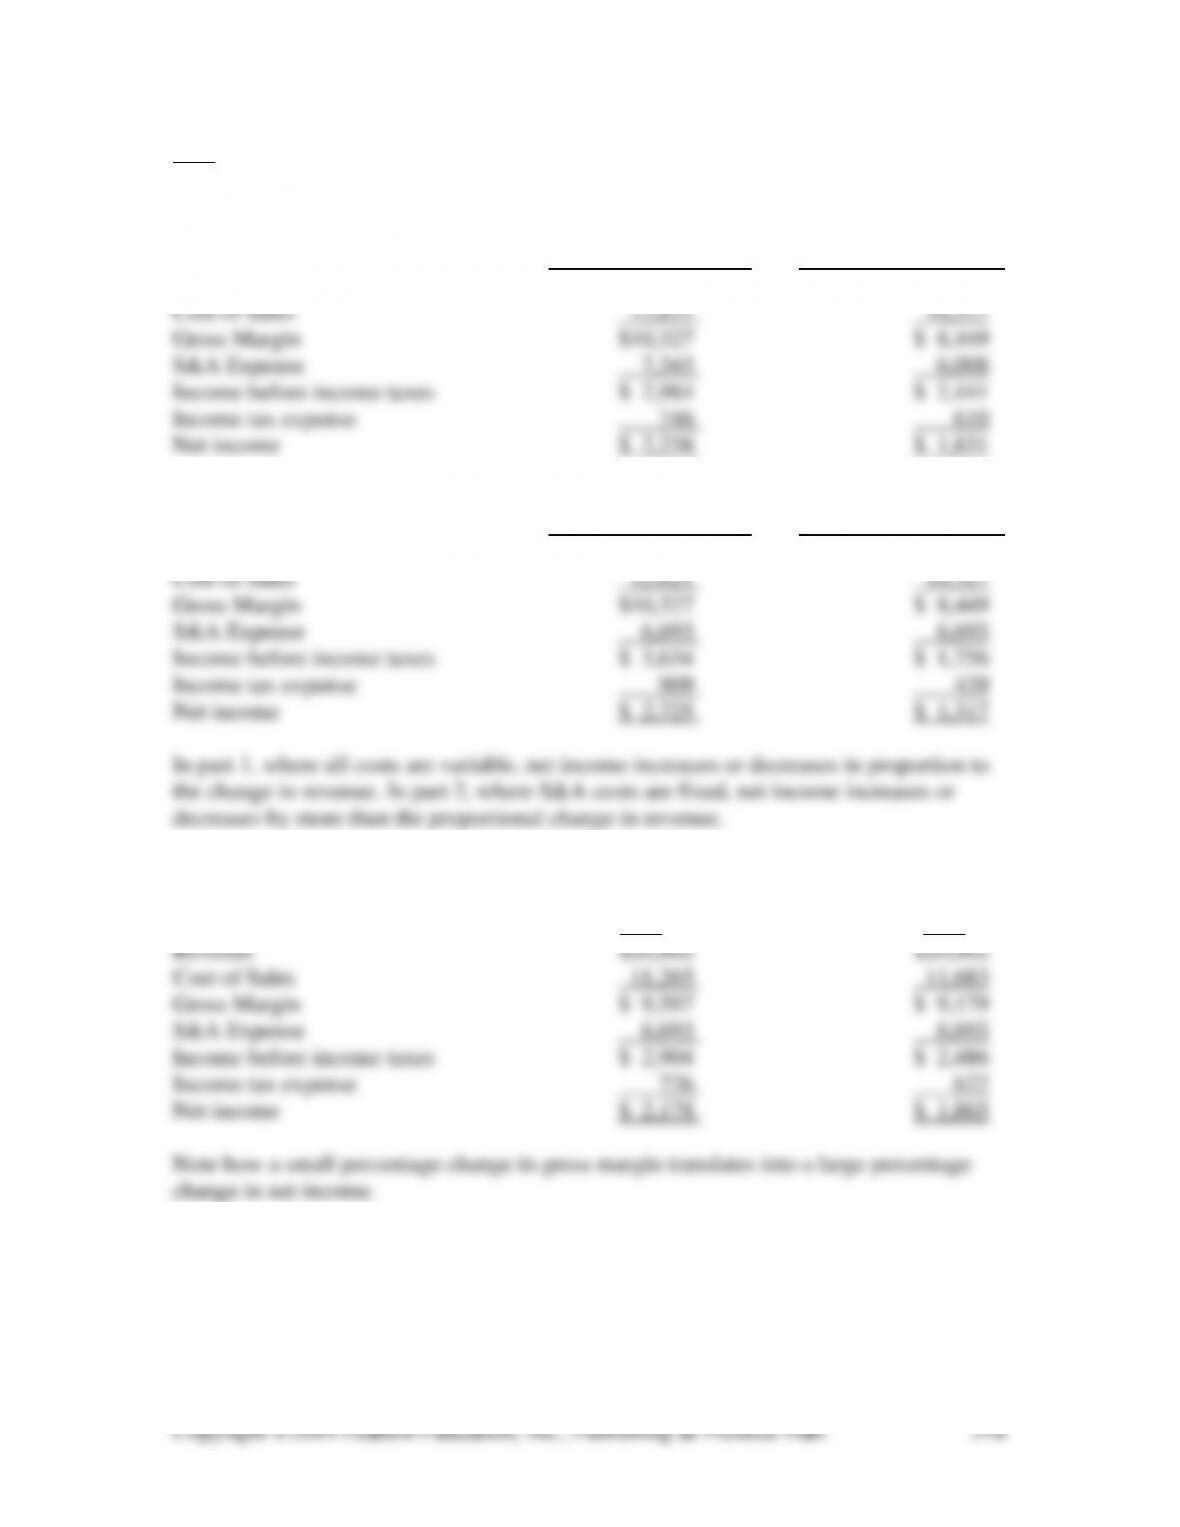
7-46 (30 min.) Amounts are in millions.
Revenue in Fiscal 2011 was $20,862
S&A Expense in 2011 was $6,693
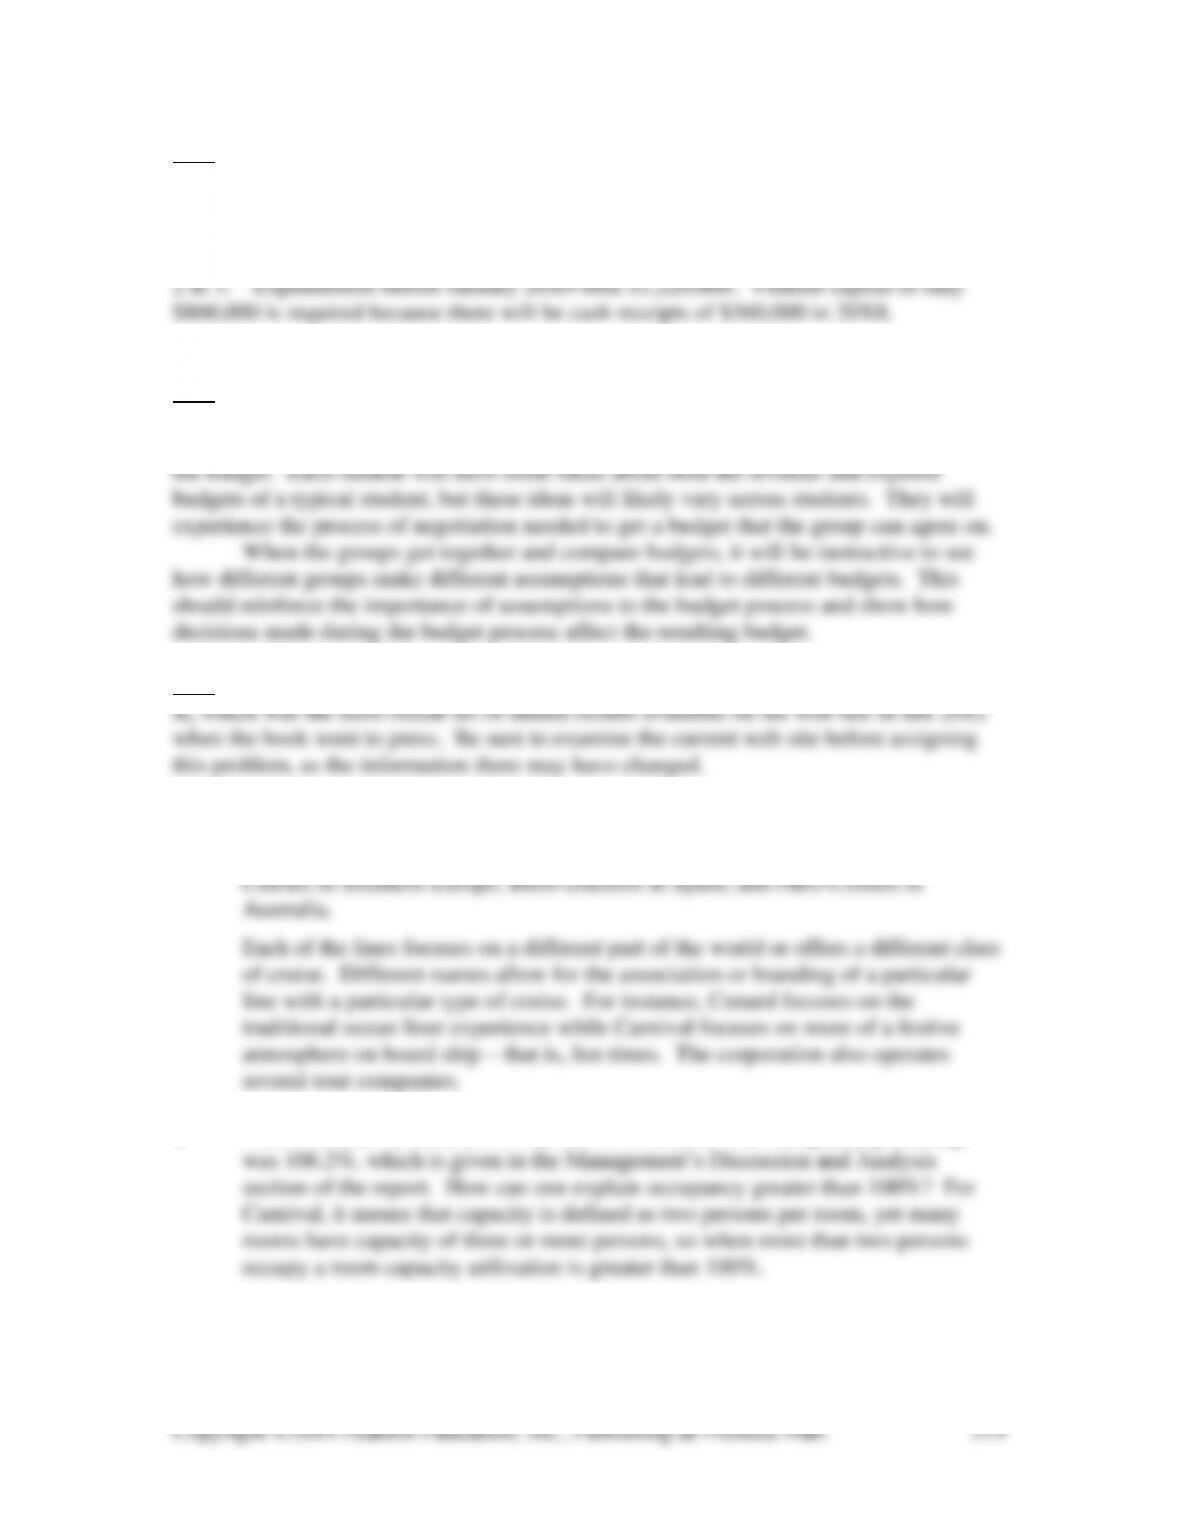
1. (a) (b)
10% revenue increase 10% revenue decrease
Revenue $22,948 $18,776
2. (a) (b)
10% revenue increase 10% revenue decrease
Revenue $22,948 $18,776
3. (a) (b)
Gross Margin Gross Margin
46% 44%
7-47 For the solution to this Excel Application Exercise, follow the step-by-step
instructions provided in the textbook chapter.
1. The first month that cash receipts exceed cash expenditures in January 20X9.
7-48 (30-60 min.)
The purpose of this exercise is to prepare a budget for an organization (an
individual student) that is familiar to all students and to see the effect of assumptions on
7-49 (30-45 min.) NOTE TO INSTRUCTOR. This solution is based on the 2011 10-
1. There are 10 brand lines under the corporation shell. They are Carnival Cruise
Lines, Holland America Line, Princess Cruises and Seabourn in North America;
P&O Cruises and Cunard Line in the United Kingdom; AIDA in Germany; Costa
2. Total revenues in fiscal 2011 were $15.793 billion. The occupancy percentage
3. According to the Executive Overview, passenger capacity will increase by 3.4%
1.034 × $15,793 million = $16,330 million
With added revenue from additional capacity there would be added costs.
4. The prices for cruises of the same length to the same location are not all the same.
They differ according to when the cruise dates are – high season or low season –
and also according to the level of capacity utilization that the particular cruise has
achieved. The firm’s goal is to have the maximum capacity utilization possible