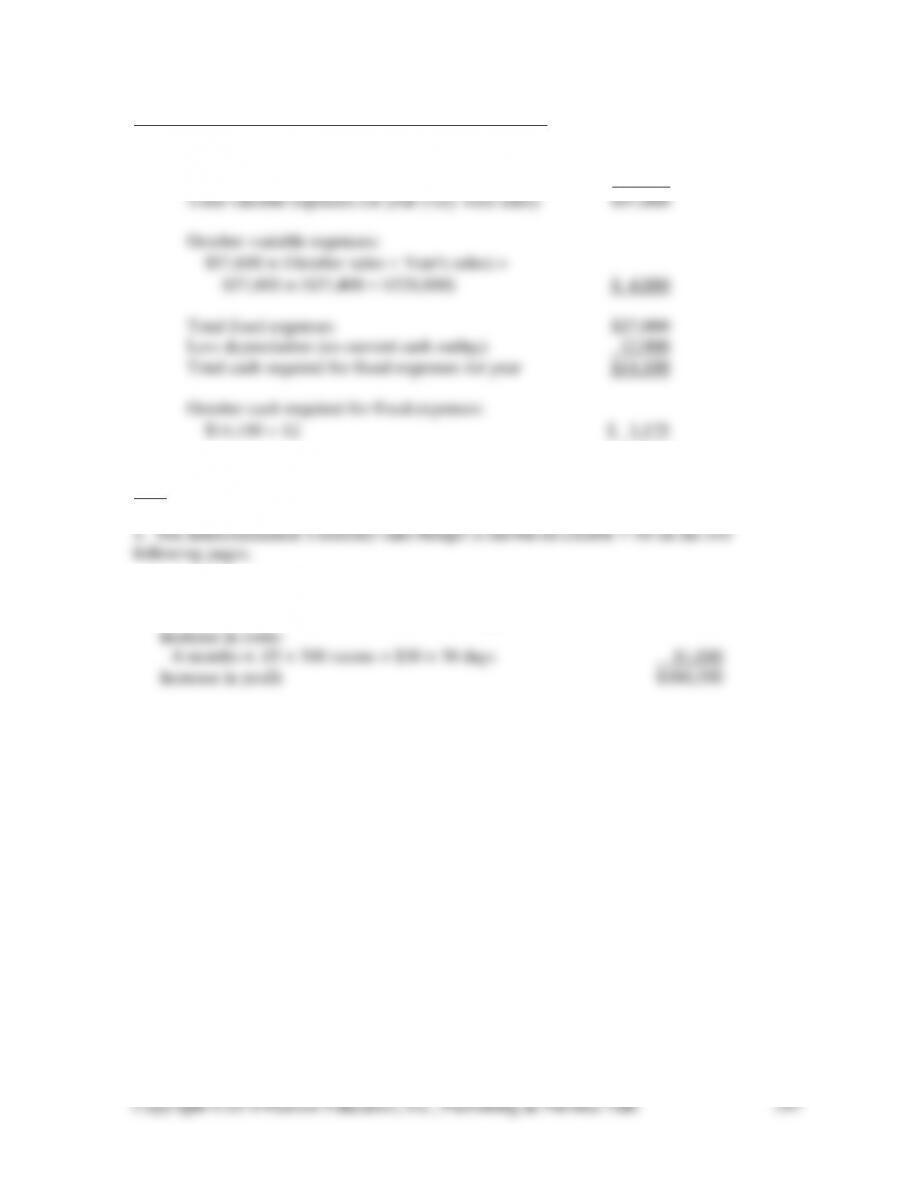
Schedule 3, Selling and General Administrative Expenses:
Total selling and general administrative expenses $84,600
Less fixed expenses 27,000
7-38 (30 – 40 min.) This problem is solved most easily on a spreadsheet.
2. Increase in revenues:
6 months × .05 × 300 rooms × $250 × 30 days × .98 collected $661,500
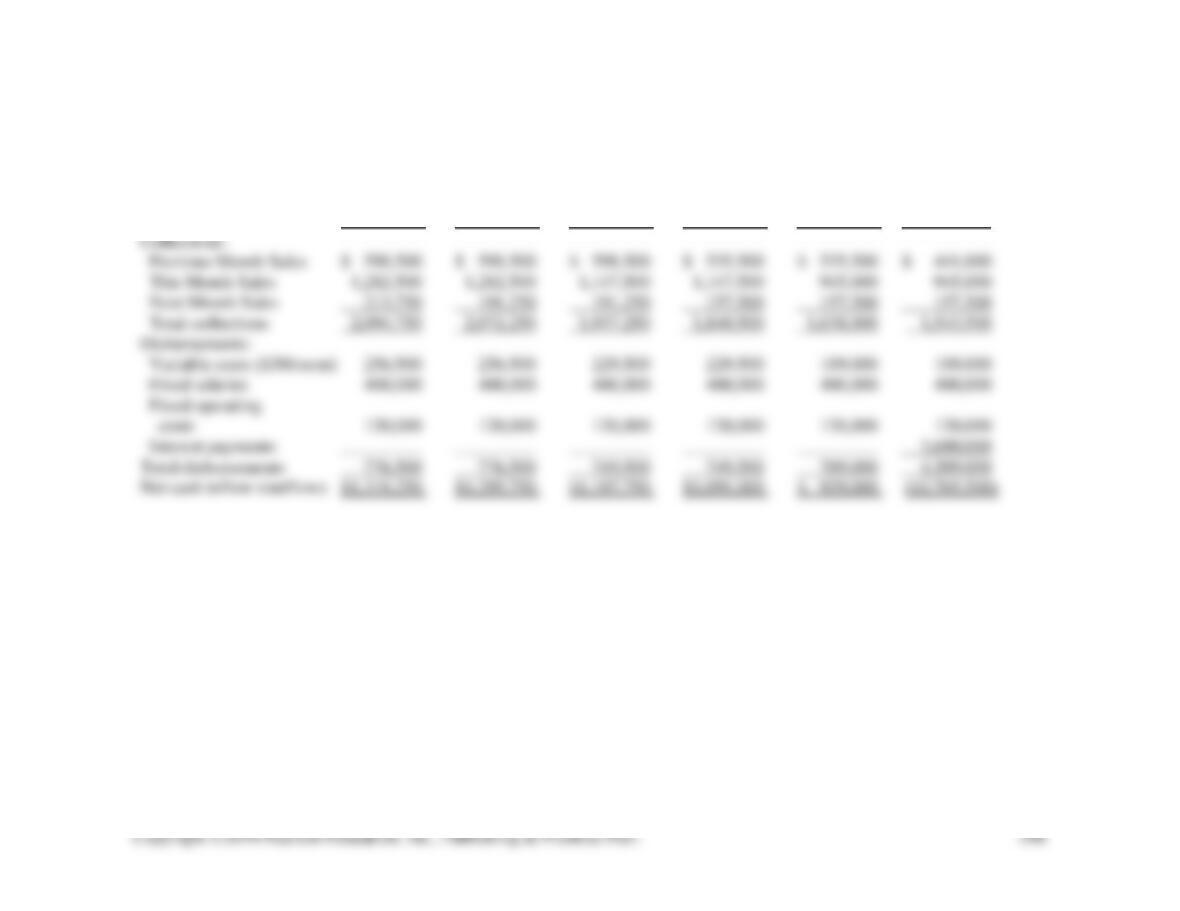
EXHIBIT 7-38
INTERCONTINENTAL
Monthly Cash Budget
January February March April May June
Revenues $2,137,500 $2,137,500 $1,912,500 $1,912,500 $1,575,000 $ 1,575,000
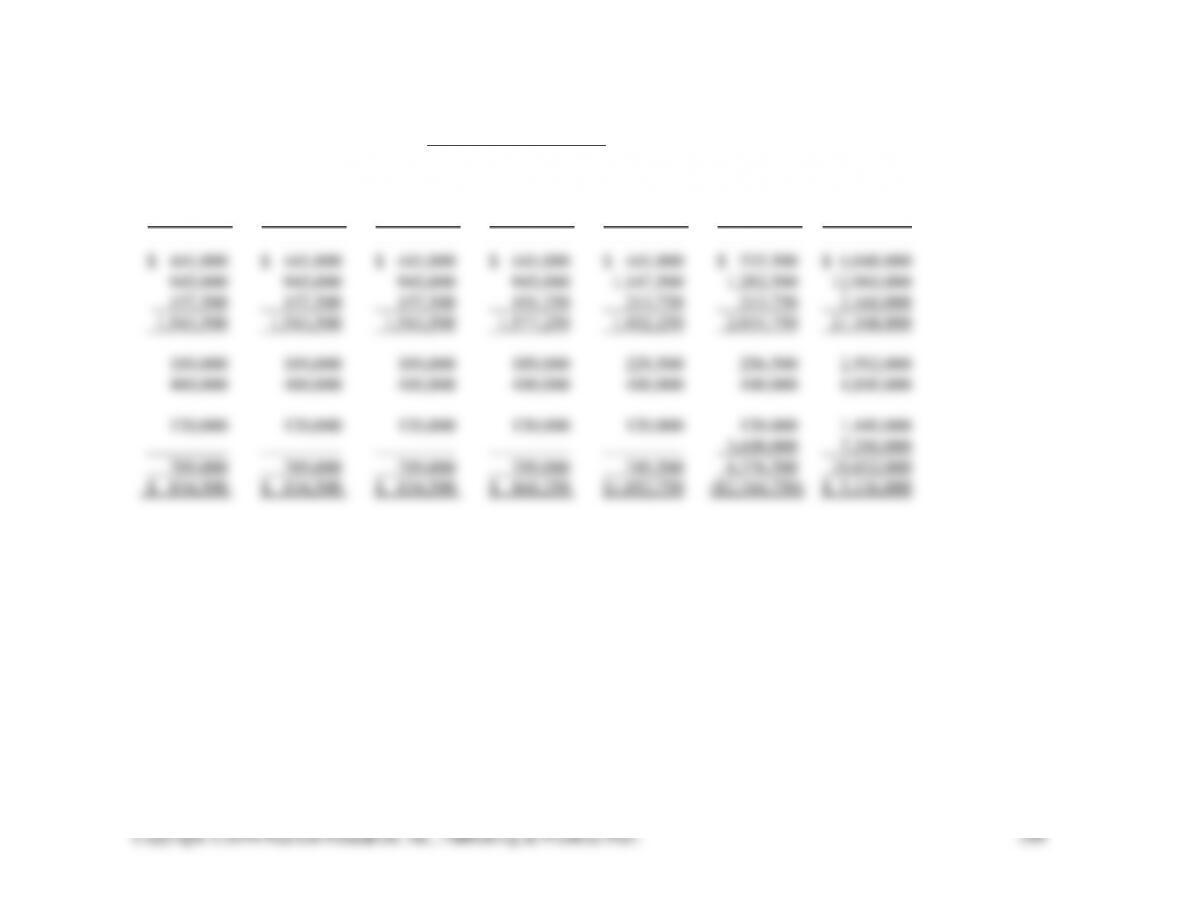
EXHIBIT 7-38 (Continued)
INTERCONTINENTAL
Monthly Cash Budget
July August September October November December Total
$1,575,000 $1,575,000 $1,575,000 $1,575,000 $1,912,500 $2,137,500 $21,600,000
7-39 ( 15 min.)
1. Cost-saving actions would probably focus on one or more of the activities of the
Shipping and Receiving Department.
Starke might start with the non-value added activities, handling and record-
keeping. For example, the activity-based budget data suggest that the cost per
2. Regardless of what methods are selected to achieve cost savings, the activity-
7-40 (25-30 min.)
1. An optimistic preliminary budget might be as follows, assuming level sales
volume, a $.94 per pound price, and a 2% decrease in variable costs.
Sales, 1.6 million pounds @ $.94/pound $1,504,000
Variable costs (862,400)
2. Two major problems are the arbitrary setting of budget targets by top
Copyright ©2014 Pearson Education, Inc., Publishing as Prentice Hall.
301
draconian measures used when a budget is not met, even if the shortfall is small or
reasonable explanations for the shortfall are given.
3. Apparently the preliminary financial results are as follows:
Sales, 1.6 million pounds @ $.945/pound $1,512,000
Variable costs, .98 × $880,000 (862,400)
Fixed costs, primarily depreciation (450,000)
7-41 (50-90 min.) Amounts are in dollars.
1 and 2. See Exhibit 7-41A on the following two pages. This spreadsheet is
3. See Exhibit 7-41 B on the following pages.
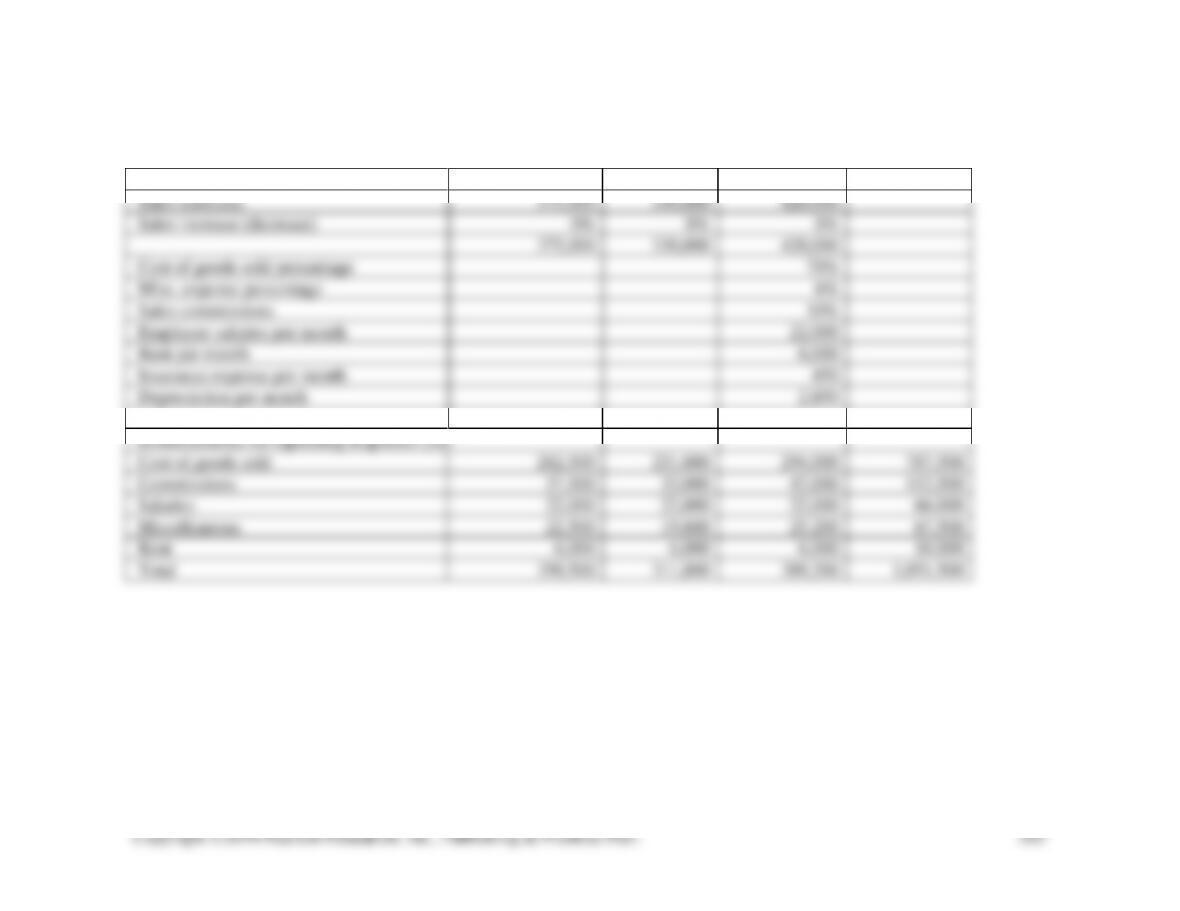
EXHIBIT 7-41A
SPEEDY-MART STORE, NORTHCENTER MALL
Spreadsheet for Profit Planning, Parts 1 & 2
Table of Budget Data
June
July
August
Sales forecasts
375,000
330,000
420,000
Sales increase (decrease)
0%
0%
0%
375,000
330,000
420,000
Cost of goods sold percentage
70%
Misc. expense percentage
6%
Sales commissions
10%
Employee salaries per month
22,000
Rent per month
6,000
Insurance expense per month
450
Depreciation per month
2,850
Disbursements for Operating Expenses (2a)
Cost of goods sold
262,500
231,000
294,000
787,500
Commissions
37,500
33,000
42,000
112,500
Salaries
22,000
22,000
22,000
66,000
Miscellaneous
22,500
19,800
25,200
67,500
Rent
6,000
6,000
6,000
18,000
Total
350,500
311,800
389,200
1,051,500
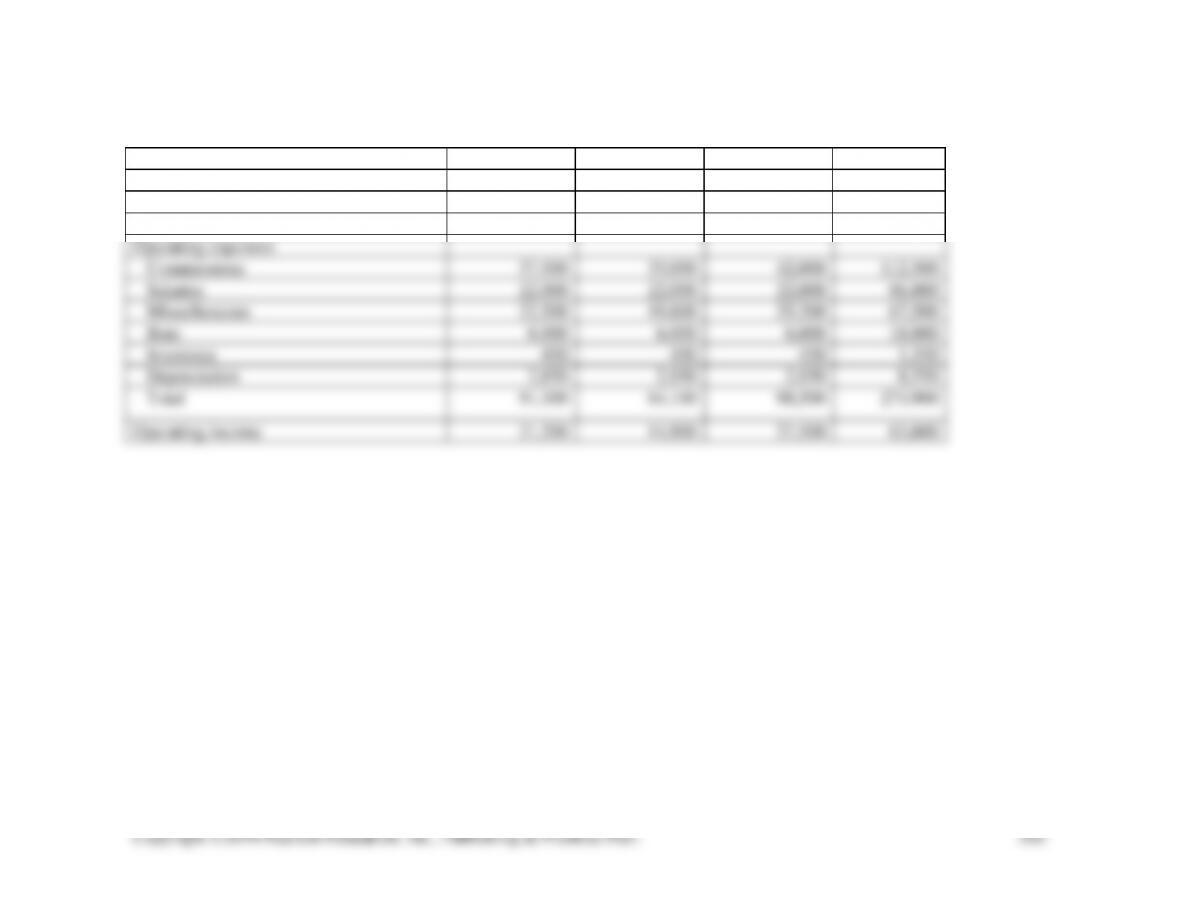
EXHIBIT 7-41A (Continued)
Operating Income (2b)
June
July
August
Total
Sales
375,000
330,000
420,000
1,125,000
Cost of goods sold
262,500
231,000
294,000
787,500
Gross margin
112,500
99,000
126,000
337,500
Operating expenses
Commissions
37,500
33,000
42,000
112,500
Salaries
22,000
22,000
22,000
66,000
Miscellaneous
22,500
19,800
25,200
67,500
Rent
6,000
6,000
6,000
18,000
Insurance
450
450
450
1,350
Depreciation
2,850
2,850
2,850
8,550
Total
91,300
84,100
98,500
273,900
Operating income
21,200
14,900
27,500
63,600
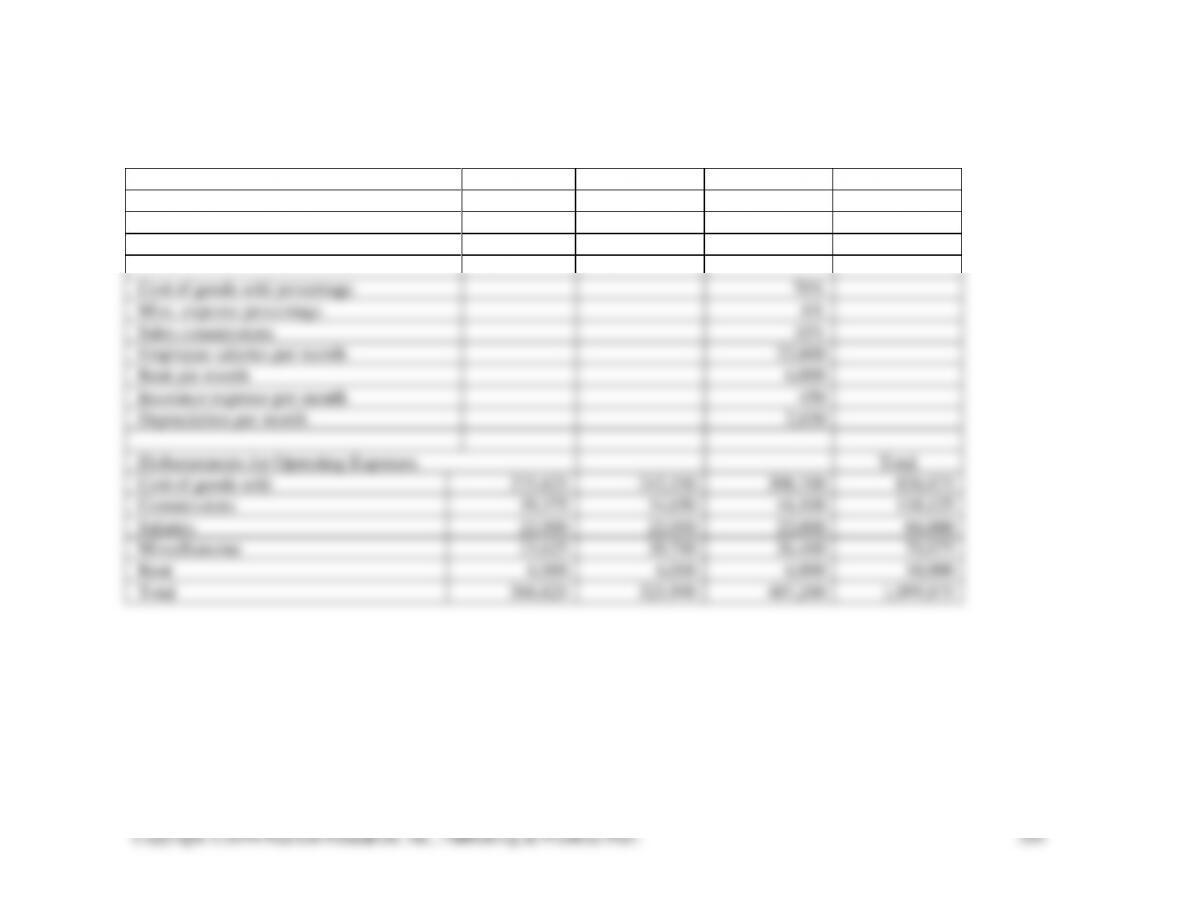
EXHIBIT 7-41B
SPEEDY-MART STORE, NORTHCENTER MALL
Spreadsheet for Sensitivity Analysis, Part 3a
Table of Budget Data
June
July
August
Sales forecasts
375,000
330,000
420,000
Sales increase (decrease)
5%
5%
5%
393,750
346,500
441,000
Cost of goods sold percentage
70%
Misc. expense percentage
6%
Sales commissions
10%
Employee salaries per month
22,000
Rent per month
6,000
Insurance expense per month
450
Depreciation per month
2,850
Disbursements for Operating Expenses
Total
Cost of goods sold
275,625
242,550
308,700
826,875
Commissions
39,375
34,650
44,100
118,125
Salaries
22,000
22,000
22,000
66,000
Miscellaneous
23,625
20,790
26,460
70,875
Rent
6,000
6,000
6,000
18,000
Total
366,625
325,990
407,260
1,099,875
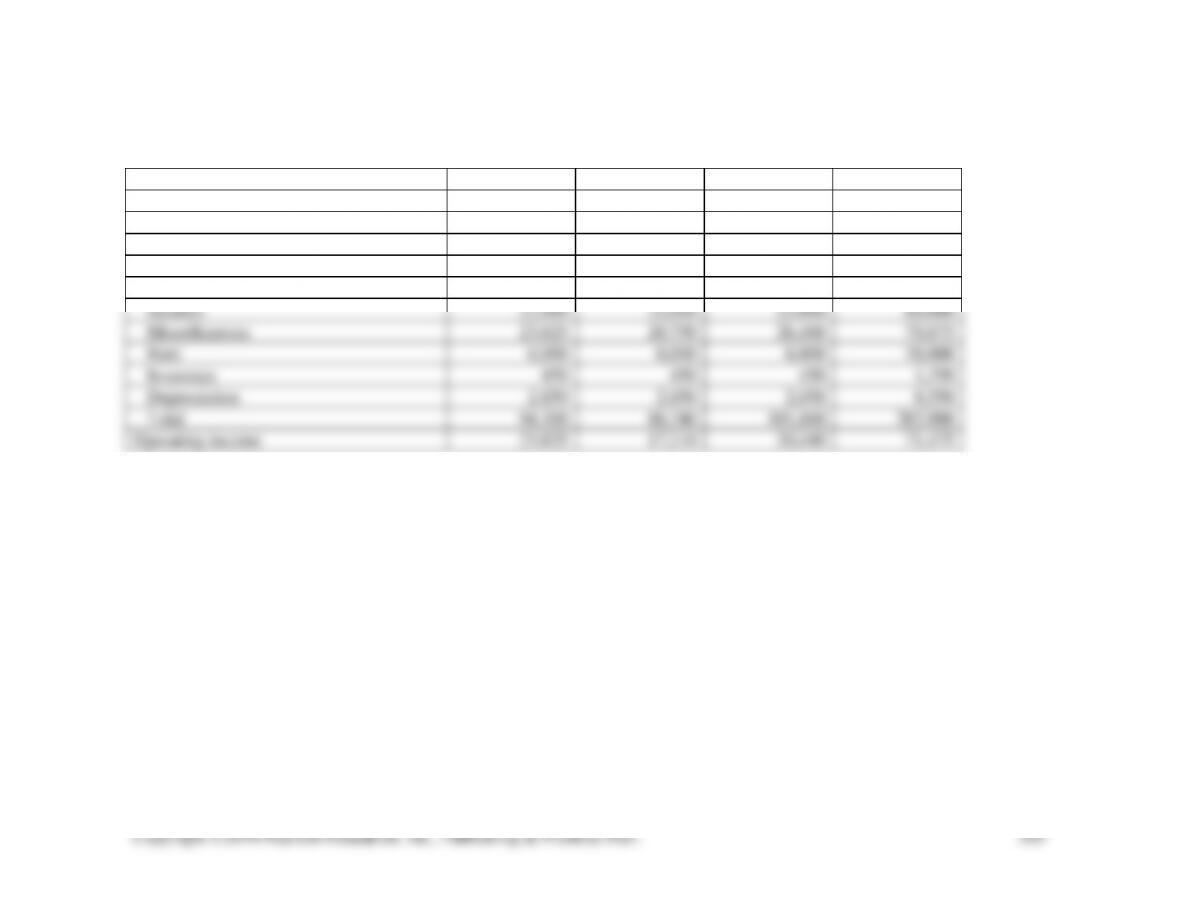
EXHIBIT 7-41B
Part 3a (Continued)
Operating Income
June
July
August
Total
Sales
393,750
346,500
441,000
1,181,250
Cost of goods sold
275,625
242,550
308,700
826,875
Gross margin
118,125
103,950
132,300
354,375
Operating expenses
Commissions
39,375
34,650
44,100
118,125
Salaries
22,000
22,000
22,000
66,000
Miscellaneous
23,625
20,790
26,460
70,875
Rent
6,000
6,000
6,000
18,000
Insurance
450
450
450
1,350
Depreciation
2,850
2,850
2,850
8,550
Total
94,300
86,740
101,860
282,900
Operating income
23,825
17,210
30,440
71,475
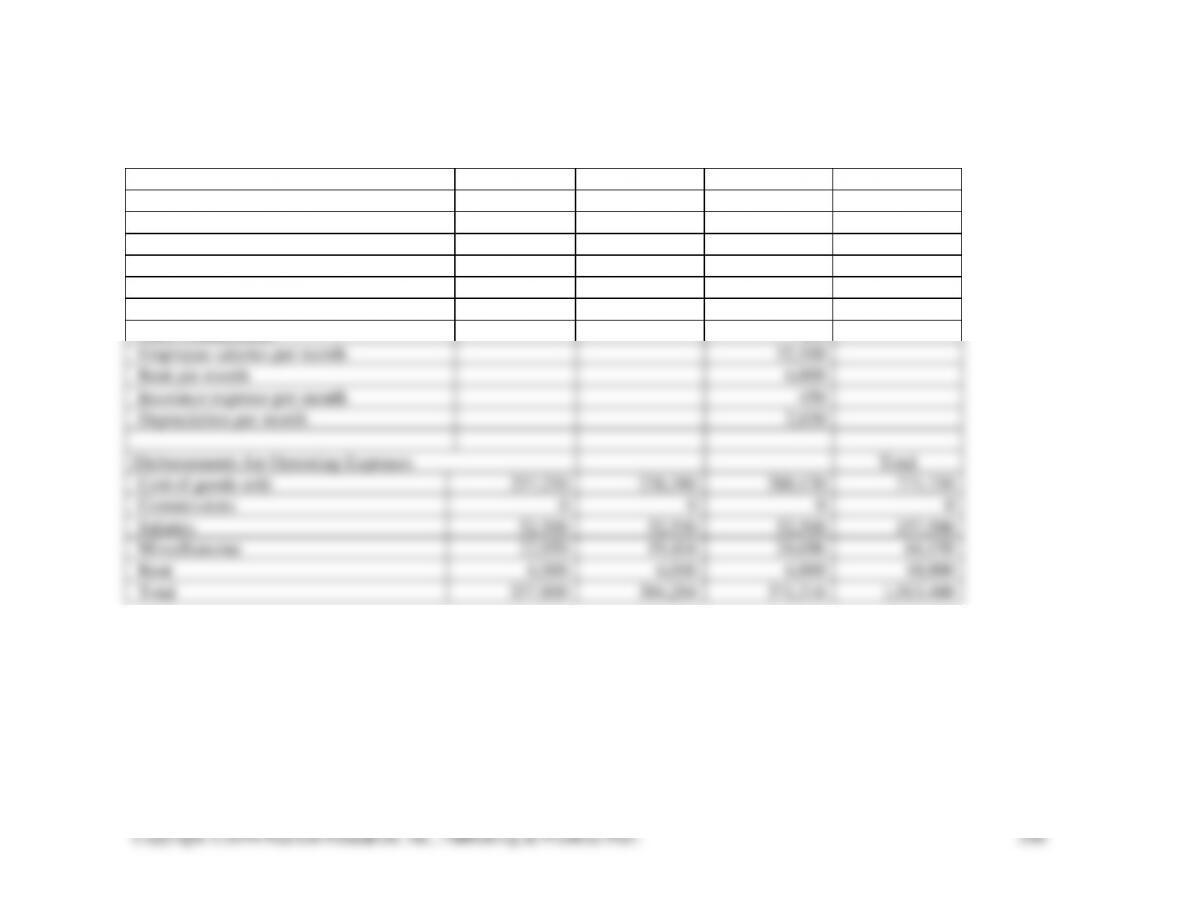
EXHIBIT 7-41B (Continued)
Part 3b
Table of Budget Data
June
July
August
Sales forecasts
375,000
330,000
420,000
Sales increase (decrease)
-2%
-2%
-2%
367,500
323,400
411,600
Cost of goods sold percentage
70%
Misc. expense percentage
6%
Sales commissions
0%
Employee salaries per month
52,500
Rent per month
6,000
Insurance expense per month
450
Depreciation per month
2,850
Disbursements for Operating Expenses
Total
Cost of goods sold
257,250
226,380
288,120
771,750
Commissions
0
0
0
0
Salaries
52,500
52,500
52,500
157,500
Miscellaneous
22,050
19,404
24,696
66,150
Rent
6,000
6,000
6,000
18,000
Total
337,800
304,284
371,316
1,013,400
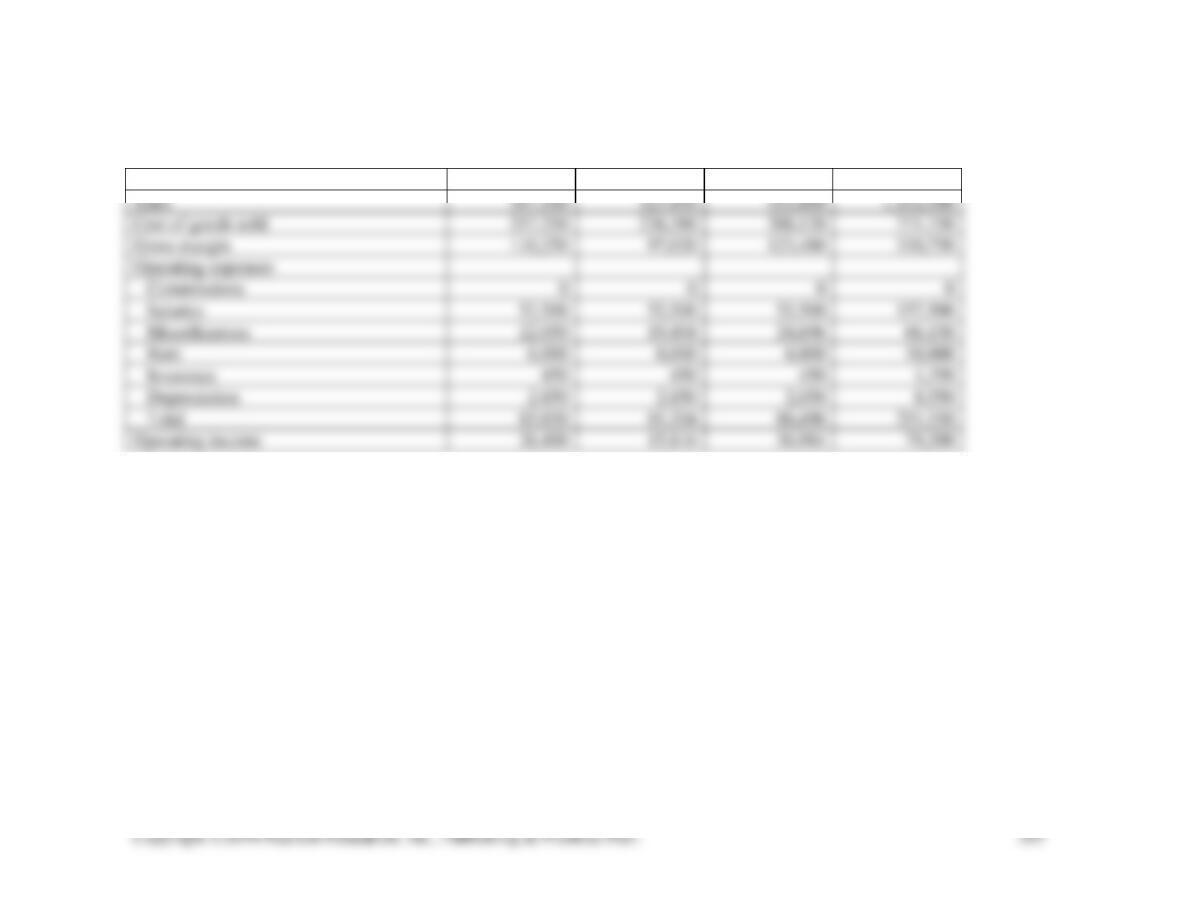
EXHIBIT 7-41B
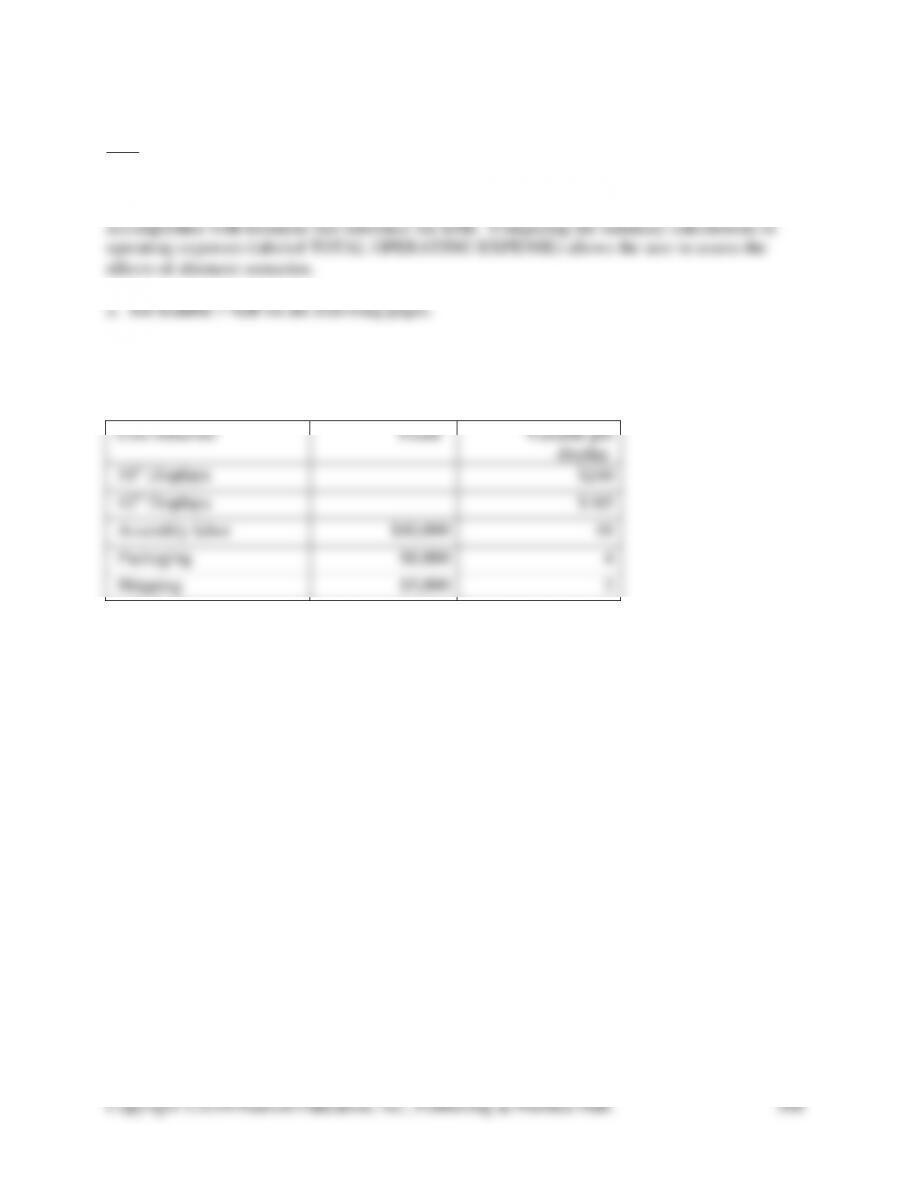
Part 3b (Continued)
Operating Income
June
July
August
Total
Sales
367,500
323,400
411,600
1,102,500
Cost of goods sold
257,250
226,380
288,120
771,750
Gross margin
110,250
97,020
123,480
330,750
Operating expenses
Commissions
0
0
0
0
Salaries
52,500
52,500
52,500
157,500
Miscellaneous
22,050
19,404
24,696
66,150
Rent
6,000
6,000
6,000
18,000
Insurance
450
450
450
1,350
Depreciation
2,850
2,850
2,850
8,550
Total
83,850
81,204
86,496
251,550
Operating income
26,400
15,816
36,984
79,200
7-42 (50-90 min.)
1. See Exhibit 7-42A on the following two pages. The spreadsheet below contains data from the
problem in the top of the spreadsheet space. Computations of operating expenses are
3. See Exhibit 7-74C on the following pages.
Spreadsheet for Operating Expense Budget
Cost behavior
Fixed
Variable per
display
50” Displays
$240
42” Displays
$165
Assembly labor
$40,000
48
Packaging
$8,000
4
Shipping
$5,000
2