2-59 (15-25 min.)
1. Let N = number of hamburgers per month
2. Multiply the answers in (1) by $1.25
3. Hamburgers per month, 3,800 ÷ 2 1,900
Revenue per month, 1,900 × $1.25 $2,375
4. Contribution margin on extra beers:
Per day, 75 × $.72 = $54
5. Operating loss on hamburgers $(756)
Desired contribution margin on extra beers 756
Overall effect on operating income $ 0
2-60 (15-20 min.) Note in requirements 2 and 3 how the percentage declines exceed
the 15% budget reduction.
1. Let N = number of persons
Revenue – variable expenses – fixed expenses = 0
2. Revenue is now; .85($900,000)= $765,000
$765,000 – $5,000N – $280,000 = 0
3. Let y = supplement per person
$765,000 – 124y – $280,000 = 0
124y = $765,000 – $280,000
2-61 (15-20 min.) Answers are in millions.
1. Sales $6,022
Variable costs:
Variable costs of goods sold $3,735
Variable other operating expenses 487 4,222
2. Predicted sales increase = $6,022 × .10 = $602.20
Additional contribution margin = $602.20 × .299 = $180
3. Assumptions include:
• Expenses can be classified into variable and fixed categories that completely
2-62 (20-30 min.)
1. Let N = volume level in boxes that would earn same profit
2. As volume increases, the more expensive models would generate more profits.
Compare the deluxe and jumbo models:
Let N = volume level in boxes that would earn same profit
$20,200 + $.28N = $11,200 + .37N
3. No, management cannot use theater capacity or average boxes sold because the
number of seats per theater does not indicate the number of patrons attending nor
2-63 (10-15 min.)
1. Kellogg’s has the higher fixed cost, while Post has the higher variable cost. Thus, the
2. Post provides more inventive to its sales force to increase sales. For each $1 of
3. A possible negative of the increased inventive for the Post sales force to increase sales
is a motivation to increase those short-term sales at any cost. That is, the Post sales force
2-64 (20-25 min.)
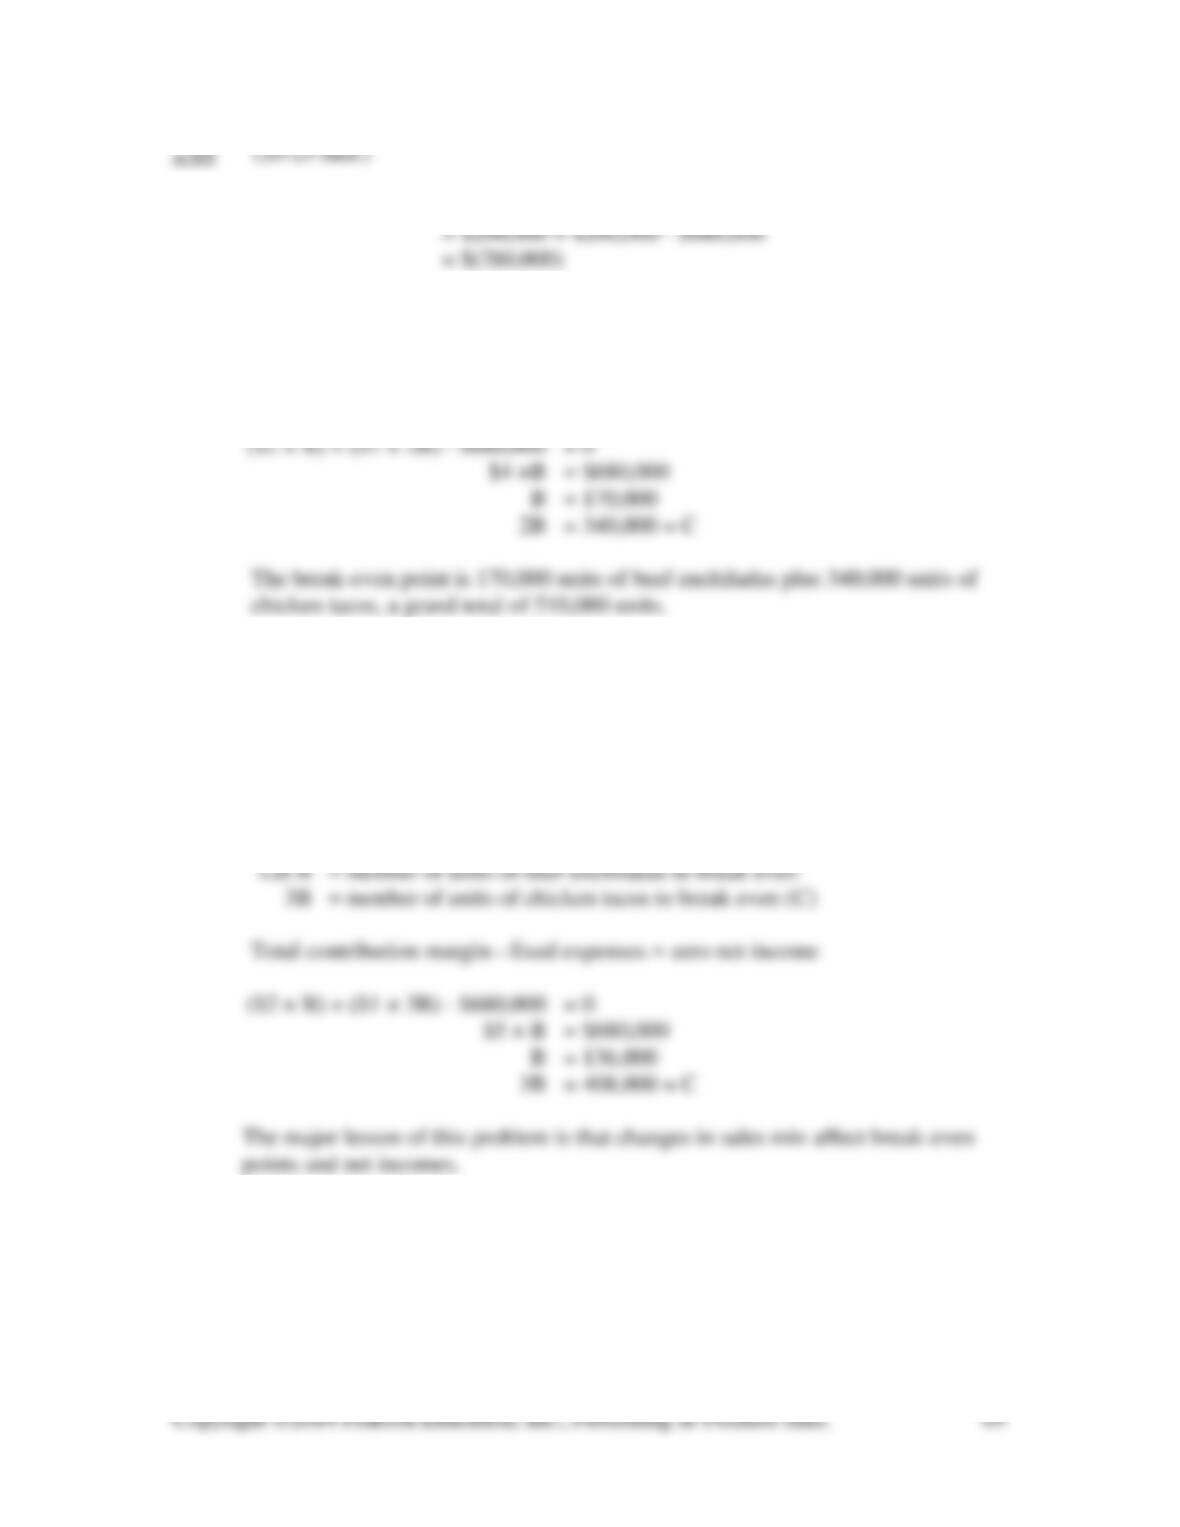
1. Net income (loss) = (200,000 × $1) + (100,000 × $2) – $680,000
2. Let B = number of units of beef enchiladas to break even
2B = number of units of chicken tacos to break even (C)
Total contribution margin – fixed expenses = zero net income
3. If tacos, break-even would be $680,000 ÷ $1 = 680,000 units.
If enchiladas, break-even would be $680,000 ÷ $2 = 340,000 units.
4. Net income (loss) = (225,000 × $1) + (75,000 × $2) – $680,000
= $225,000 + $150,000 – $680,000
= $(305,000)
2-65 (20-25 min.)
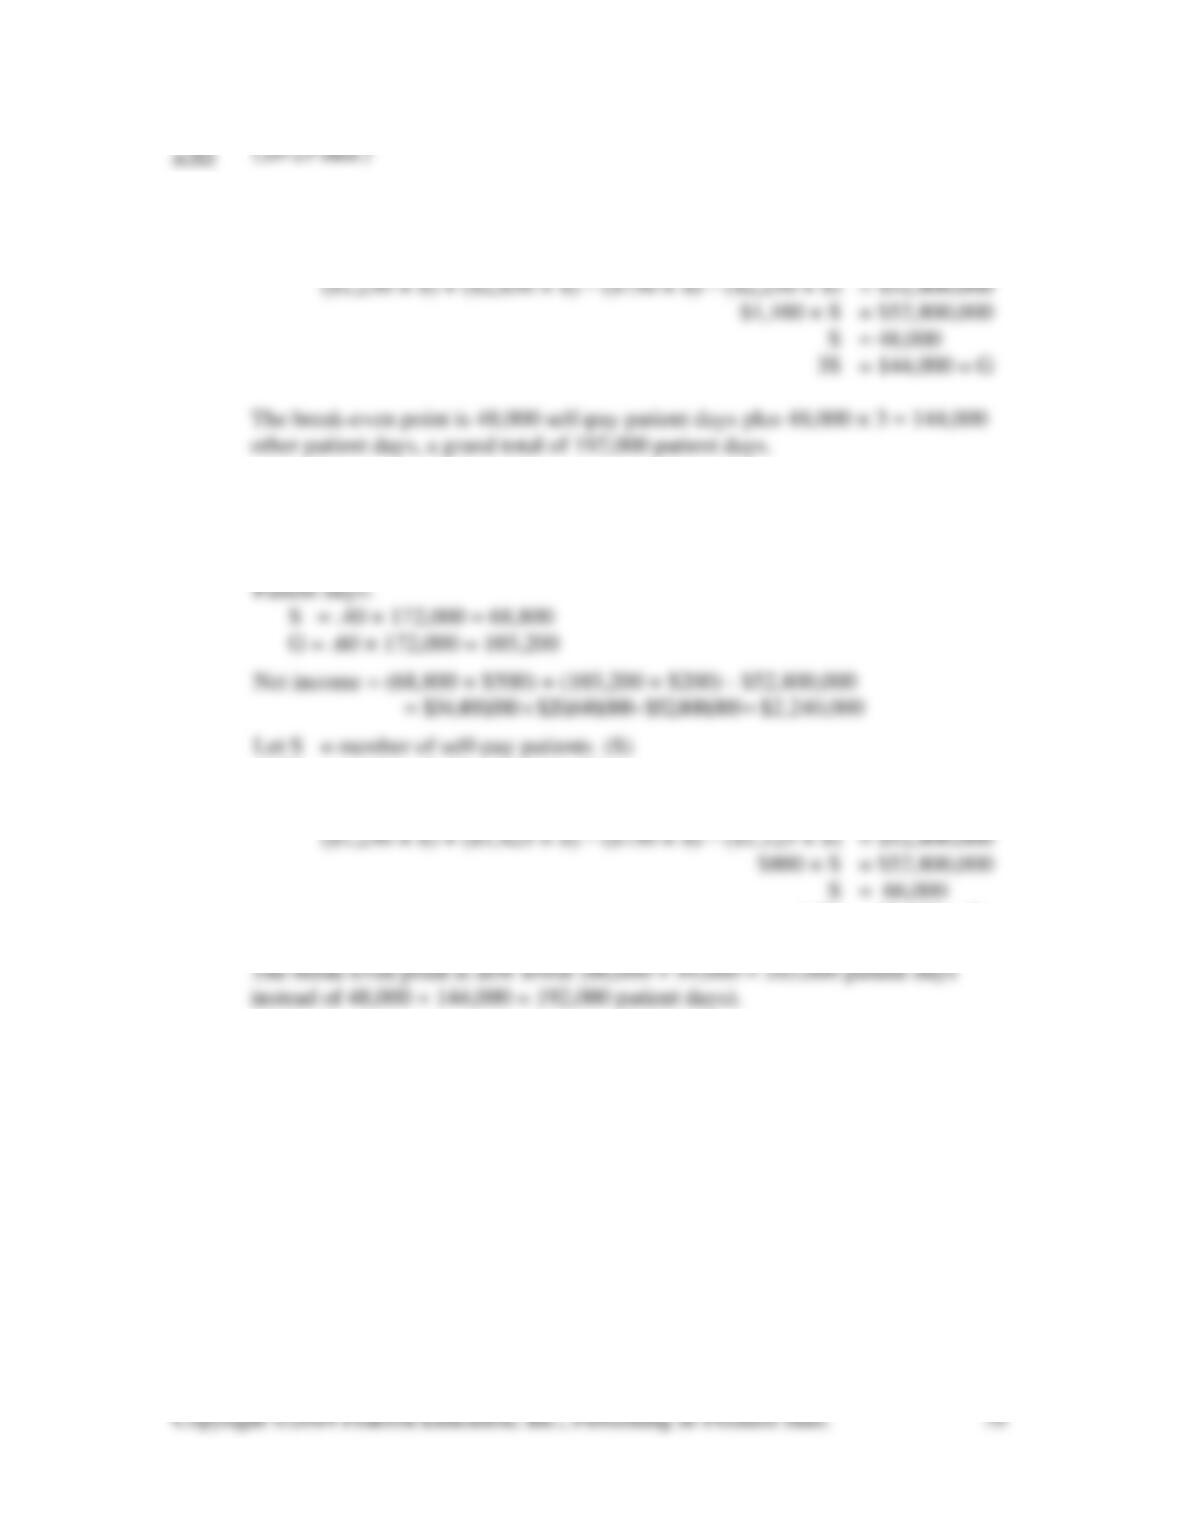
1. Let S = number of self-pay patients (S)
3S = number of other patients (G)
($1,250 × S) + ($950 × 3S) – ($750 × S) – ($750 × 3S) – $52,800,000 = 0
2. Contribution margins:
S = $1,250 – $750 = $500 per patient day
G = $950 – $750 = $200 per patient day
1.5S = number of other patients (G)
($1,250 × S) + ($950 ×1.5S) – ($750 × S) – ($750 ×1.5S) – $52,800,000 = 0
1.5S = 99,000 = G
2-66 (15-25 min.)
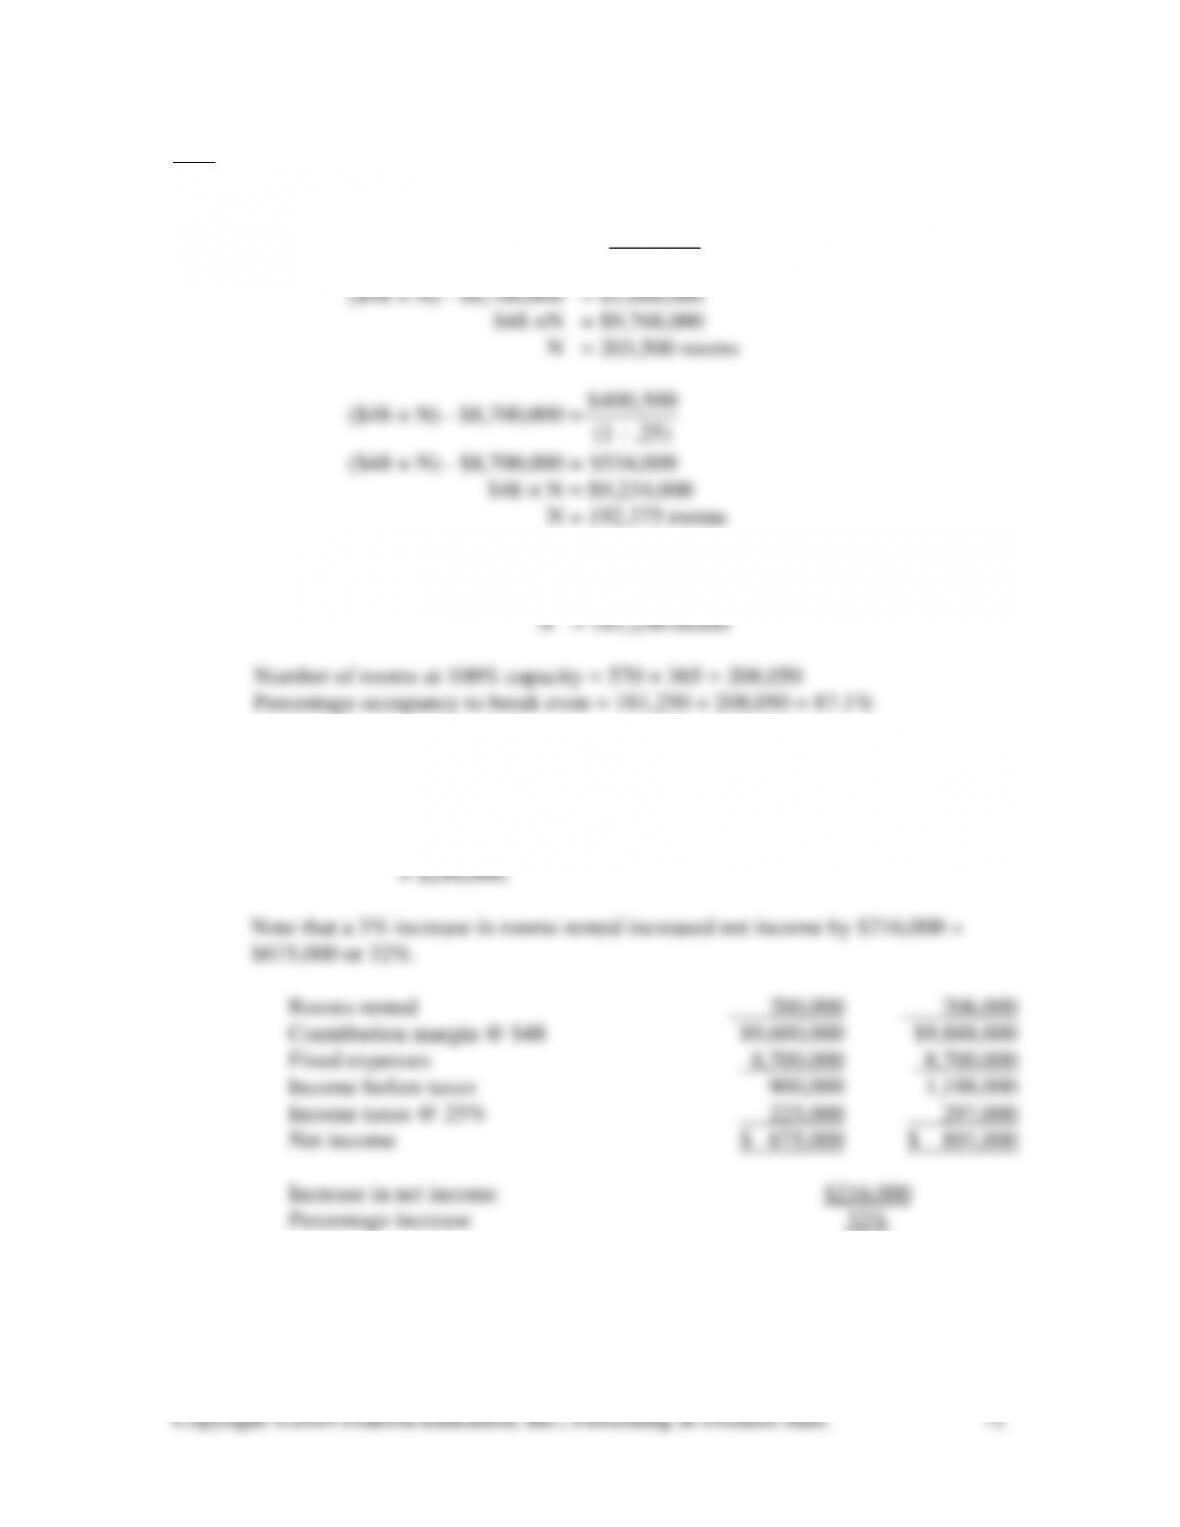
1. Let N = number of rooms
($90 × N) – ($42 × N) – $8,700,000 =
$801,000
(1 – .25)
$400,500
(1 – .25)
($48 × N) – $8,700,000 = $534,000
$48 × N = $9,234,000
N = 192,375 rooms
2. ($90 × N) – ($42 × N) – $8,700,000 = 0
$48 × N = $8,700,000
3. Using the shortcut approach described in the chapter appendix:
Change in net income = Change in vol. in units × Cont. margin/unit × (1 – tax rate)
= 6,000 × $48 × (1 – .25)
= 6,000 × $36
2-67 (15-25 min.)
$15– ($8 + $4)
2. Contribution margin: $15 – ($8 + $4) = $3
Increased after-tax income after 15% increase in volume:
3. Let N = target sales in units
25% increase in unit purchase price will increase purchase price to $10 (from previous
value of $8) so variable costs per unit will be $10 + $4 = $14.
4. Let P = new selling price
Current contribution ratio is $3 ÷ $15 = .20
2-68 (25-35 min.)
2. Variable costs = $3,300,000 ÷ 15,000 = $220 per patient-day
3. The fixed cost levels differ as the relevant range changes:
Non–Nursing Nursing Total
Patient–Days Fixed Expenses Fixed Expenses Fixed Expenses
4. The nursing costs would have been variable instead of fixed. The contribution
margin per patient-day would have been $810 – $220 – $200 = $390. The break-
2-69 (15-20 min.)
1. Old: (Contribution margin × 600,000) – $580,000 = Budgeted profit
3. A fall in volume will be more devastating under the new system because the high
fixed costs will not be affected by the fall in volume:
4. Increases in volume create larger increases in profit in the new environment:
Old: ($1.00 × 700,000) – $580,000 = $120,000
5. Changes in volume affect profits in the new environment (a high fixed cost, low
variable cost environment) more than they affect profits in the old environment.
2-70 (25-30 min.) This case is based on real data that has been simplified so that the
numbers are easier to handle.
1. Daily break-even volume is 85 dinners and 170 lunches:
First compute contribution margins on lunches and dinners:
Variable cost percentage = ($1,246,500 + $222,380) ÷ $2,098,400
= 70%
Contribution margin percentage = 1 – variable cost percentage
2. The extra annual contribution margin from the 3 dinners and 6 lunches is:
3 × $40 × .30 × 305 = $10,980
3. Let Y again be a combination of 1 dinner and 2 lunches, priced at $80. Variable
$26.80. (This could also be determined by adding the $2.80 saving in food cost
directly to the old contribution margin of $24.) The required annual volume in Y
needed to keep operating income at $7,080 is:
$26.80 (Y) – $622,440 = $7,080
2-71 (25-30 min.)
1. Break-even in pounds = Annual fixed costs ÷ Contribution margin/pound
$3.00) – (5.00
$566,250
2. Contribution margin ratio = $2.00 ÷ $5.00 = 40%
Old variable cost = $3.00
Only the cost of salmon is affected:
3. Current income before taxes:
= 390,000 × ($5.00 – $3.00) – $566,250
= $780,000 – $566,250 = $213,750
Current income after taxes:
= $213,750 × .60 = $128,250
4. Strategies might include:
(a) Increase selling price by the $.375 cost increase.
2-72 (15-20 min.)
1. The following table shows the comparison between percentage changes in total
revenue and income before taxes for the six major regions of Nike.
Percent Change Percent Change
Region in Revenue in Pre-tax Income
2. There are many possible explanations. One possibility is that while revenues
increased, variable costs may have increased so that the overall contribution
3. Nike’s operating leverage is the ratio of its fixed costs to variable costs. A large
percentage of Nike’s costs is cost of goods sold, which is primarily a variable
follow:
1. Proposal A:
Break even in units: $110,000 ÷ ($99 – $55) = 2,500 units
Break even in dollars: 2,500 × $99 = $247,500
Break even in units: $110,000 ÷ ($129 – $55) = 1,486 units
Break even in dollars: 1,486 × $129 = $191,694
Proposal C:
Break even in units: $110,000 ÷ ($99 – $49) = 2,200 units
Break even in dollars: 2,200 × $99 = $217,800
2. The break-even points are much smaller because the contribution margin is larger
while the fixed costs are unchanged.
2-74 (30 min. or more)
The purpose of this problem is to develop an intuitive feel for the costs involved
in a simple production process and to assess whether various costs are fixed or variable.
2-75 (30-40 min.) NOTE TO INSTRUCTOR: This solution is based on the web site as
1. Answers to the questions depend on the student’s location and choices of dates.
Fares available include business select, anytime, and “wanna get away”. Different
fares are offered because of the different costs incurred by SWA to serve
2. It is likely that the fares one week in advance are higher than the fares one month
3. On a particular flight, price paid for a seat (assuming the same class seat) is not a
cost driver. The various costs incurred by SWA will change only slightly –
4. Operating revenues and operating expenses are reported for the current and prior
year along with the percentage change. The operating revenues increased from
$12.104 billion in 2010 to $15.658 billion in 2011, an increase of 29.4%.
5. To describe a particular cost as fixed or variable, we must identify the cost driver,
the time period involved, and the relevant range. In this case, assume that the
period is one year and the relevant range is the number of ASMs that can be
available without adding to or subtracting from the current fleet of airplanes.