CHAPTER 2
COVERAGE OF LEARNING OBJECTIVES
LEARNING OBJECTIVE
FUNDA–
MENTAL
ASSIGN–
MENT
MATERIAL
CRITICAL
THINKING
EXERCISES
AND
EXERCISES
PROBLEMS
CASES, NIKE
10K, EXCEL,
COLLAB., &
INTERNET
EXERCISES
LO1: Explain how cost
drivers affect cost behavior.
A1, B1
25, 26, 28, 30,
31
47,49, 51, 53,
56
68
LO2: Show how changes in
activity cost–driver levels
affect variable and fixed costs.
A1, B1, A2,
A3, B2, B3
25, 26, 29, 30,
31, 32, 41, 48
47,49, 52, 53,
54, 56, 59, 60,
63
68, 69, 73
LO3: Explain step- and
mixed-cost behavior.
A4,B4
24,36,37,38,
39
75
LO4: Create a cost–volume–
profit graph and understand
the assumptions behind it.
33, 34, 35,40,
49
LO5: Calculate break–even
sales volume in total dollars
and total units.
A2, A3, B2,
B3
40, 41,42, 43
47,50, 52, 54,
55, 57, 59, 61
68, 69, 73, 74
LO6: Calculate sales volume
in total dollars and total units
to reach a target profit.
A2 , B3
33, 34, 43, 62
47,50, 52, 54,
55, 57, 59,
69
LO7: Differentiate between
contribution margin and gross
margin.
61
LO8: Explain the effects of
sales mix on profits
(Appendix 2A).
44
64, 65
70
LO9: Compute cost–volume–
profit relationships on an after–
tax basis (Appendix 2B).
45, 46
66, 67
71
CHAPTER 2
Introduction to Cost Behavior and Cost-Volume Relationships
2-A1 (20-25 Min.)
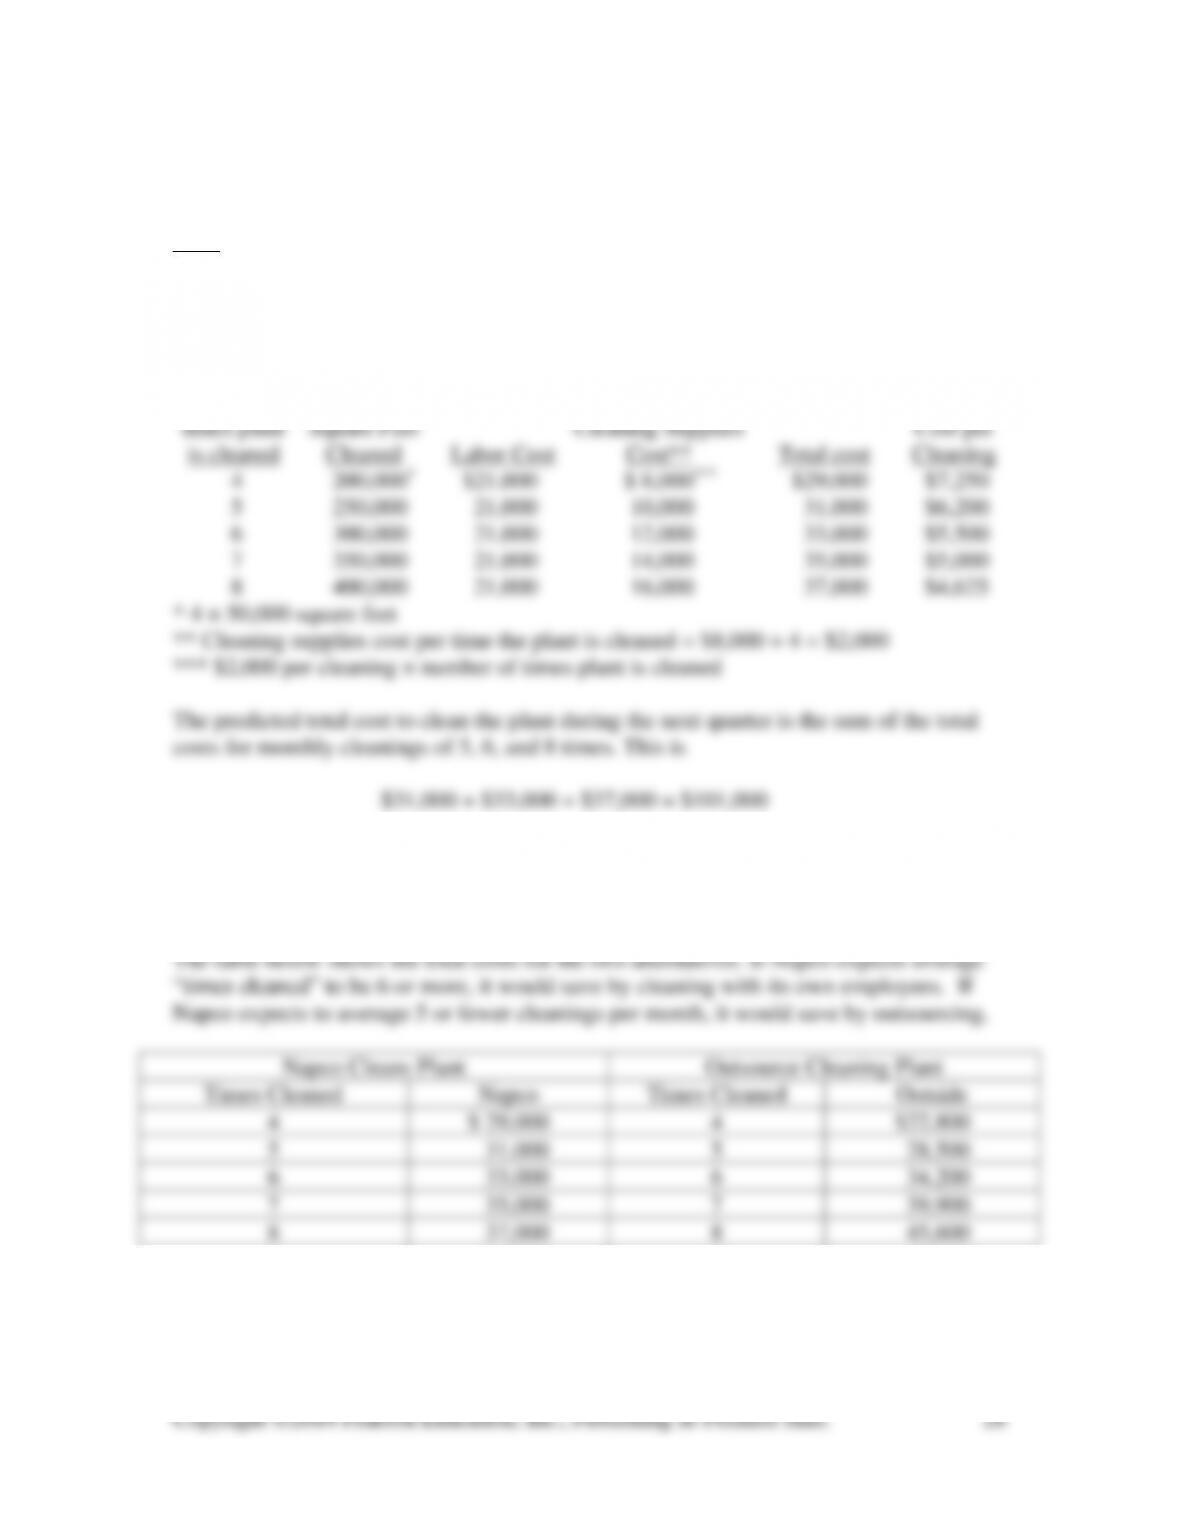
1. The cost driver for both resources is number of times the plant is cleaned. Labor cost
is a fixed-cost resource, and cleaning supplies is a variable cost. Costs for cleaning
between 4 and 8 times a month are:
Number of
2. If Napco hires the outside cleaning company, all its cleaning costs will be variable at a
rate of $5,700 per cleaning. The cost driver will be “number of times cleaned.” The
predicted cost to clean a total of 5 + 6 + 8 = 19 times is 19 × $5,700 = $108,300. Thus,
Napco will save by not hiring the outside cleaning company.
2–A2 (20–25 min.)
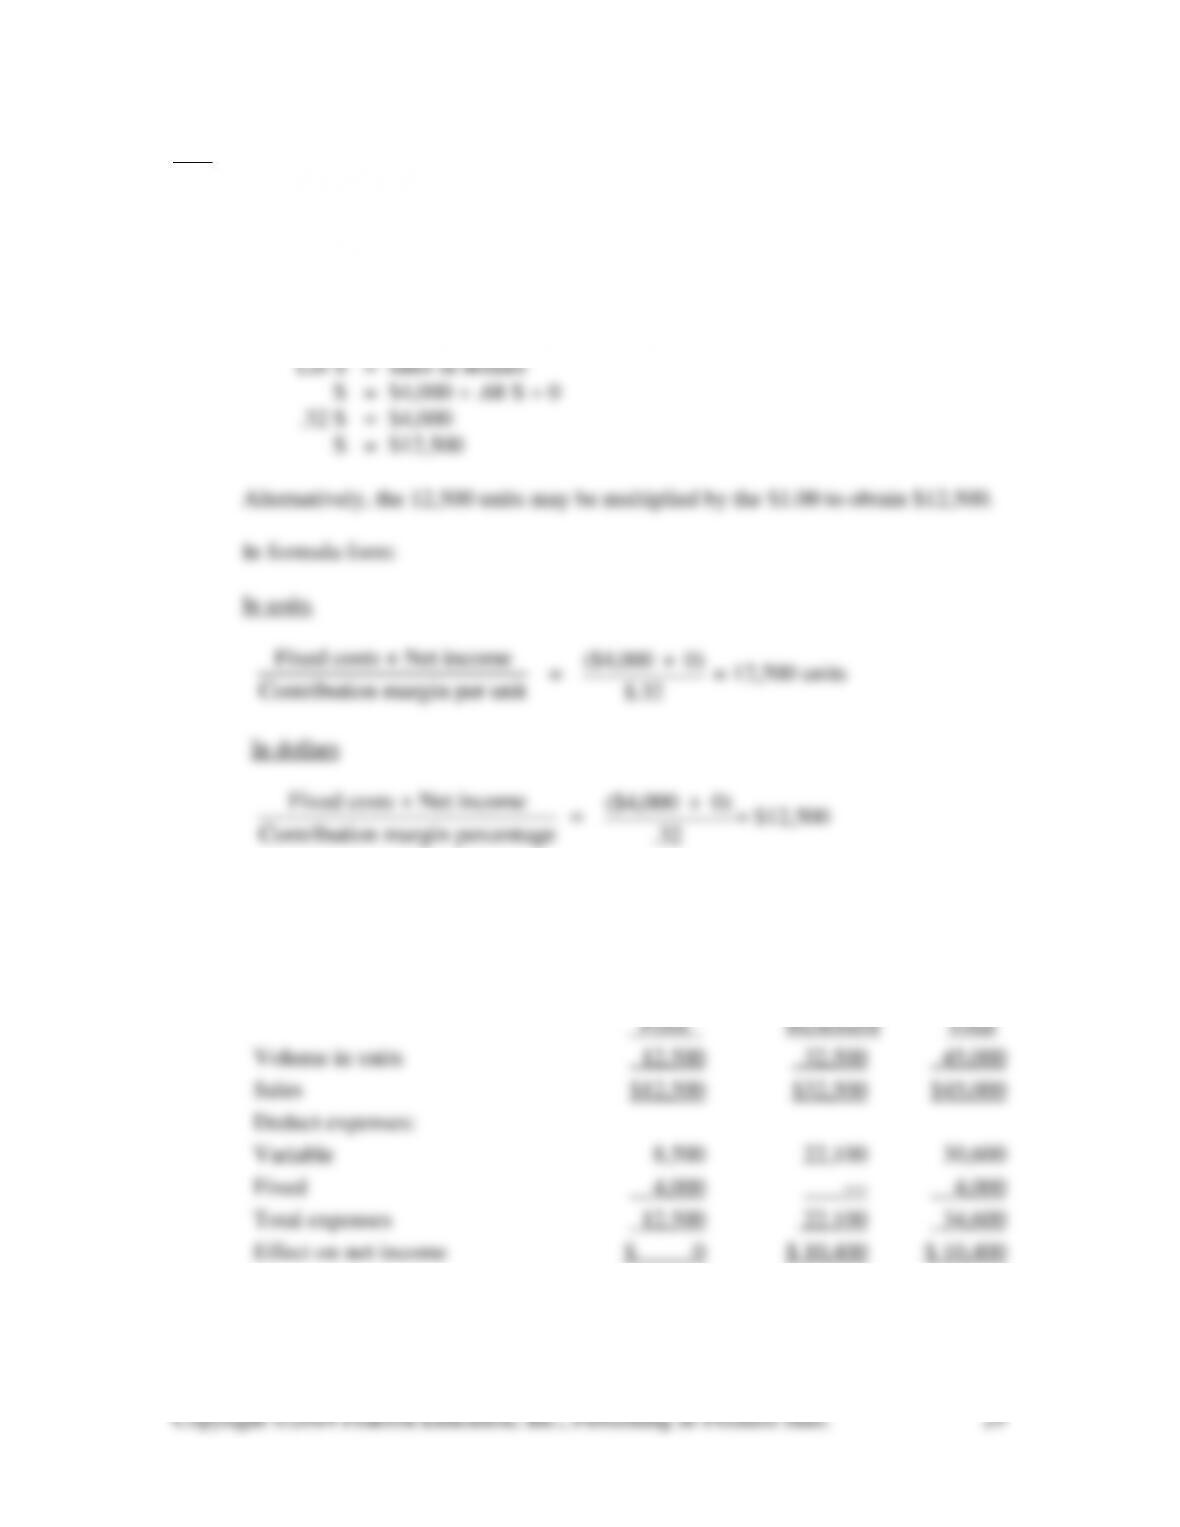
1. Let N = number of units
Sales = Fixed expenses + Variable expenses + Net income
$1.00 N = $4,000 + $.68 N + 0
$.32 N = $4,000
N = 12,500 units
Contribution margin percentage
.32
2. The quick way: (45,000 – 12,500) × $.32 = $10,400
Compare income statements:
Break-even
3. Total fixed expenses would be $4,000 + $1,600 = $5,600
$5,600
$.32/unit
$5,600
.32
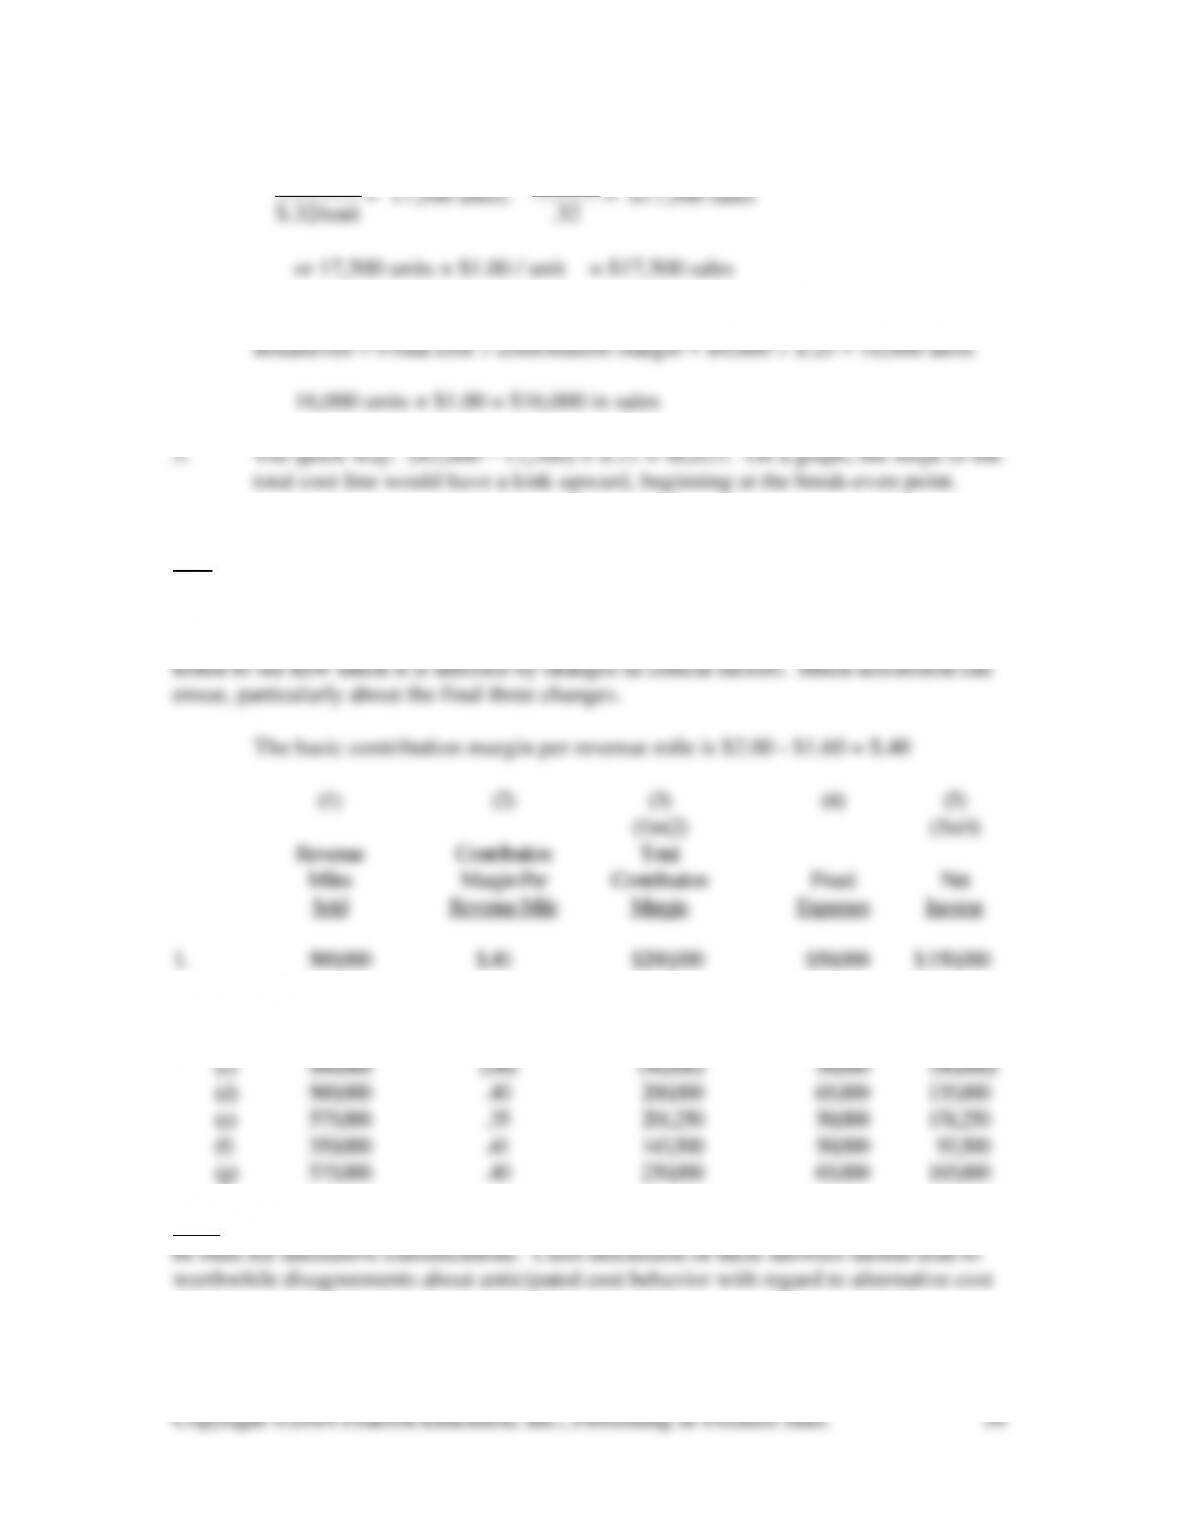
or 17,500 units × $1.00 / unit = $17,500 sales
4. New contribution margin is $1.00 – $.68 – $.07 = $.25 per unit
2–A3 (20–30 min.)
The following format is only one of many ways to present a solution. This
situation is really a demonstration of “sensitivity analysis,” whereby a basic solution is
2. (a) 500,000 1.00 500,000 50,000 450,000
(b) 650,000 .40 260,000 50,000 210,000
2-A4 (20-25 min.) Some of these answers are controversial, and reasonable cases can
drivers.
1. (b) Fixed cost.
2. (d) Step cost.
3. (a) Variable cost with respect to revenue.
5. (c) Mixed cost with respect to miles driven.
7. (b) Fixed cost.
9. (a) Variable cost with respect to cases of 7-Up.
11. (b) Fixed cost.
2-B1 (20-25 Min.)
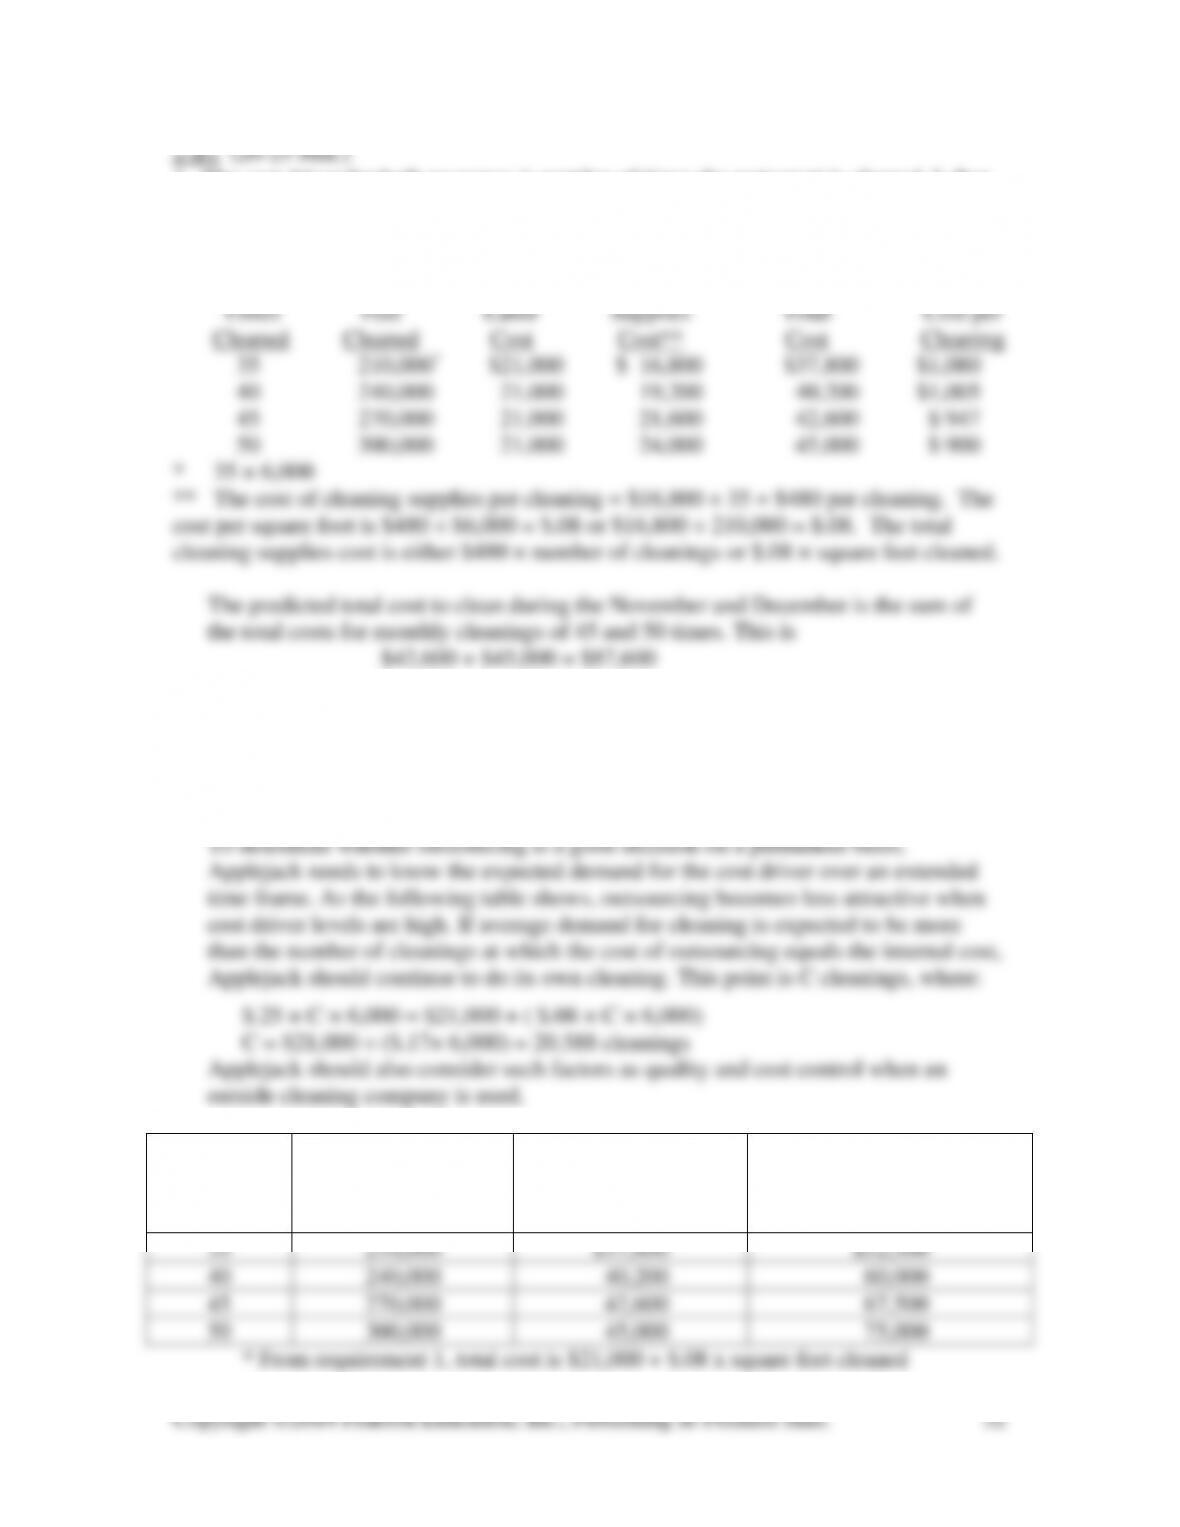
1. The cost driver for both resources is number of times the restaurant is cleaned. Labor
cost is a fixed-cost resource, and cleaning supplies is a variable cost. Costs for
cleaning between 35 and 50 times are:
Square Cleaning
2. If Applejack hires the outside cleaning company, all its cleaning costs will be variable
at a rate of $0.25 per square foot cleaned. The predicted cost to clean a total of 45 +
50 = 95 times is 95 × 6,000 × $0.25 = $142,500. Thus, Applejack will not save by
hiring the outside cleaning company.
(1) Times
Cleaned
(2) Square Feet
Cleaned
(3) Applejack
Total Cleaning Cost*
Outside Cleaning Cost
$.25 × (2)
35
210,000
$37,800
$52,500
40
240,000
40,200
60,000
45
270,000
42,600
67,500
50
300,000
45,000
75,000
* From requirement 1, total cost is $21,000 + $.08 x square feet cleaned
2-B2 (15-25 min.)
1. $2,340 ÷ ($30 – $12) = 130 child-days
3. a. 198 × ($30 – $12) – $2,340 = $3,564 – $2,340 = $1,224
or (22 × $18) + $828 = $396 + $828 = $1,224
2-B3 (15-20 min.)
$9,100
=
$9,100
= 1,300 units
2. Contribution margin ratio:
($43,000 $30,100)
$43,000
−
= 30%
3.
($29 –$13)
$16
5. New contribution margin: $48 – ($36 – 25% of $36)
= $48 – ($36 – $9) = $21;
$21
$21
2-B4 (20-25 min.)
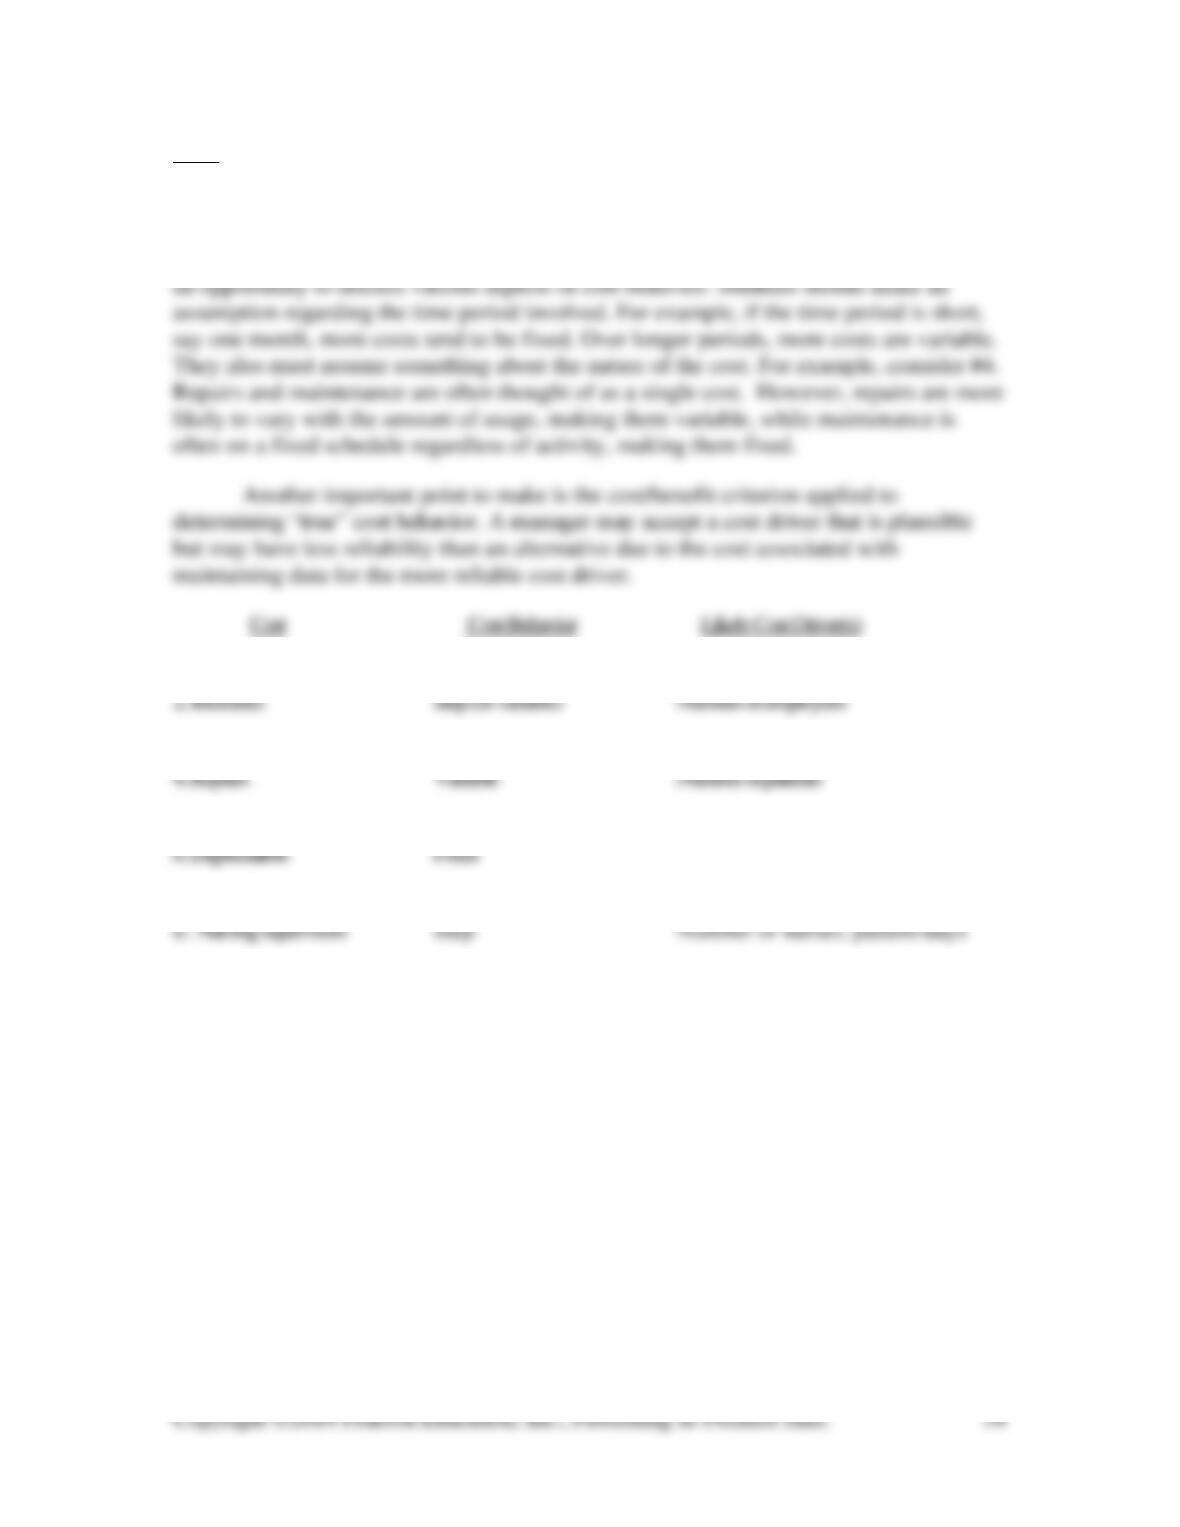
The following classifications are open to debate. With appropriate assumptions,
other answers could be equally supportable. For example, in #2, the health insurance
would be a fixed cost if the number of employees will not change. This problem provides
1. X–ray operating cost Mixed Number of x–rays
3. Cancer research Fixed
5. Training cost Fixed
7. Consulting Fixed
2-1 This is a good characterization of cost behavior. Identifying cost drivers will
2-2 Two rules of thumb to use are:
a. Total fixed costs remain unchanged regardless of changes in cost-driver
2-3 Examples of variable costs are the costs of merchandise, materials, parts, supplies,
2-4 Fixed costs, by definition, do not vary in total as volume changes within the
relevant range and during the time period specified (a month, year, etc.). However, when
the cost-driver level is outside the relevant range (either less than or greater than the
2-5 Yes. Fixed costs per unit change as the volume of activity changes. Therefore,
2-6 No. Cost behavior is much more complex than a simple dichotomy into fixed or
2-7 No. The relevant range pertains to both variable and fixed costs. Outside a
2-8 The major simplifying assumption is that we can classify costs as either variable
or fixed with respect to a single measure of the volume of output activity.
2-9 The same cost may be regarded as variable in one decision situation and fixed in a
second decision situation. For example, fuel costs are fixed with respect to the addition
2-10 No. Contribution margin is the excess of sales over all variable costs, not fixed
costs. It may be expressed as a total, as a ratio, as a percentage, or per unit.
2-11 A “break-even analysis” does not describe the real value of a CVP analysis, which
shows profit at any volume of activity within the relevant range. The break-even point is
2-12 No. break-even points can vary greatly within an industry. For example, Rolls
2-13 No. The CVP technique you choose is a matter of personal preference or
2-14 Three ways of lowering a break-even point, holding other factors constant, are:
decrease total fixed costs, increase selling prices, and decrease unit variable costs.
2-15 No. In addition to being quicker, incremental analysis is simpler. This is
2-16 Operating leverage is a firm’s ratio of fixed to variable costs. A highly leveraged
2-17 An increase in demand for a company’s products will drive almost all other cost–
driver levels higher. This will cause cost drivers to exceed capacity or the upper end of
2-19 No. In retailing, the contribution margin is likely to be smaller than the gross
margin.
2-20 No. CVP relationships pertain to both profit-seeking and nonprofit organizations.
2-21 Contribution margin could be lower because the proportion of sales of the product
bearing the higher unit contribution margin is lower than the proportion budgeted.
2-22
before incomeTarget
incomenet
in Change
unitsin
in volume Change
Contribution margin
per unit
2-24 The fixed salary portion of the compensation is a fixed cost. It is independent of
2-25 The key to determining cost behavior is to ask, “If there is a change in the level of
the cost driver, will the total cost of the resource change immediately?” If the answer is
yes, the resource cost is variable. If the answer is no, the resource cost is fixed. Using
2-26 The key to determining cost behavior is to ask, “If there is a change in the level of
the cost driver, will the total cost of the resource change immediately?” If the answer is
2-27 Suggested value chain functions are listed below.
New Products
New Technology
New Positioning
Strategies
New Pricing
❑ Marketing
❑ R & D
❑ Design
❑ R & D
❑ Design
❑ Marketing
❑ Support
functions
❑ Marketing
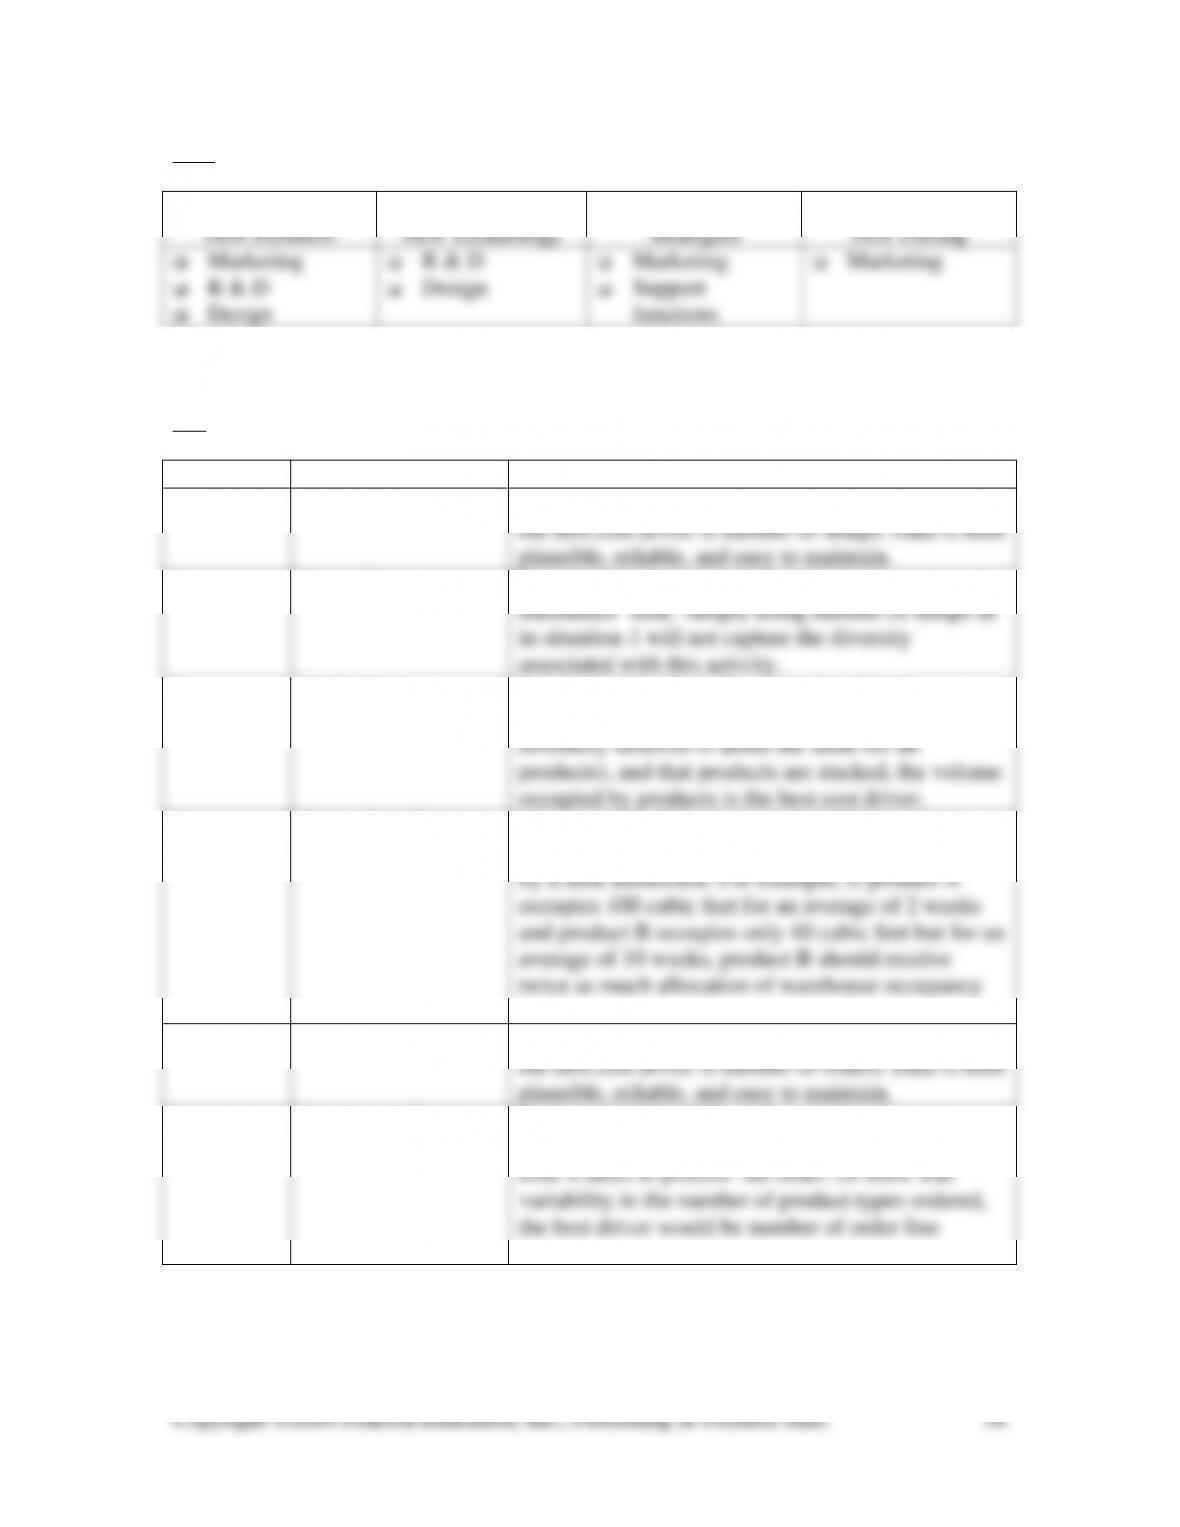
2–28 (10-15 min.)
Situation
Best Cost Driver
Justification
1.
Number of Setups
Because each setup takes the same amount of time,
the best cost driver is number of setups. Data is both
plausible, reliable, and easy to maintain.
2.
Setup Time
Longer setup times result in more consumption of
mechanics’ time. Simply using number of setups as
in situation 1 will not capture the diversity
associated with this activity.
3.
Cubic Feet
Assuming that all products are stored in the
warehouse for about the same time (that is
inventory turnover is about the same for all
products), and that products are stacked, the volume
occupied by products is the best cost driver.
4.
Cubic Feet Weeks
If some types of product are stored for more time
than others, the volume occupied must be multiplied
by a time dimension. For example, if product A
occupies 100 cubic feet for an average of 2 weeks
and product B occupies only 40 cubic feet but for an
average of 10 weeks, product B should receive
twice as much allocation of warehouse occupancy
costs.
5.
Number of Orders
Because each order takes the same amount of time,
the best cost driver is number of orders. Data is both
plausible, reliable, and easy to maintain.
6.
Number of Orders
Each order is for different types of products but
there is not diversity between them in terms of the
time it takes to process the order. (If there was
variability in the number of product types ordered,
the best driver would be number of order line
items.)
2–29 (5-10 min.)
1. Contribution margin = $960,000 – $533,000 = $427,000
Net income = $427,000 – $310,000 = $117,000
3. Sales = $500,000 + $520,000 = $1,020,000
Net income = $520,000 – $200,000 = $320,000
2-30 (5-10 min.)
The $278,000 annual advertising fee is a fixed cost. The $6,100 cost for each
advertisement is a variable cost.
2-31 (5-10 min.)
With respect to the cost driver sales dollars, the $3,200,000 annual salaries of sales
personnel is a fixed cost. The sales commissions, travel costs, and entertainment costs are
2-32 (10-20 min.)
1. d = c × (a – b)
$750,000 = 125,000 × ($26 – b)
2. d = c × (a – b)
3. c = d ÷ (a – b)
4. d = c × (a – b)
= 60,000 × ($30 – $20)
5. d = c × (a – b)
$172,000 = 86,000 × (a – $12)
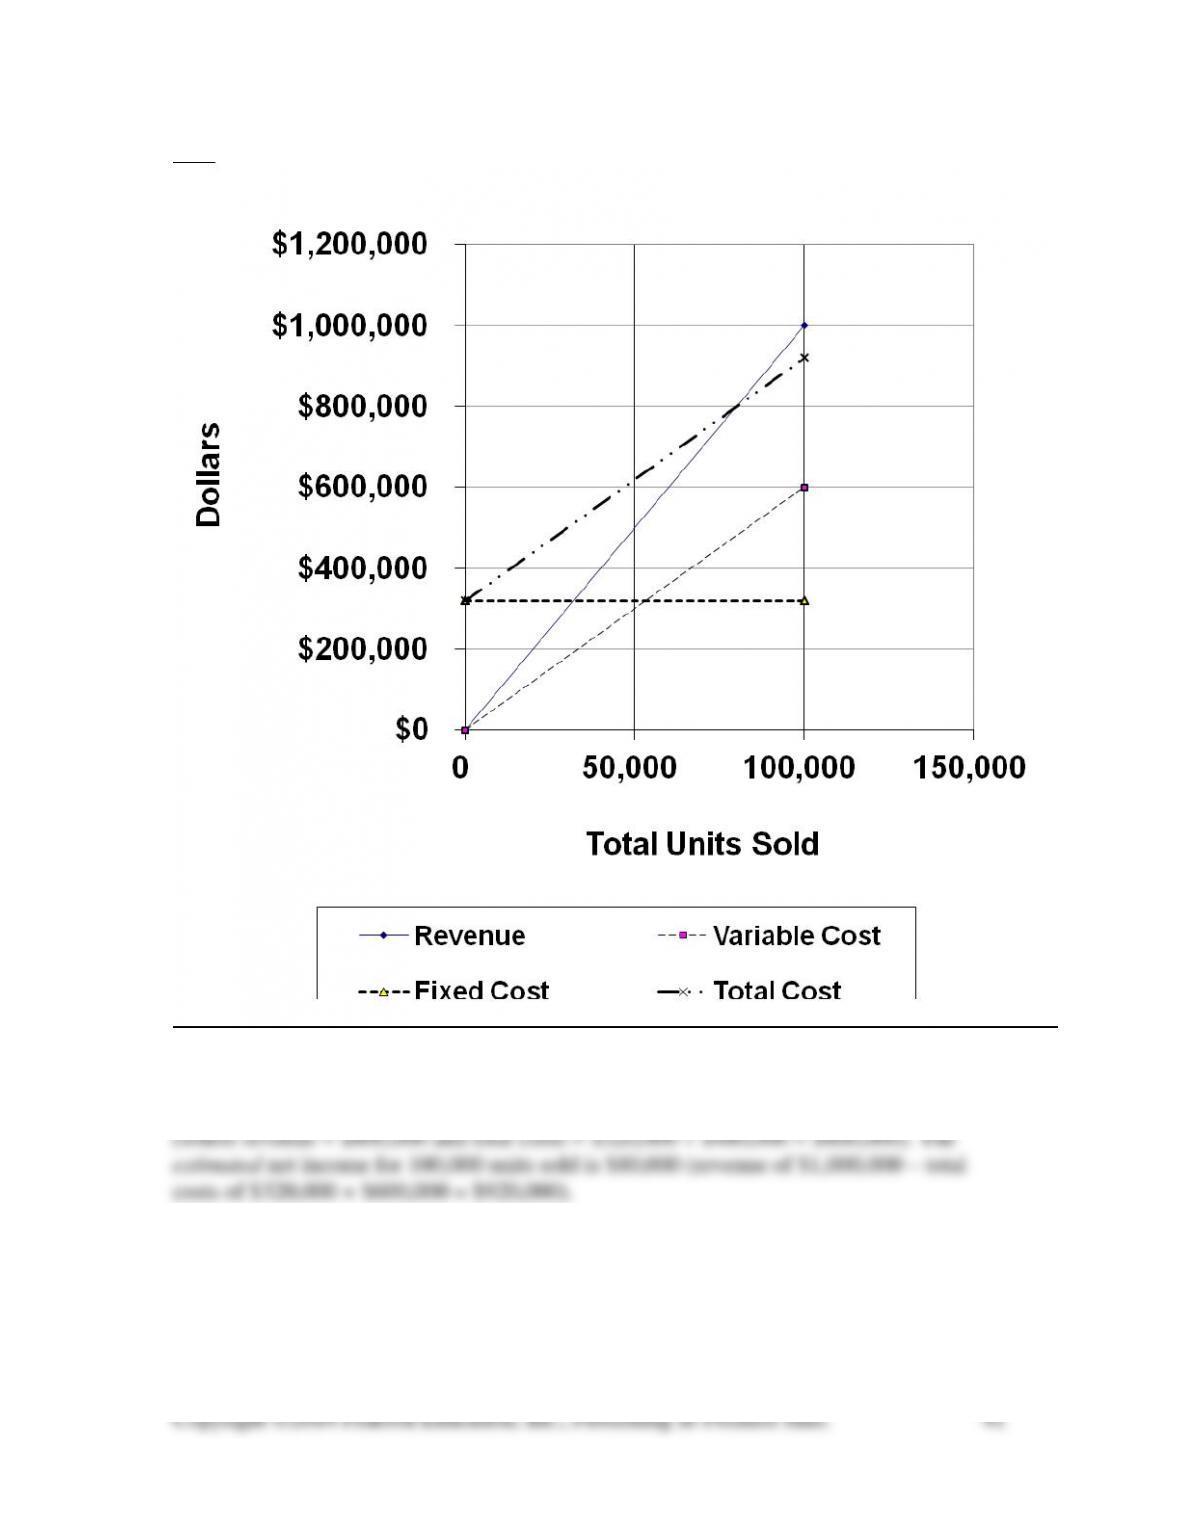
2-33 (10 min.)
Using the graph above, the estimated breakeven point in total units sold is about 80,000
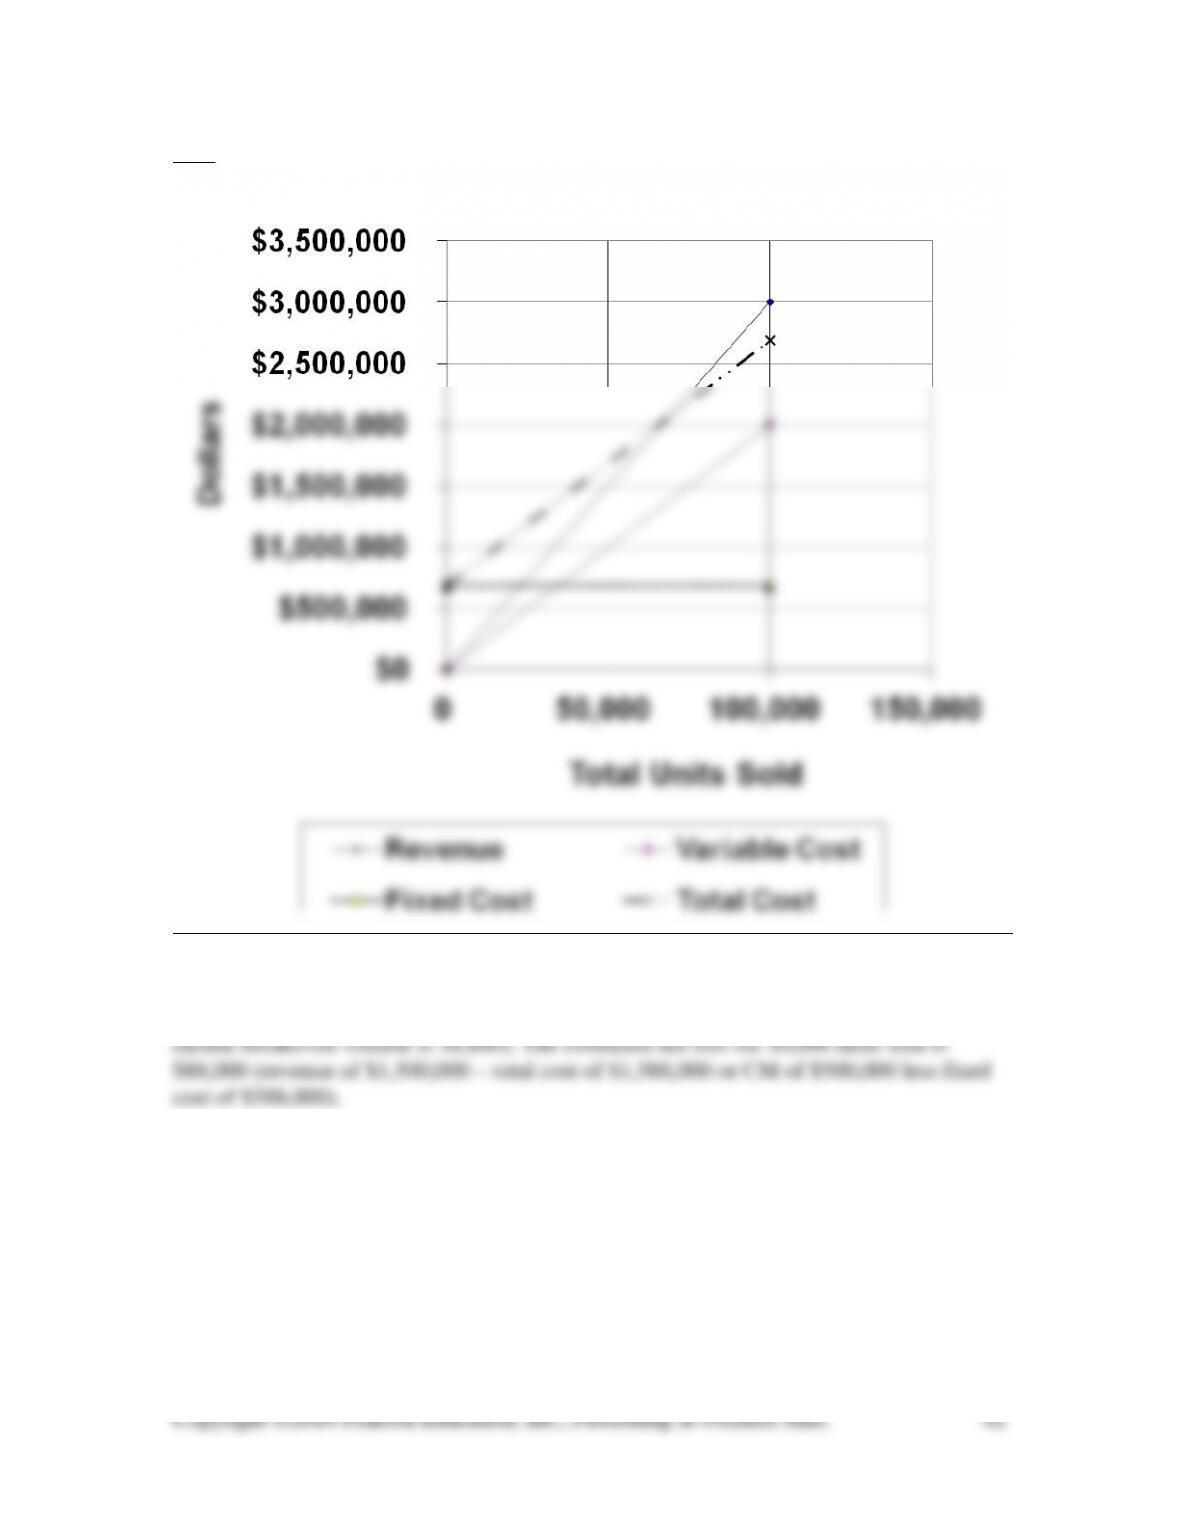
2-34 (10 min.)
Using the graph above, the estimated breakeven point in total units sold is about 60,000
$-
$0.05
$0.10
100,000 125,000 150,000 175,000 200,000
Square Feet
Labor Cost per Square Foot
Supplies Cost per Square Foot
Square Feet
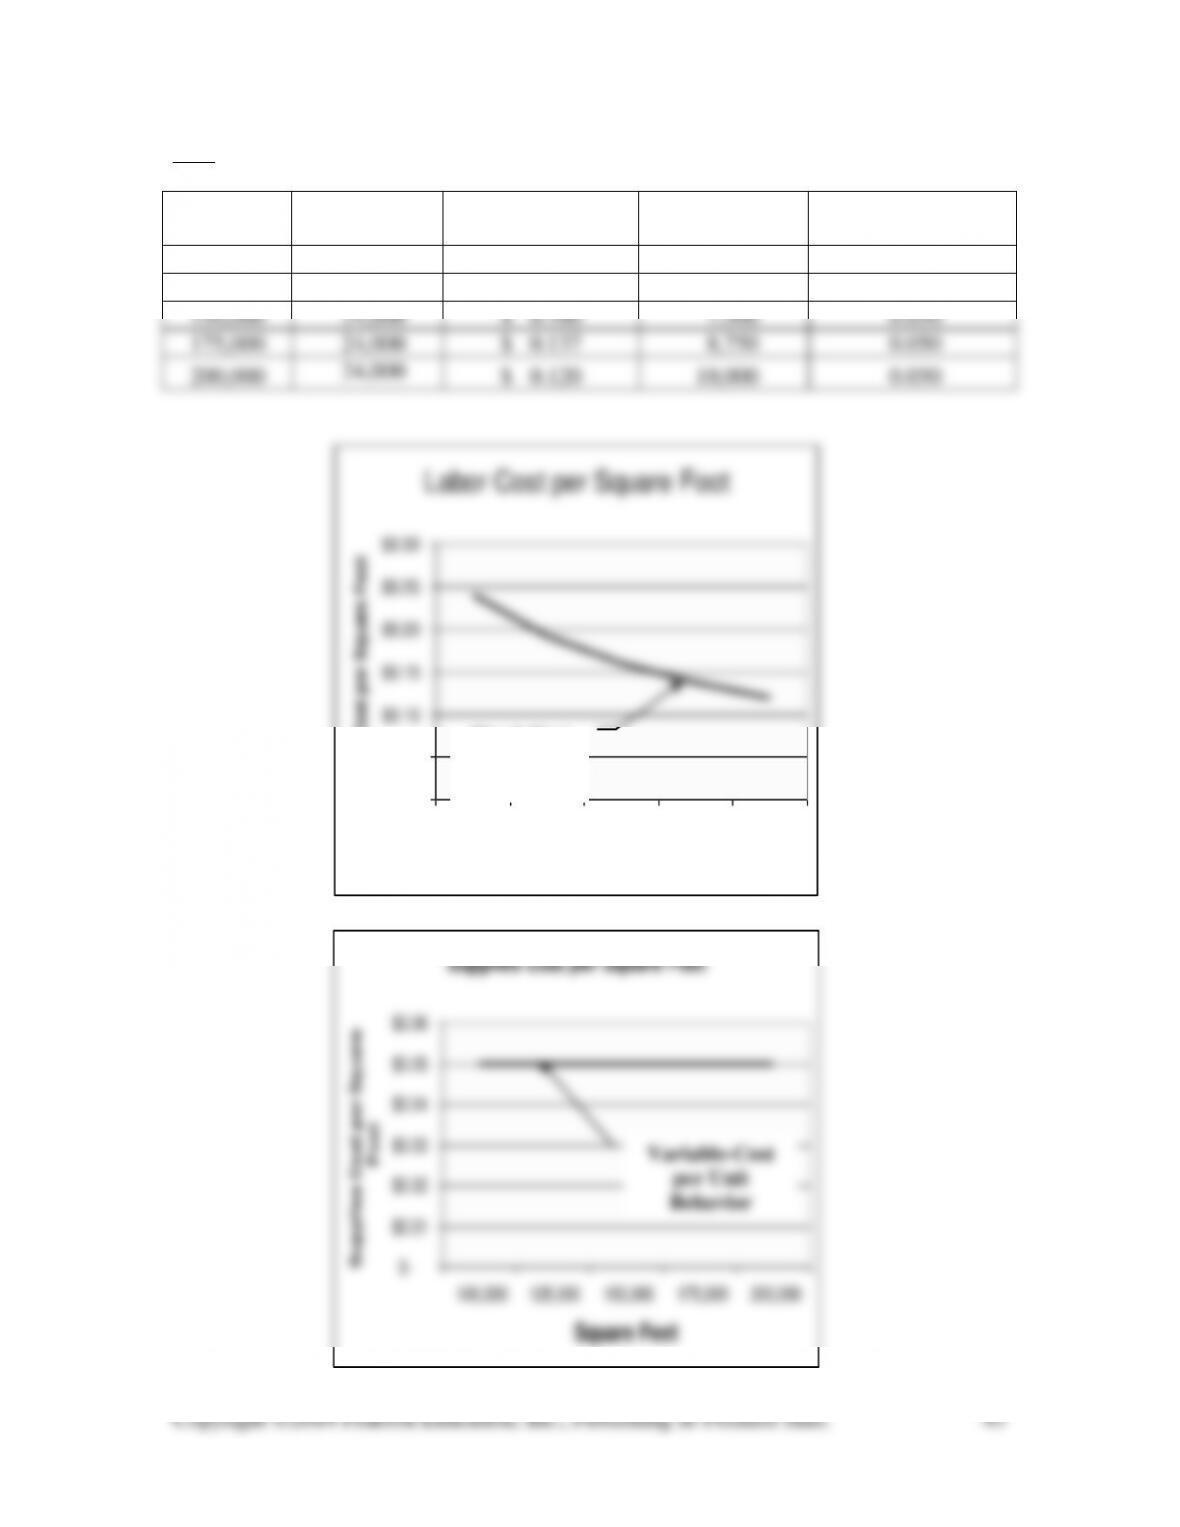
2-35 (20–25 min.)
Square
Feet
Labor Cost
Labor Cost per
Square Foot
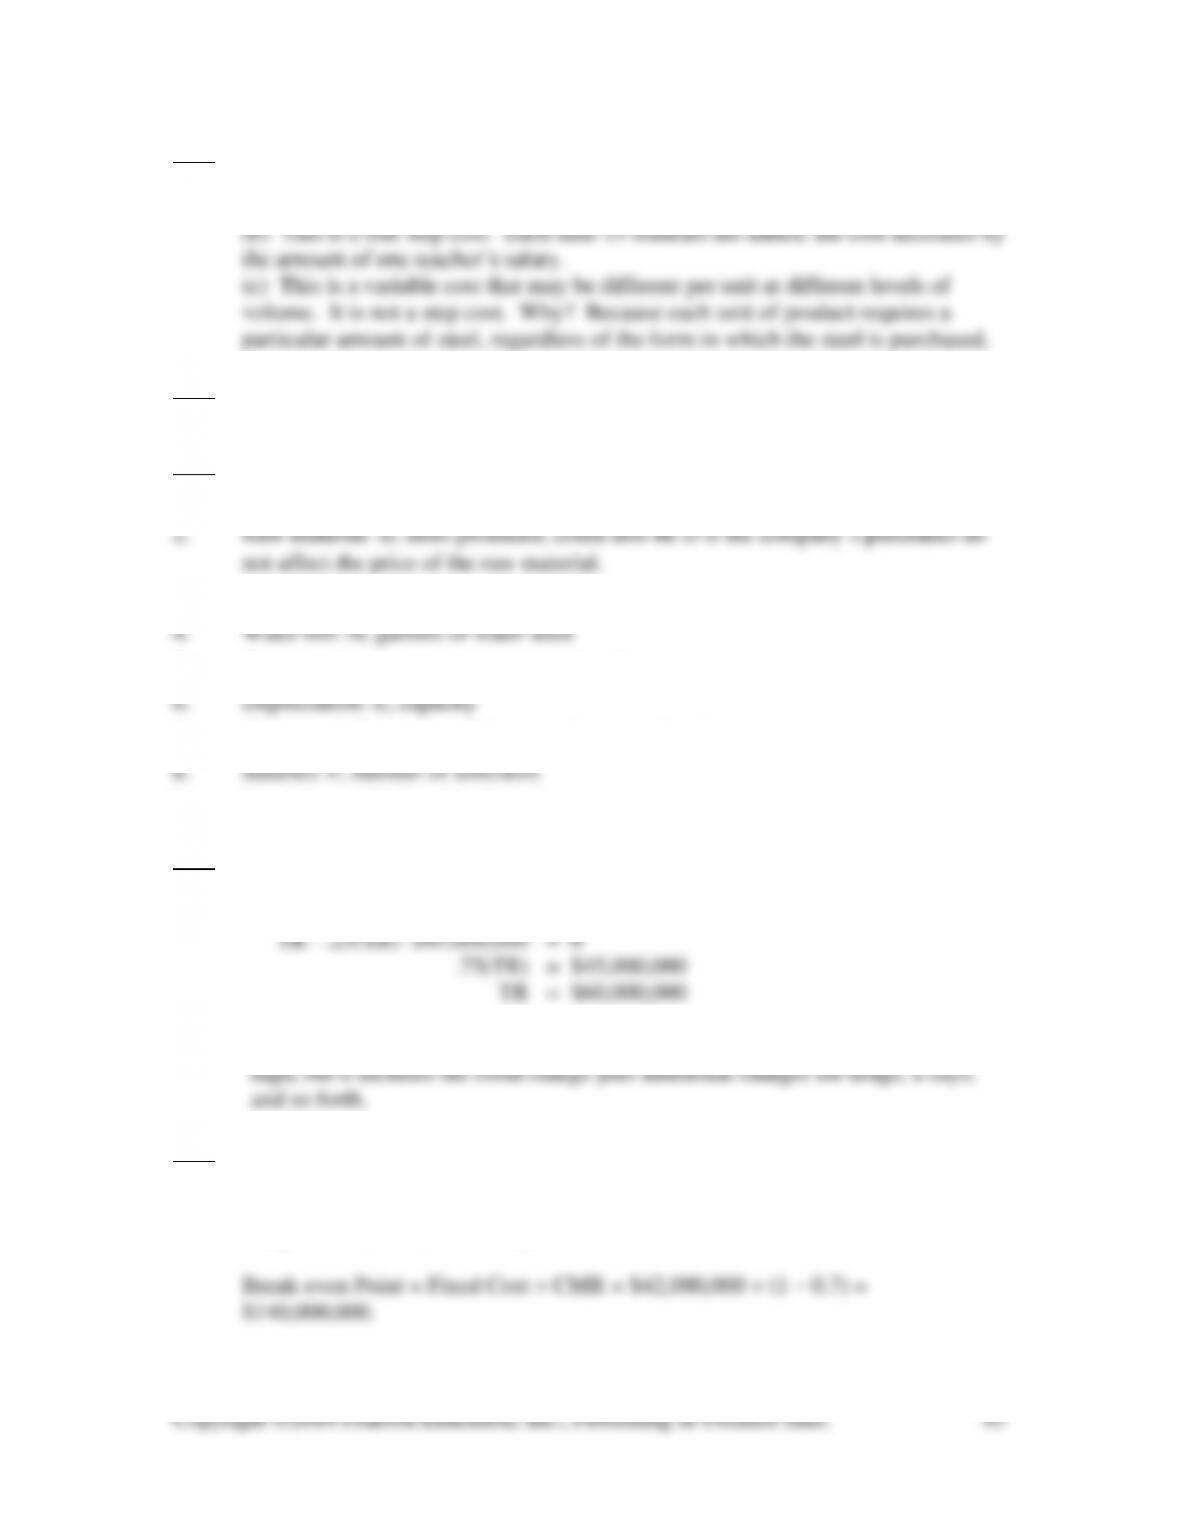
Supplies Cost
Supplies Cost per
Square Foot
100,000
$24,000
$ 0.240
$ 5,000
$0.050
125,000
24,000
$ 0.192
6,250
0.050
150,000
24,000
$ 0.160
7,500
0.050
175,000
24,000
$ 0.137
8,750
0.050
200,000
24,000
$ 0.120
10,000
0.050
Fixed-Cost
per Unit
Behavior

2-36 (20-25 min.)
Supplies
Labor Cost Per Cost per
Square Square Foot Total Labor Square Supplies
Feet (Estimated) Cost Foot Cost
$0
$2,000
$4,000
$6,000
$8,000
$10,000
$12,000
$14,000
100,000
125,000
150,000
Labor Costs
Square Feet
Total Labor Cost
$0
$1,000
$2,000
$3,000
$4,000
$5,000
$6,000
$7,000
$8,000
$9,000
$10,000
100,000
125,000
150,000
Supplies Cost
Square Feet
Total Supplies Cost
Labor cost shows a fixed-cost behavior, while supplies cost shows a variable-cost
behavior.
2-37 (5 min.) Only (b) is a step cost.
(a) This is a fixed cost. The same cost applies to all volumes in the relevant
range.
2-38 (5 min.) The $8,000 is a fixed cost and the $52 per unit is a variable cost. By
definition, adding a fixed cost and a variable cost together produces a mixed cost.
2-39 (10-15 min.)
1. Machining labor: G, number of units completed or labor hours
3. Annual wage: C or E (depending on work levels), labor hours
5. Quantity discounts: A, amount purchased
7. Sheet steel: D, number of farm implements of various types
9. Natural gas bill: C, cubic feet of usage
2-40 (10 min.)
1. Let TR = total revenue
2. Daily revenue per patient = $60,000,000 ÷ 37,500 = $1,600. This may appear
2-41 (10 min.)
1. The break-even point in total revenue is fixed cost divided by the contribution-
margin ratio (CMR). CMR equals 1 – Variable-Cost Ratio.
2.
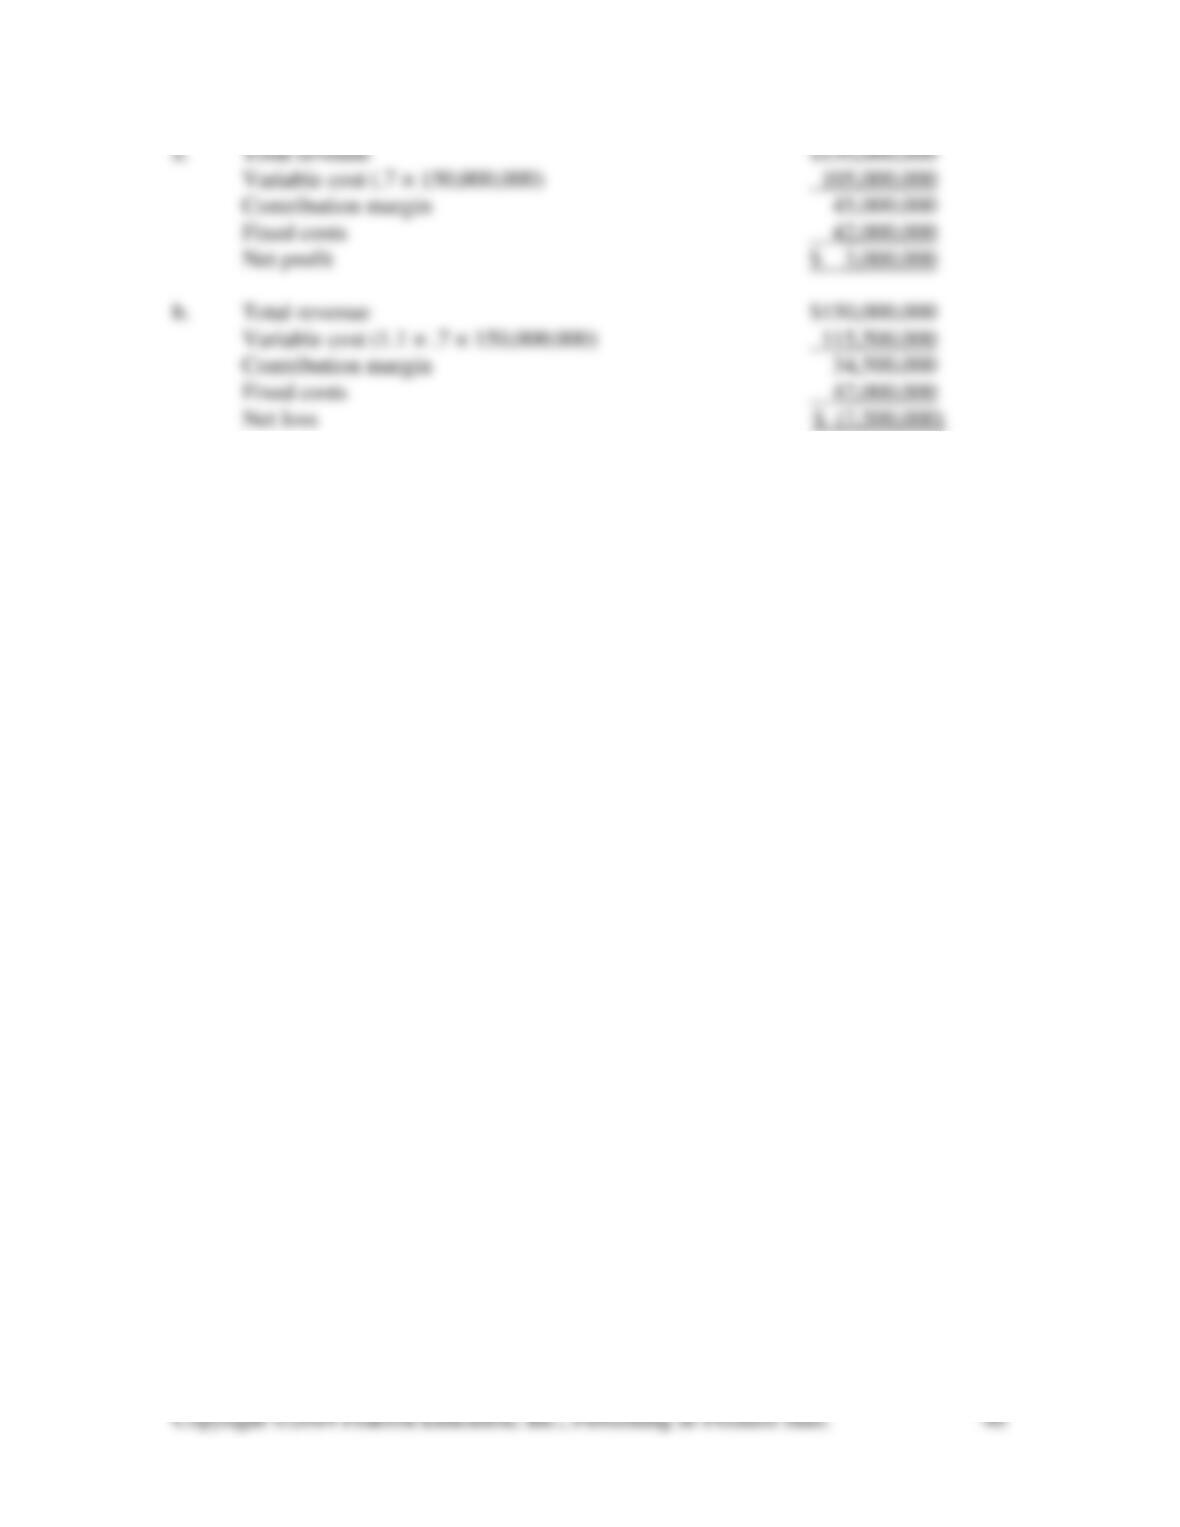
a. Total revenue $150,000,000
Variable cost (.7 × 150,000,000) 105,000,000
Contribution margin 45,000,000
Fixed costs 42,000,000
Net profit $ 3,000,000
b. Total revenue $150,000,000
Variable cost (1.1 × .7 × 150,000,000) 115,500,000
Contribution margin 34,500,000
Fixed costs 42,000,000
Net loss $ (7,500,000)