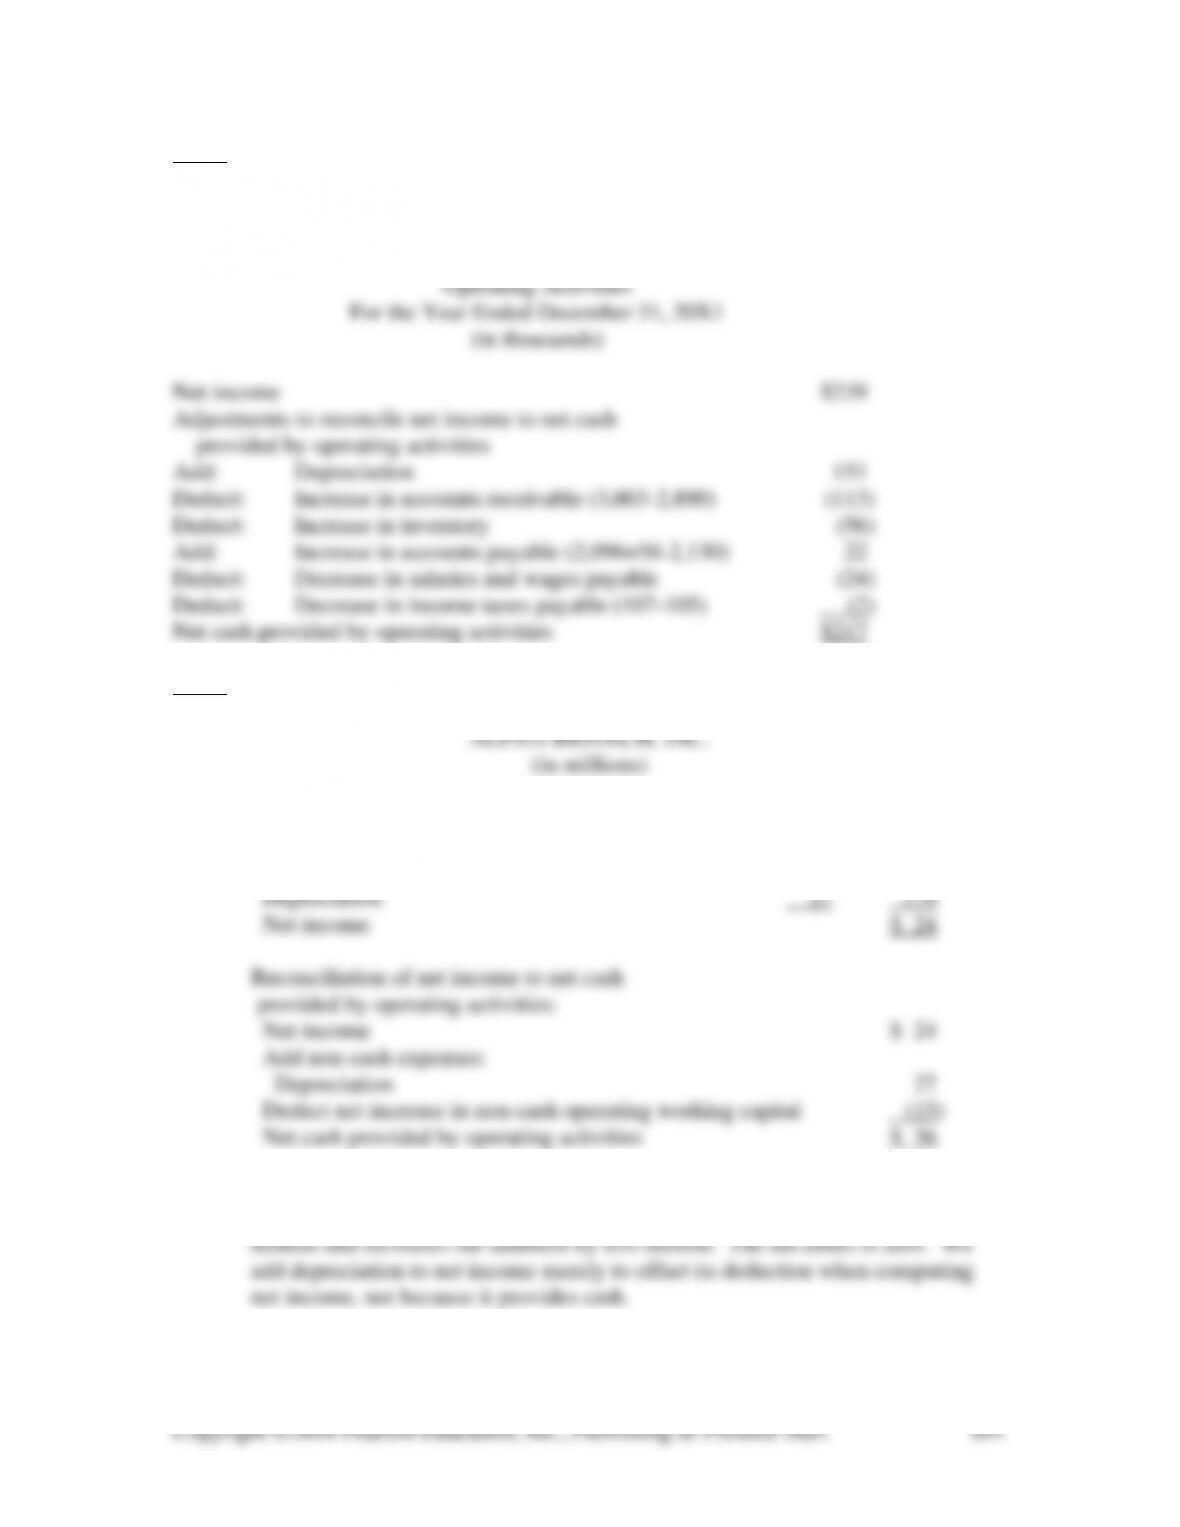
16-52 (10-20 min.)
DENALI ALE COMPANY
Supporting Schedule to Statement of Cash Flows
Reconciliation of Net Income to Net Cash Provided by
16-53 (10 min.)
1. Income Statement:
Sales $203
Non-depreciation expenses ($169 – $17) $152
2. An increase in depreciation does not affect net cash flow from operating
activities. The $10 million increase in depreciation decreases net income by $10
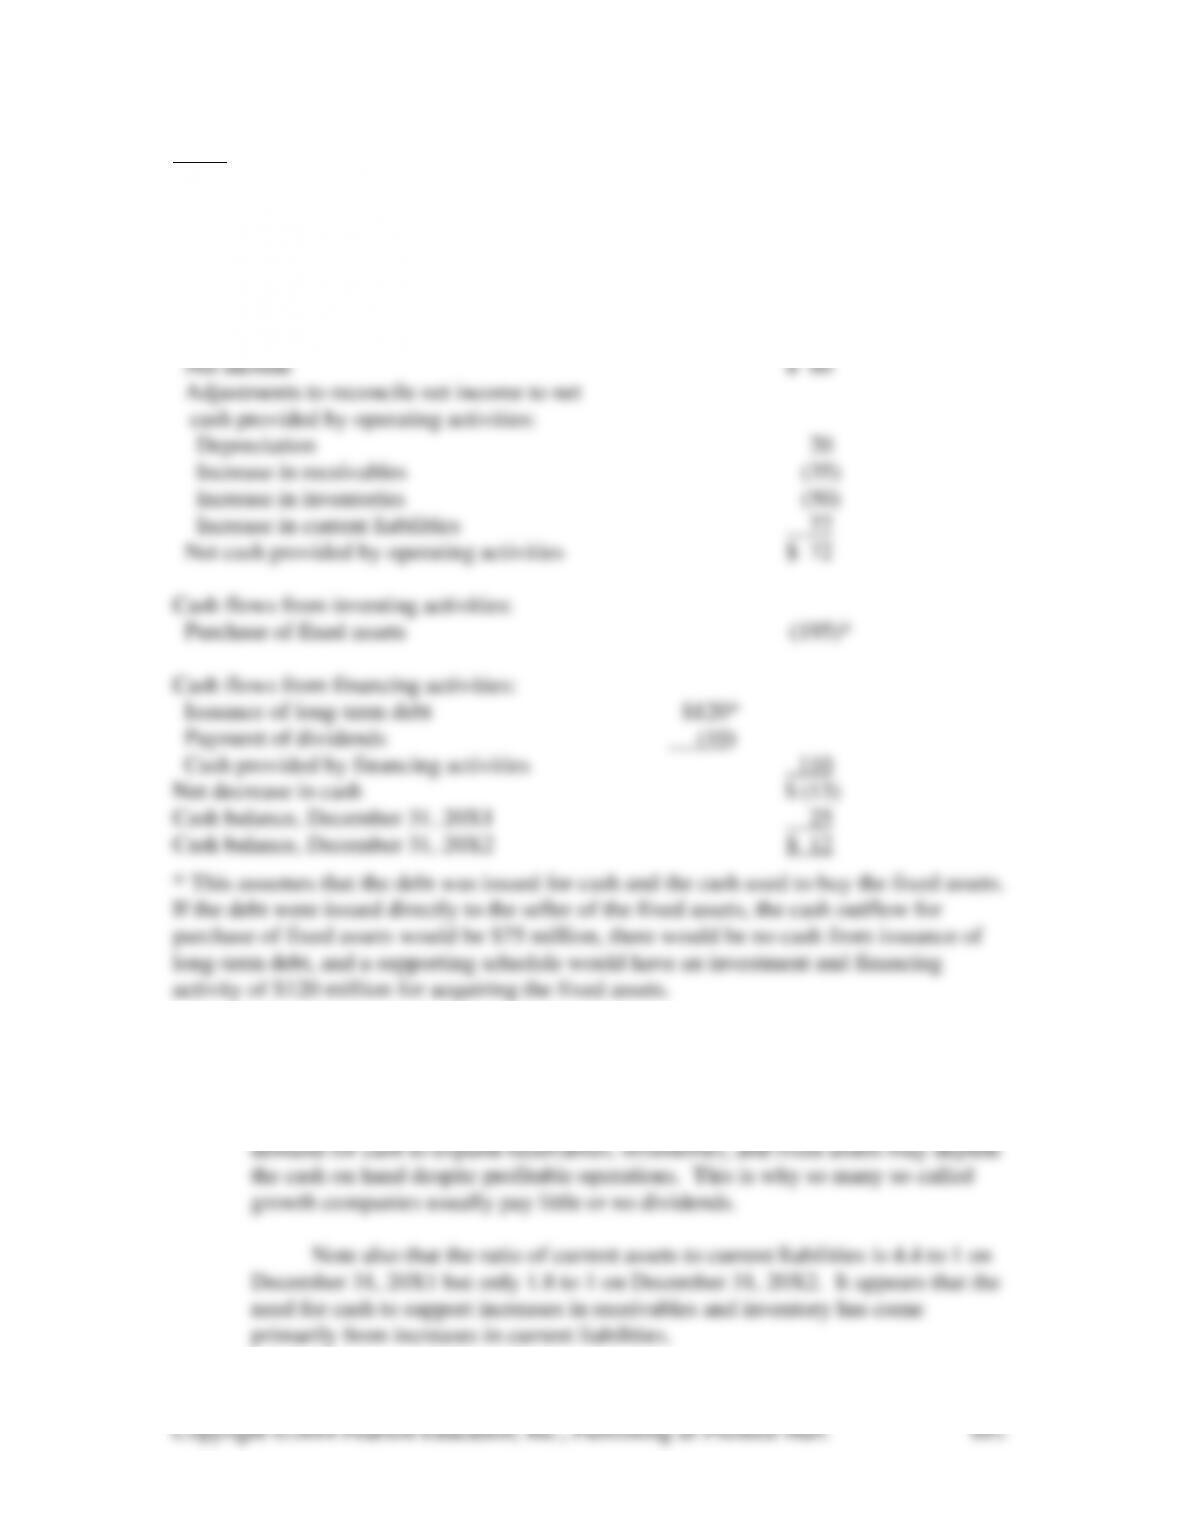
16-54 (20-30 min.)
1. O’TOOLE COMPANY
Statement of Cash Flows
For the Year Ended December 31, 20X2
(in millions)
Cash flows from operating activities:
2. Dear Mr. O’Toole:
Severe shortages of cash commonly accompany rapid corporate growth.
Profitable operations usually produce heavy supplies of cash. But the insatiable
Copyright ©2014 Pearson Education, Inc., Publishing as Prentice Hall.
693
16-55 (30-40 min.)
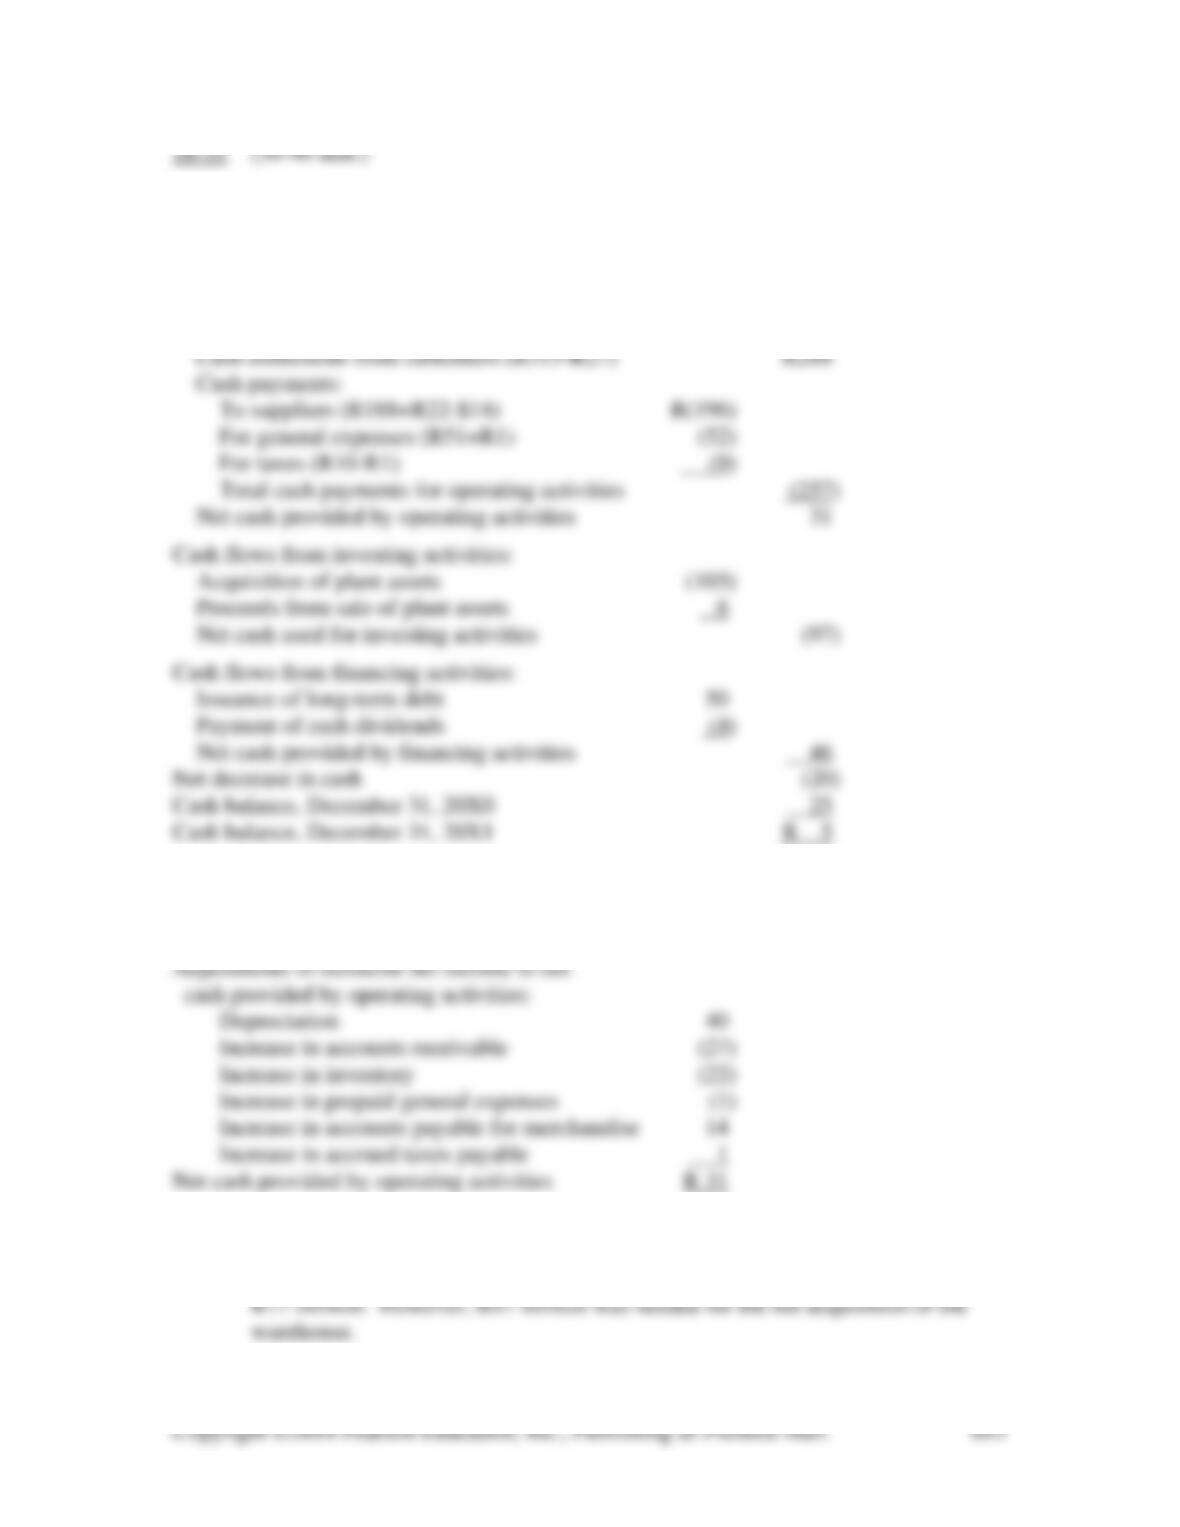
1. SOUTH AFRICAN IMPORTS COMPANY
Statement of Cash Flows
For the Year Ended December 31, 20X1
(in millions)
Cash flows from operating activities:
2. Reconciliation of Net Income to Net Cash
Provided by Operating Activities
Net income R 26
3. Botha’s stress may be reduced but not eliminated. The statement of cash flows
shows why cash has fallen by R20 million. Operating activities provided R31
million, and financing activities provided an additional R46 million, a total of
Copyright ©2014 Pearson Education, Inc., Publishing as Prentice Hall.
694
Severe crunches on cash commonly accompany quick corporate growth. There
may be large net income and working capital provided by operations, but heavy
demands for cash to expand receivables, inventories, and plant assets diminish
the cash on hand despite profitable operations. Hence, most “growth” companies
pay skimpy or no dividends.
16-56 (15 min.)
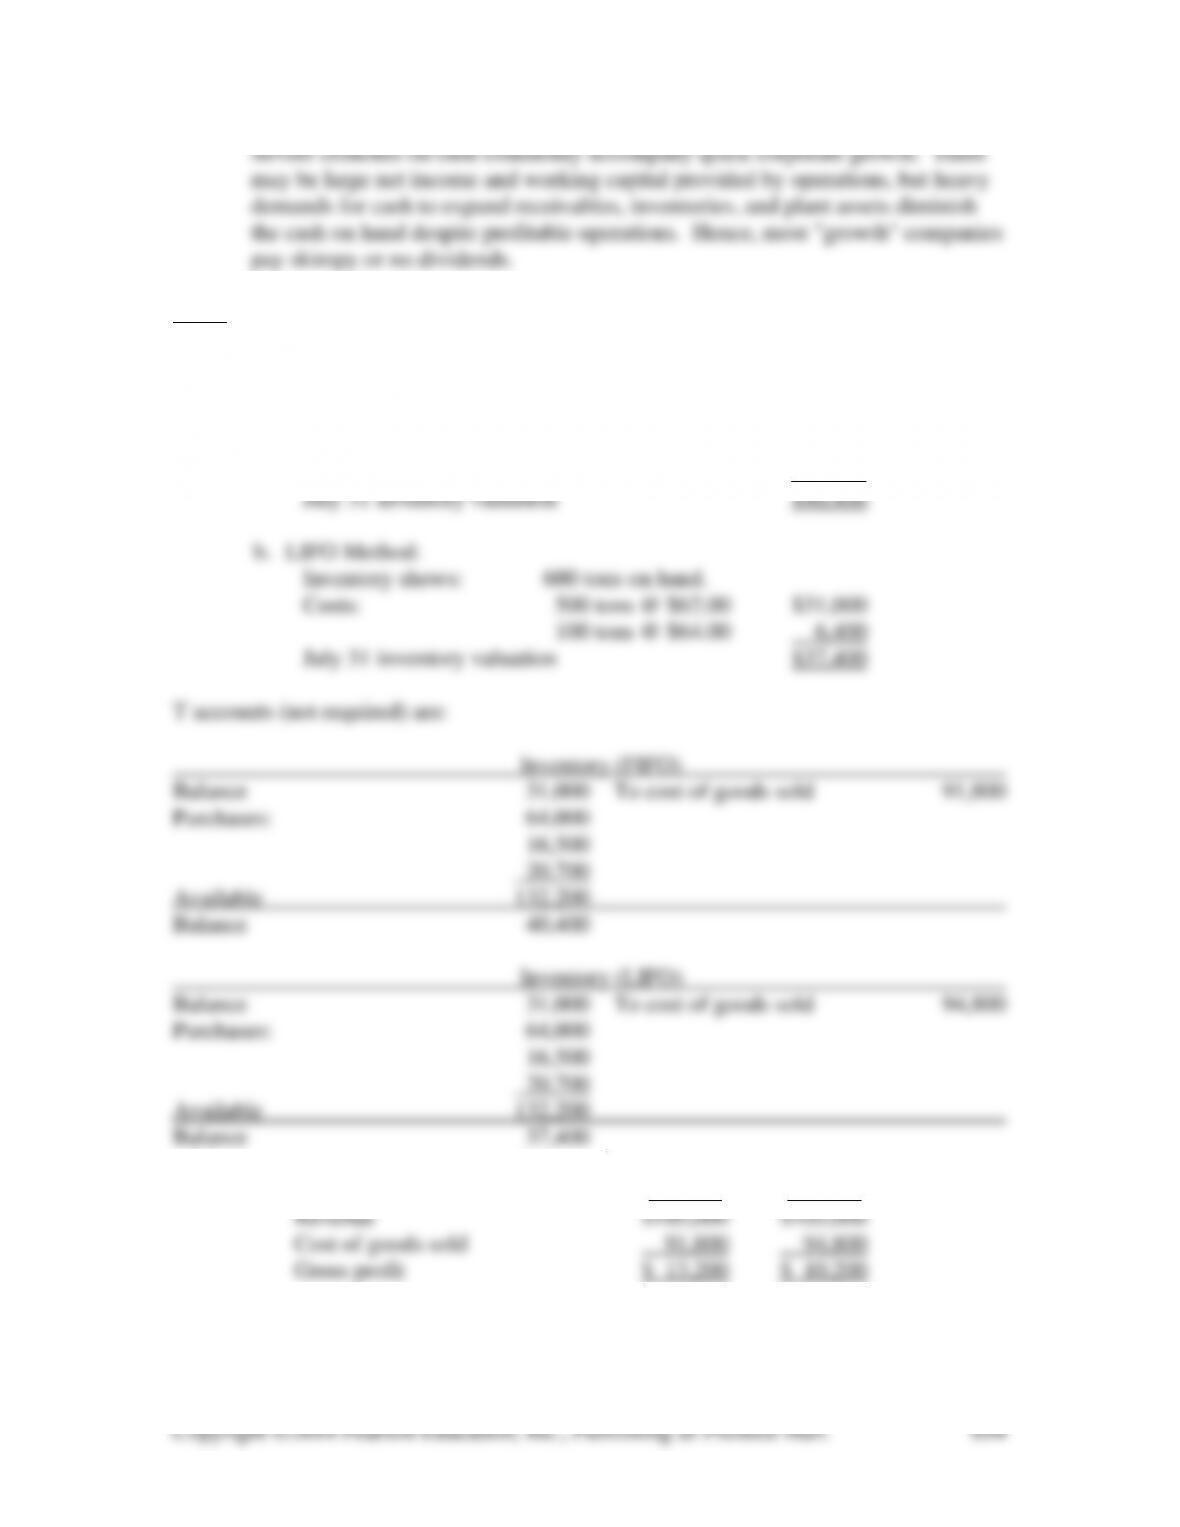
1. a. FIFO Method:
Inventory shows: 600 tons on hand.
Costs: 300 tons @ $69.00 $20,700
250 tons @ $66.00 16,500
50 tons @ $64.00 3,200
2. FIFO LIFO
16-57 (5-10 min.)
The inventory would be written down from $200,000 to $170,000 on March 31,
16-58 (5-10 min.)
The inventory would be written down from $200,000 to $170,000 on March 31,
1. Units LIFO FIFO
Sales 30,000 $710,000 $710,000
Cost of goods sold:
Inventory, December 31, 20X1 15,000 180,000 180,000
2. Gross margin is higher under FIFO. However, cash will be higher under LIFO
by .40 × ($320,000 – $230,000) = .45 × $90,000 = $40,500.
Copyright ©2014 Pearson Education, Inc., Publishing as Prentice Hall.
696
16-60 (20-30 min.)
1. and 2. Requirement 1 Requirement 2
(1) (2) (3) (4)
FIFO LIFO FIFO LIFO
Sales, 28,000 @ $17 $476,000 $476,000 $476,000 $476,000
Deduct cost of goods sold:
16-61 (10-15 min.)
1. (a) Operating income was lower by the $1,646 million, because R&D must be
charged to expense.
(b) Operating income would be $3,601 + $1,646 = $5,247 million.
3. $13 billion – $2 billion = $11 billion of goodwill
zero).
16-62 (15-20 min.)
1. Sales and either cash or accounts receivable (or a combination of both) would
increase by $1,000 million.
2. Cash and the liability account called Deposits on Bottles would be increased by
April 1. On June 30, Interest Expense and Deposits would be increased by 3/12
4. (a) Cash and the liability, Unearned Sales Revenue, would be increased by
$320,000 on December 31 for the ticket sales.
16-63 (15 min.) Amounts are in millions.
1. 2011 accounts receivable was:
3. 2011 retained earnings were:
$32,695 + $7,074 – $834 – $3,669 = $35,266.
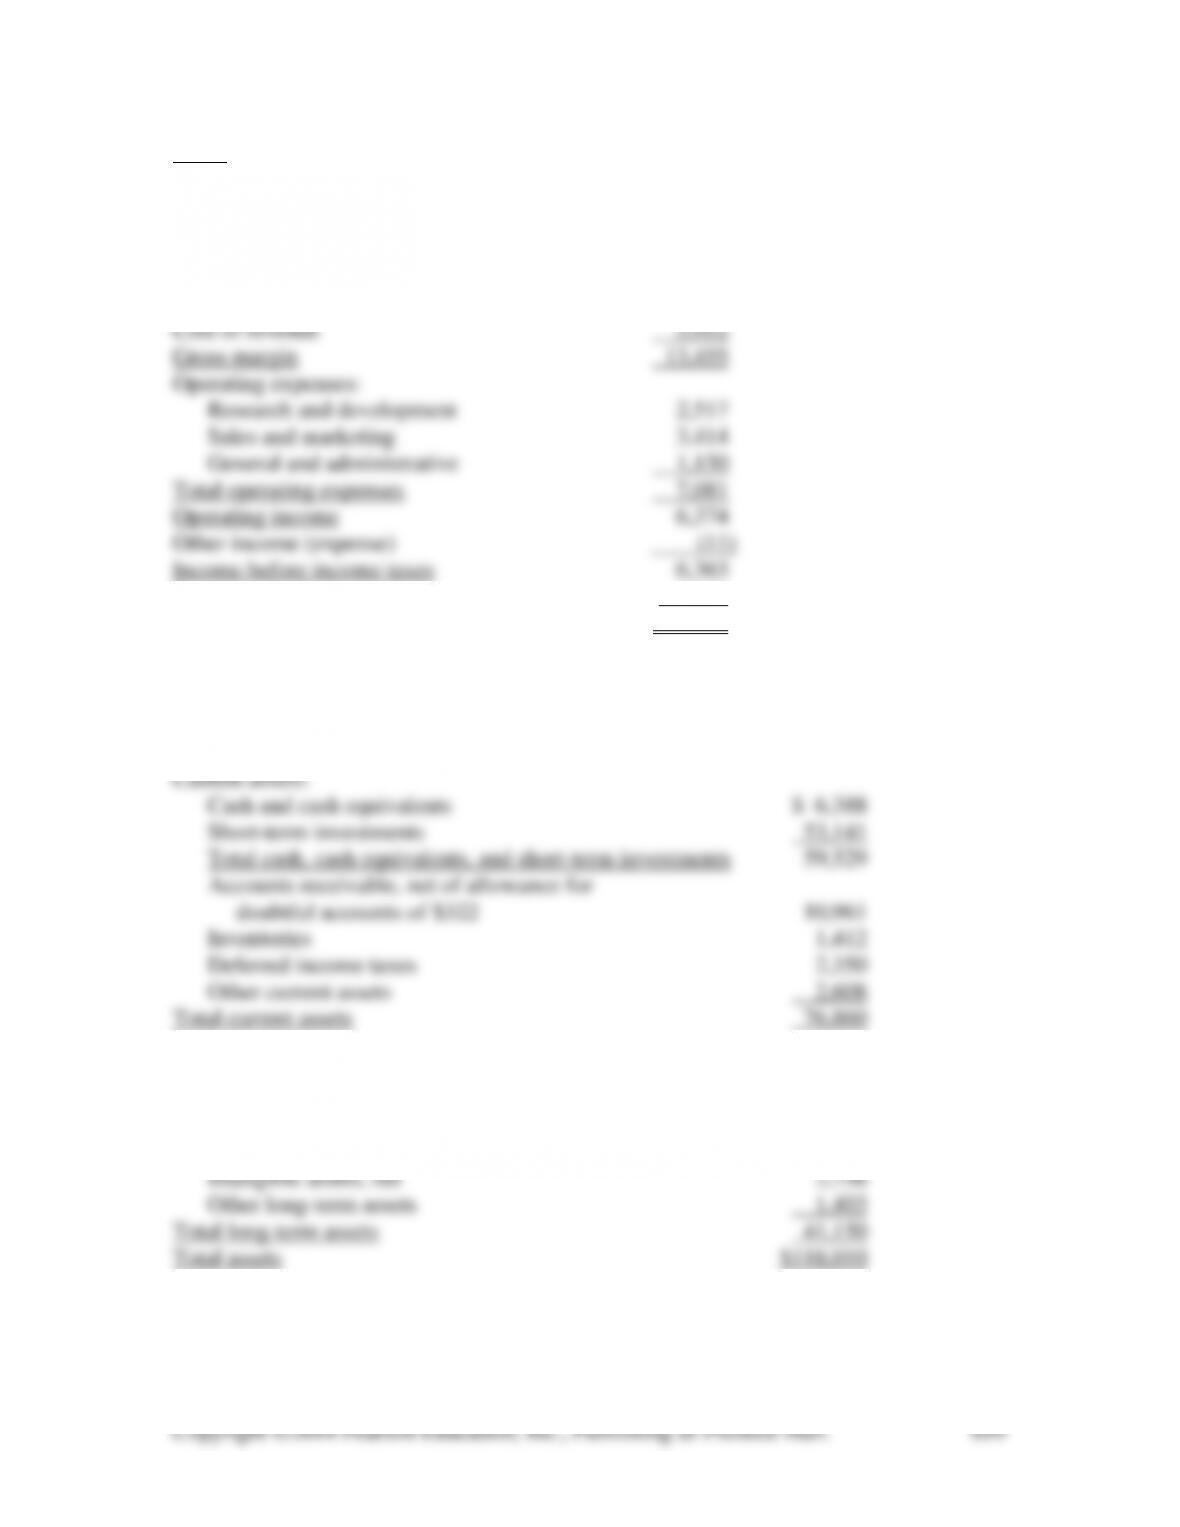
16-64 (10-15 min.) The following income statement and balance sheet contain the most
common subtotals, which are underlined:
MICROSOFT CORPORATION
Income Statement for the Three Months Ended March 31, 2012
Revenue $17,407
Provision for income taxes 1,255
Net income $ 5,108
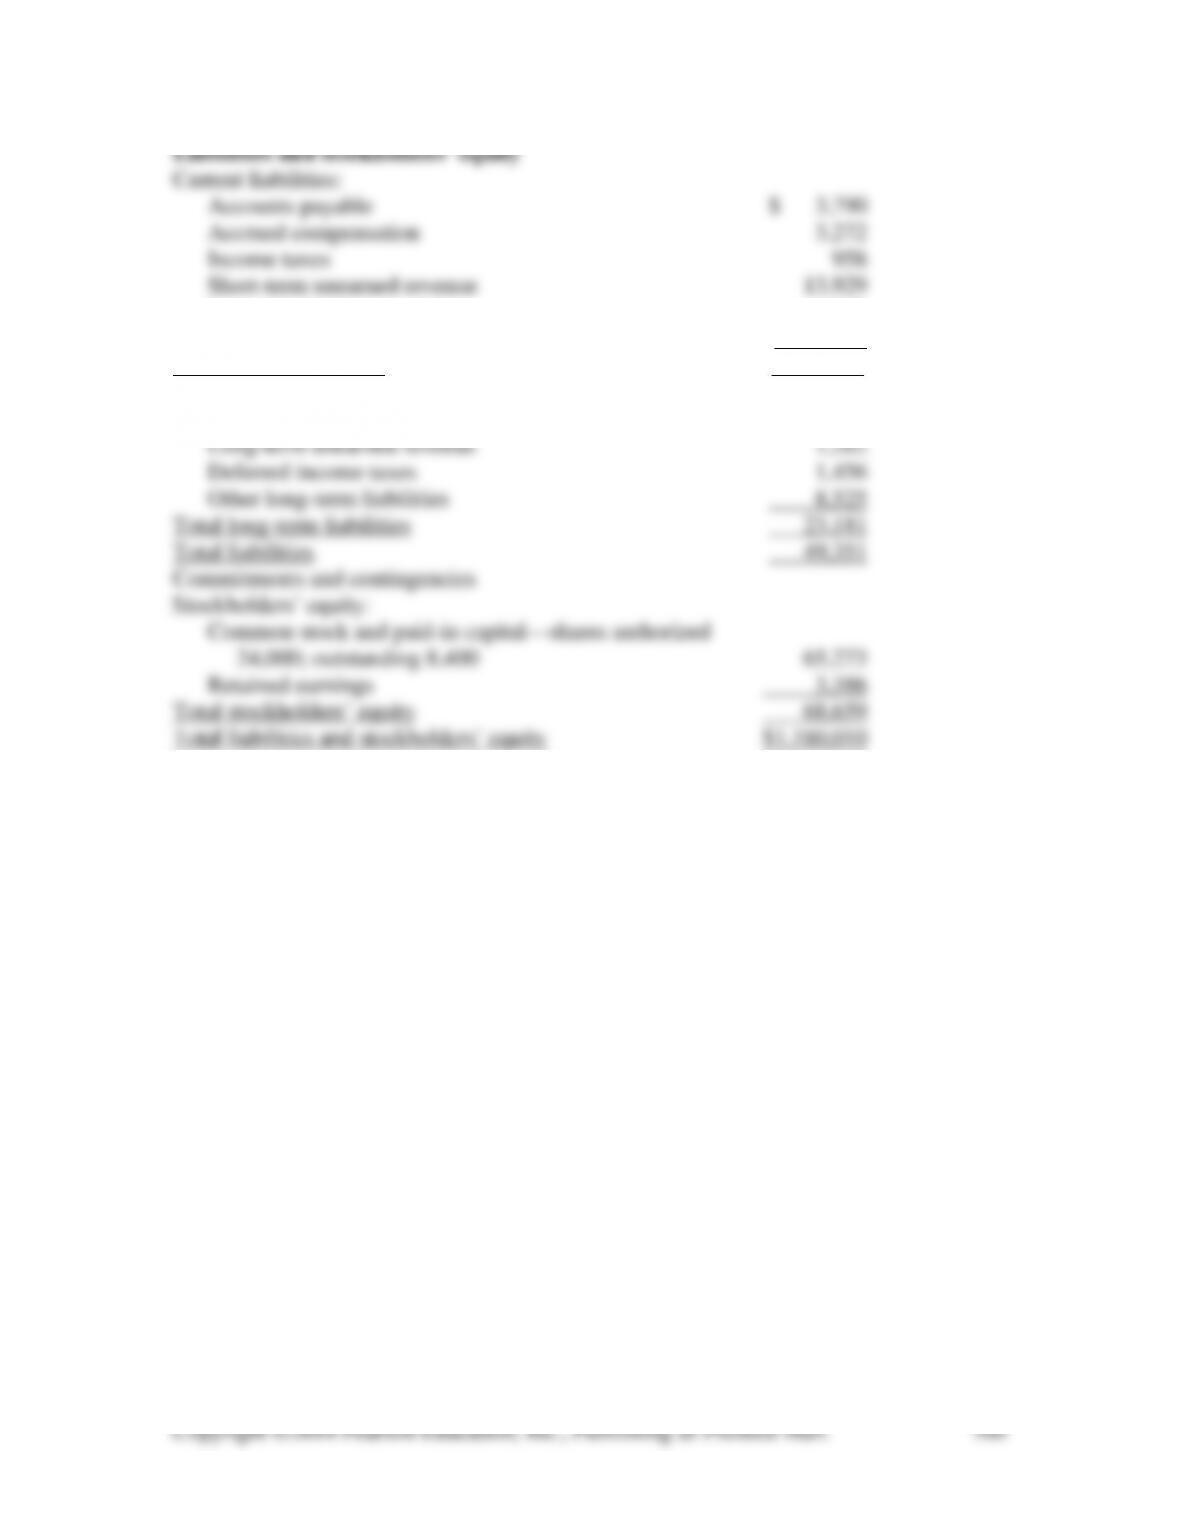
MICROSOFT CORPORATION
Balance Sheet as of March 31, 2012
Assets
Long-term assets:
Property and equipment, net of accumulated
depreciation of $10,952 8,225
Equity and other investments 9,068
Goodwill 19,698
Copyright ©2014 Pearson Education, Inc., Publishing as Prentice Hall.
700
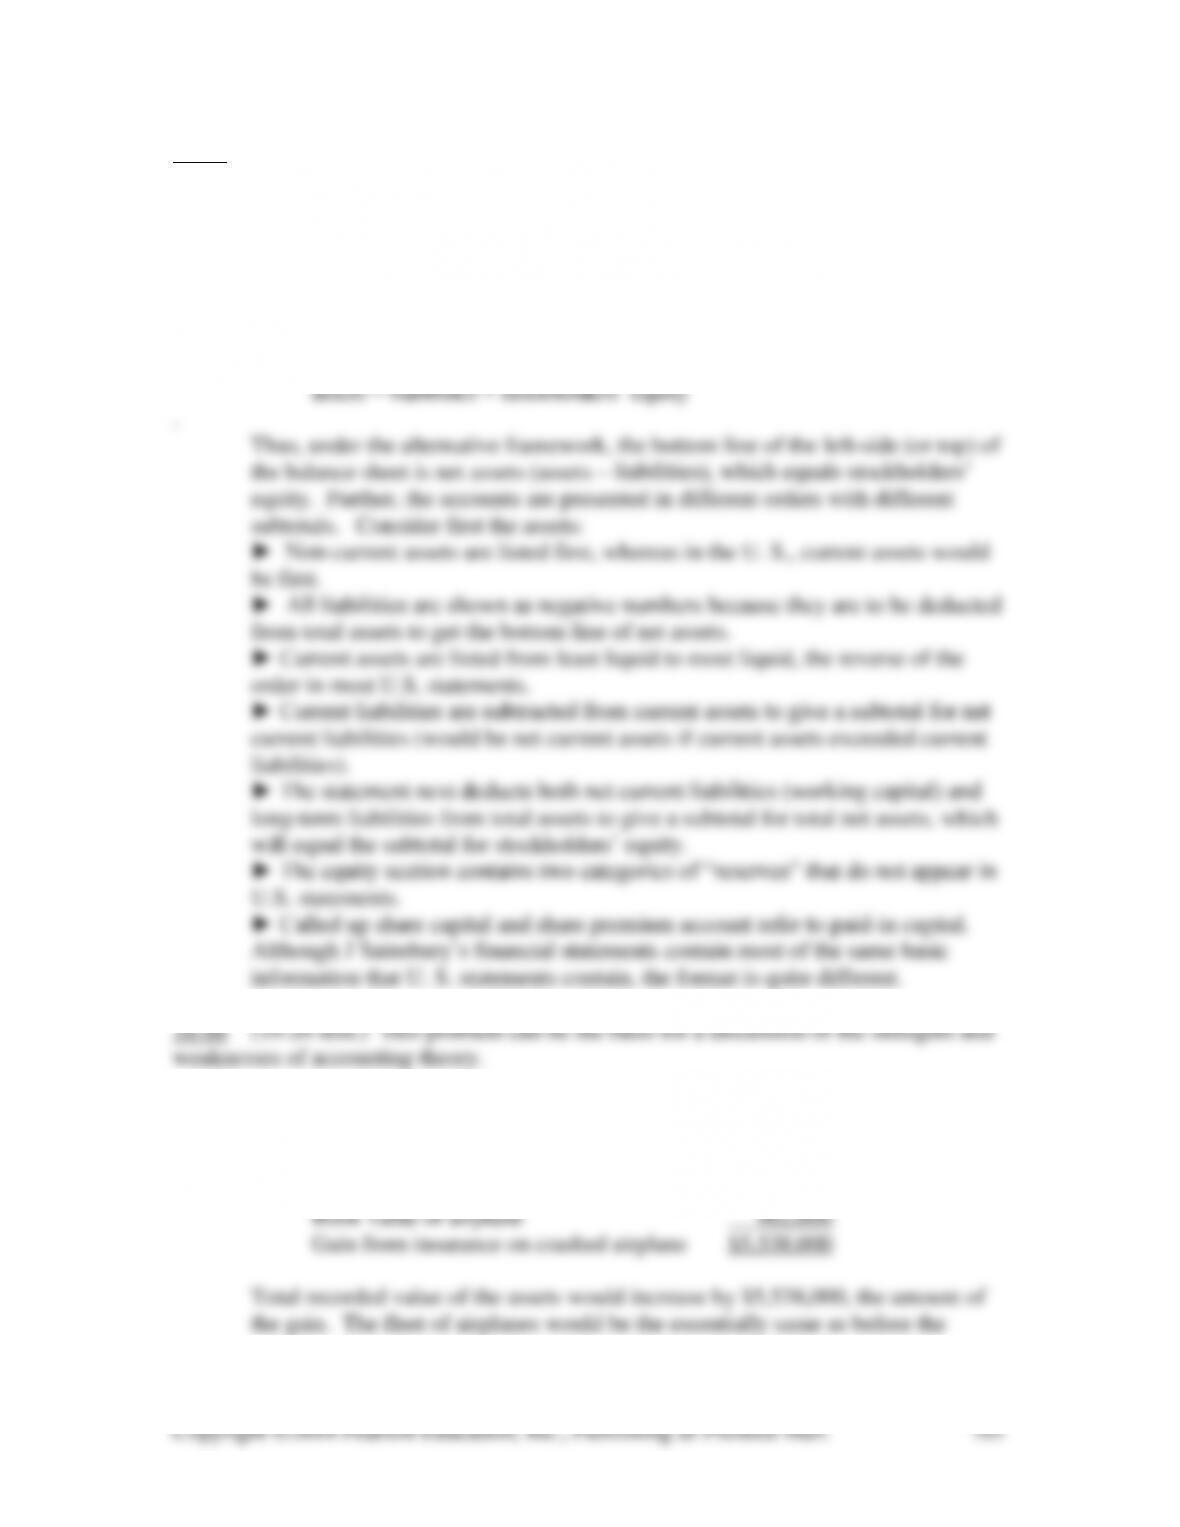
Liabilities and stockholders’ equity
Current liabilities:
Accounts payable $ 3,790
Accrued compensation 3,272
Income taxes 958
Short-term unearned revenue 13,929
Securities lending payable 1,210
Other current liabilities 3,011
Total current liabilities 26,170
Long-term liabilities:
Long-term debt 11,938
16-65 (10-15 min.)
A framework for the balance sheet equation that is popular in Europe and other
parts of the world is:
non–current assets – working capital – non-current liabilities = stockholders’ equity
In contrast, the U.S. framework is:
1. There would be a “gain from insurance on crashed airplane” recognized on the
income statement:
Insurance payments received $6,500,000
Copyright ©2014 Pearson Education, Inc., Publishing as Prentice Hall.
702
crash, except that a 727 with a book value of $6.5 million has replaced a similar
727 with a book value of only $962,000.
2. Accounting for casualties is very controversial. It gets to the heart of the
question of what is income and what is capital. Does the $6.5 million represent a
return of capital or a payment of both capital and income?
the $6.5 million is really a return of capital (where capital is thought of in
16-67 (5-10 min.)
a. Investing e. Financing h. Financing
16-68 (10-15 min.)
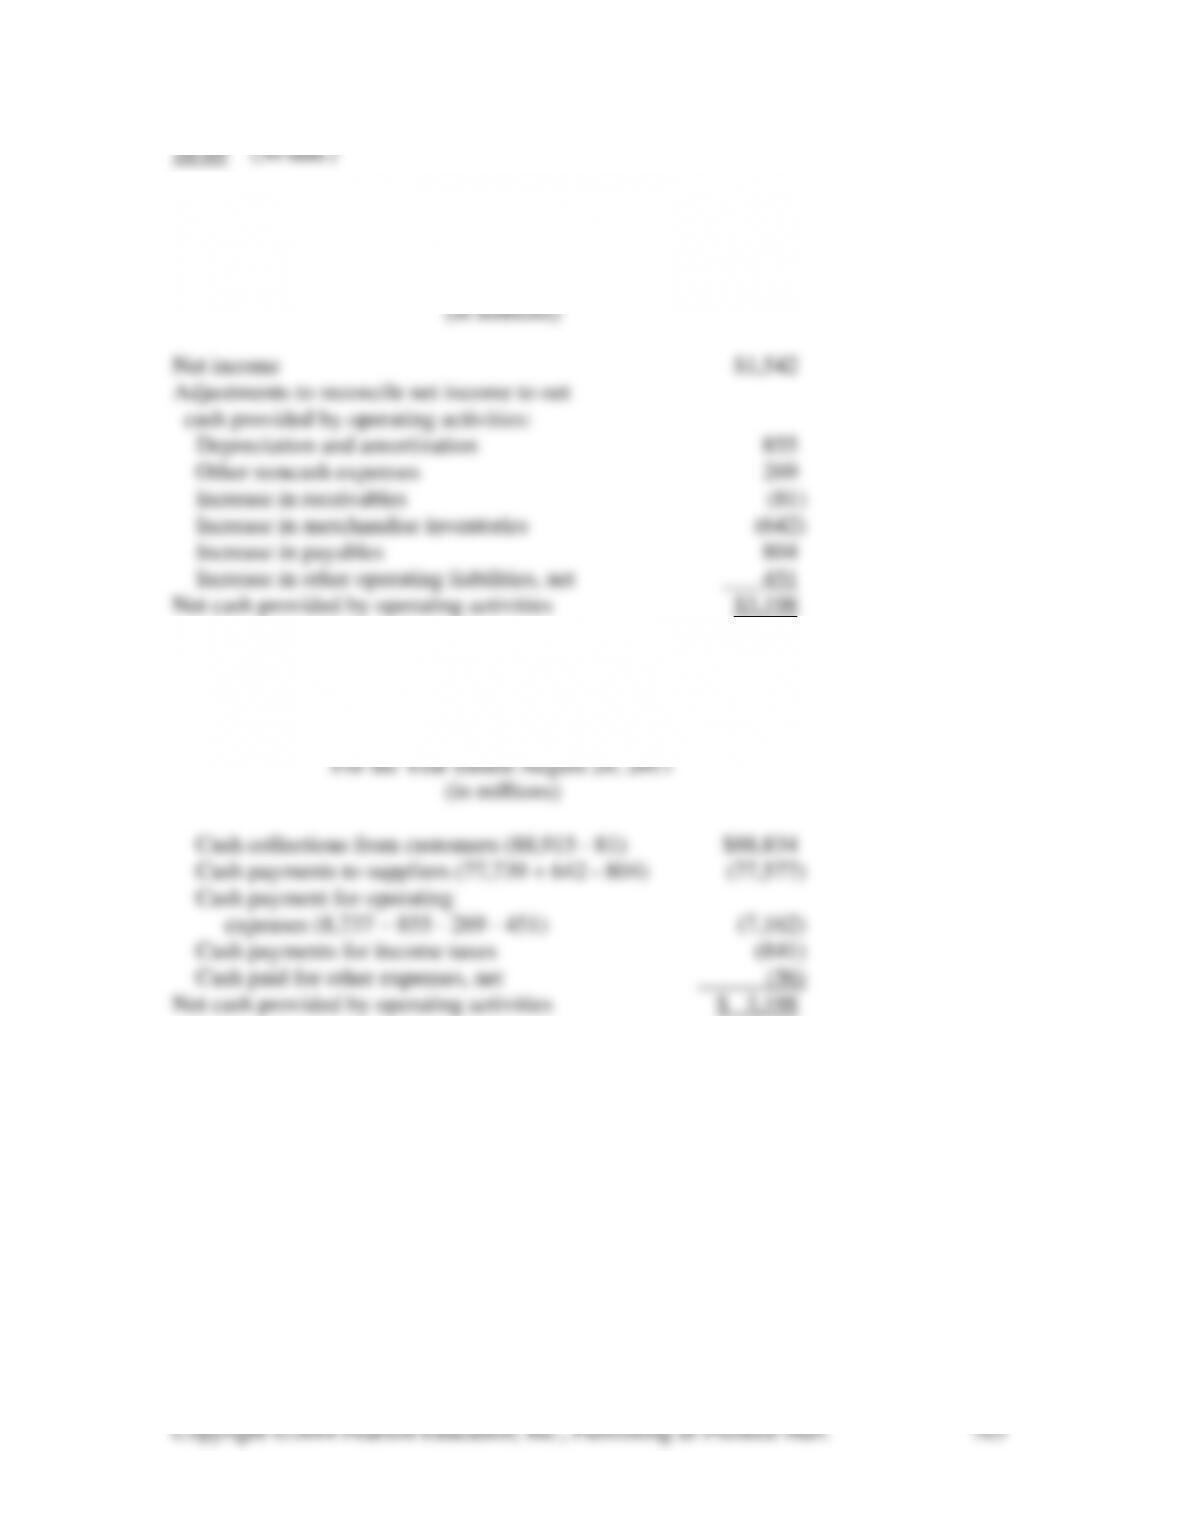
1. The only line for interest on the statement of cash flows will be under operating
2. The increase of $69,594,000 – $62,075,000 = $7,519,000 in interest payable
would be added to net income in computing net cash provided by operating
Copyright ©2014 Pearson Education, Inc., Publishing as Prentice Hall.
703
16-69 (30 min.)
1. COSTCO WHOLESALE CORPORATION
Statement of Cash Flows From Operating Activities
(Indirect Method)
For the Year Ended August 28, 2011
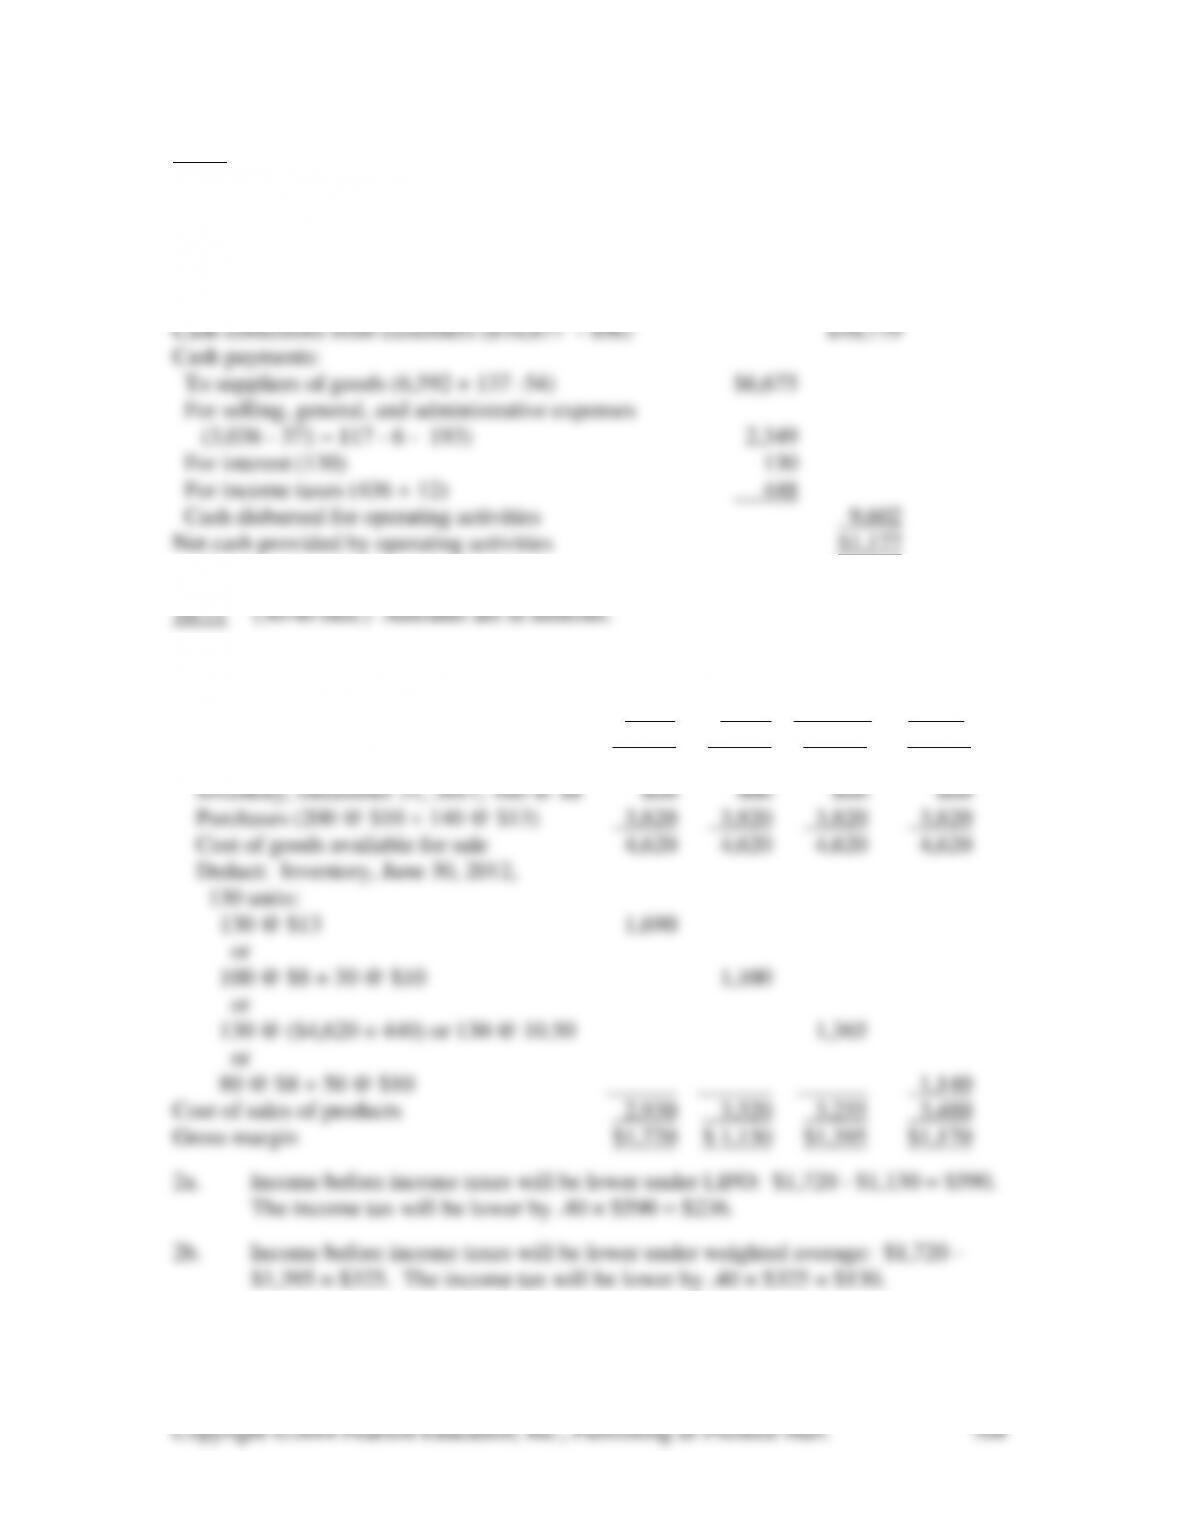
2. COSTCO WHOLESALE CORPORATION
Statement of Cash Flows From Operating Activities
(Direct Method)
16-70 (25-35 min.)
1. NORDSTROM, INC.
Cash Flows from Operating Activities
For the Year Ended January 28, 2012
(in millions)
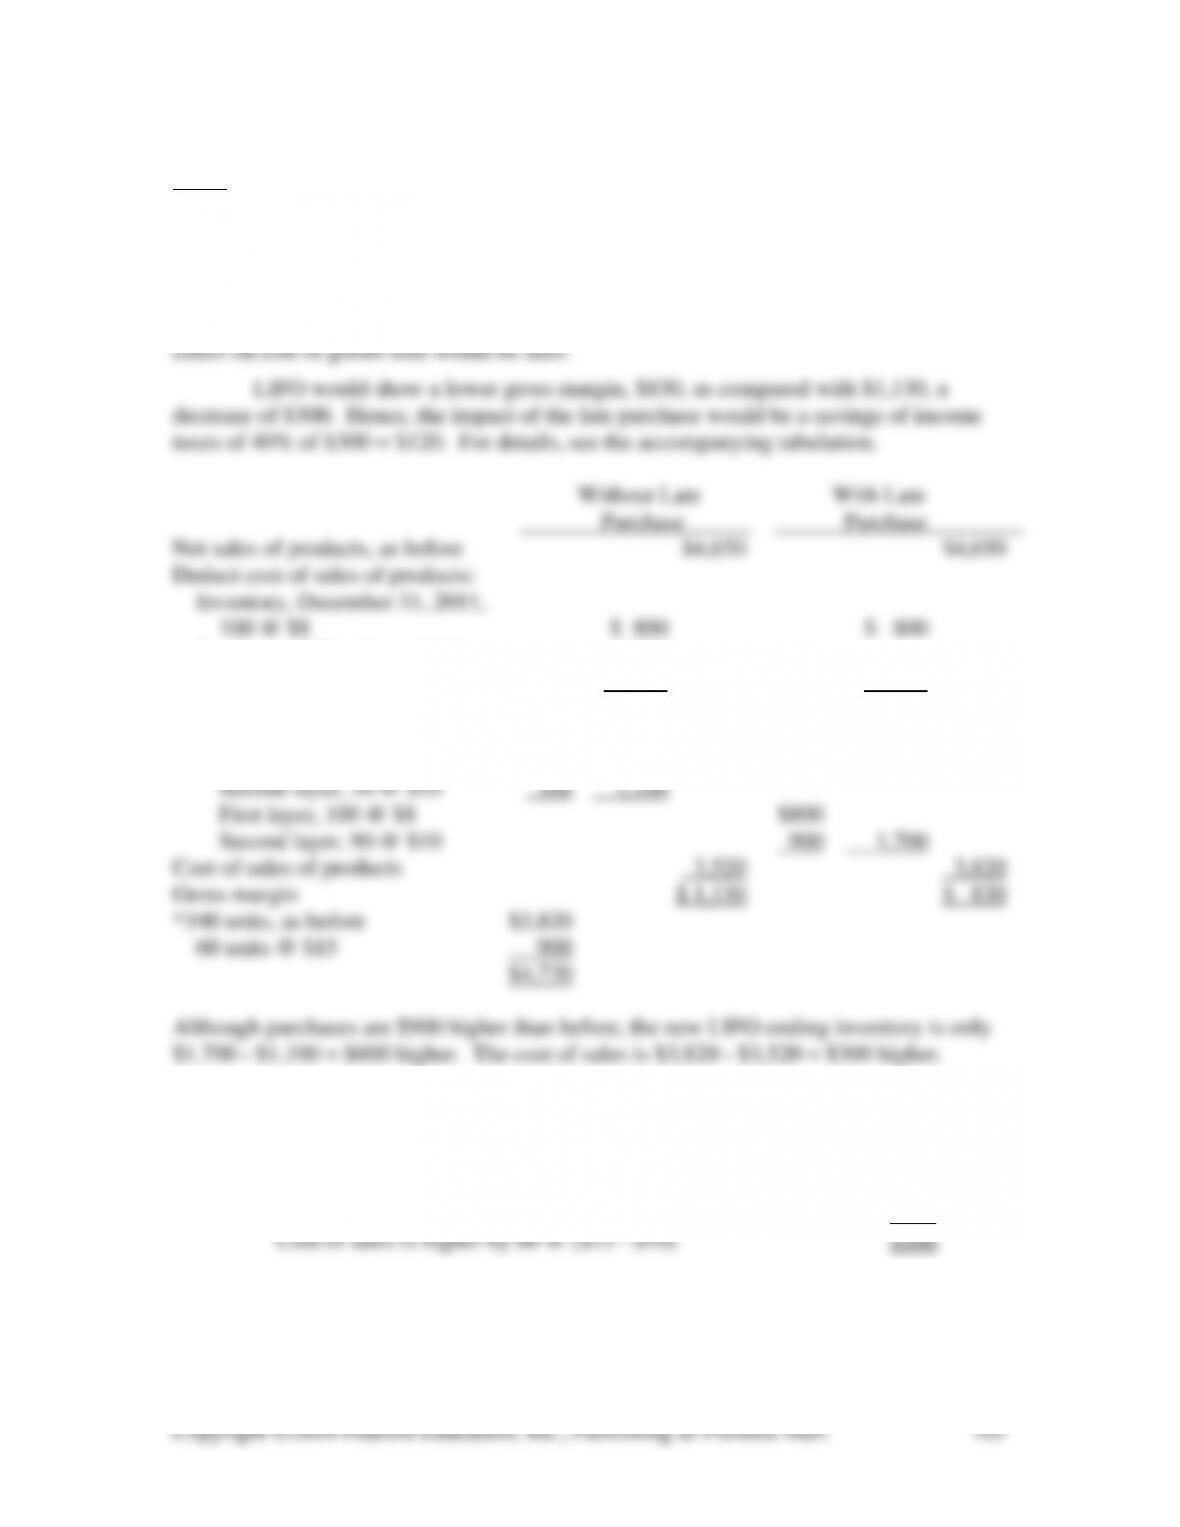
1. Specific
Weighted Identifi-
FIFO LIFO Average cation
Revenue (150 @ $15 + 160 @ $15) $4,650 $4,650 $4,650 $4,650
Deduct cost of revenue:
16-72 (20-30 min.)
This problem explores the effects of LIFO layers.
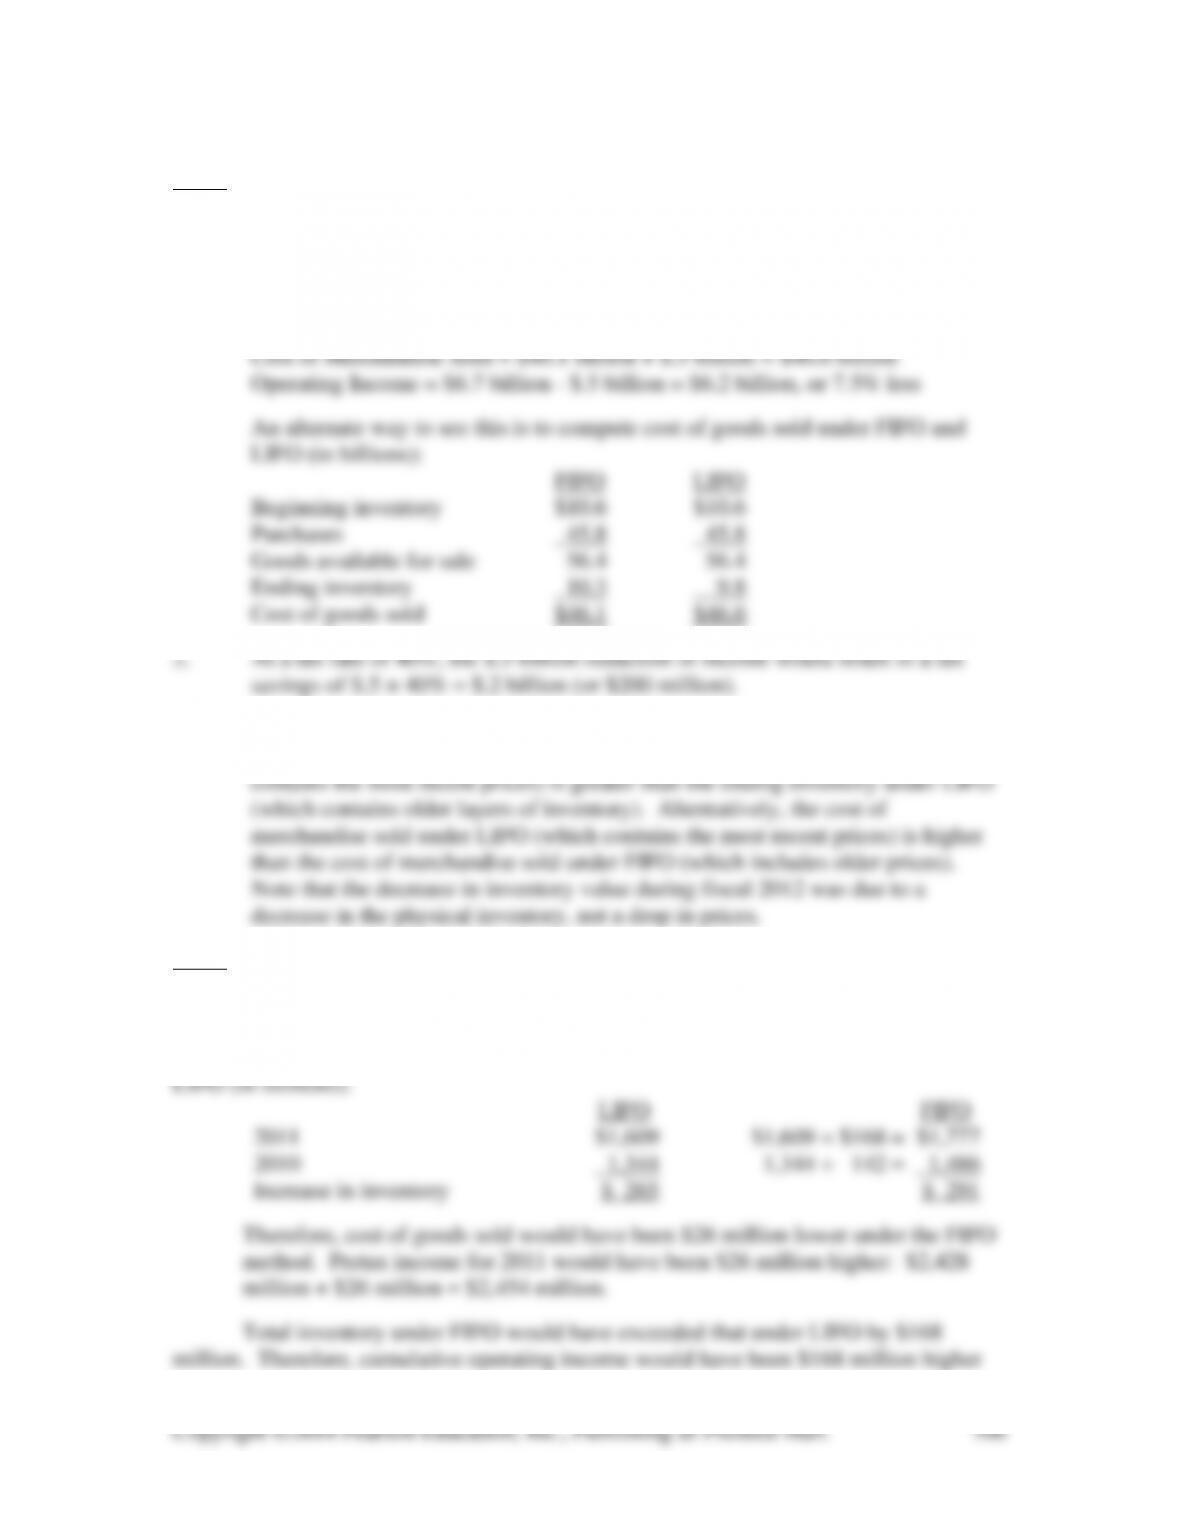
There would be no effect on gross margin, income taxes, or net income under
FIFO. The balance sheet would show a higher inventory by $900. A detailed income
statement would show both purchases and ending inventory as higher by $900, so the net
Purchases, 340 units, as before, 3,820
and 400 units 4,720*
Available for sale $4,620 $5,520
Ending inventory:
First layer ,100 @ $8 $800
To see this another way, compare the ending inventories:
Late purchase added to cost of goods available for
sale: 60 @ $15 $900
Deduct 60-unit increase in ending inventory:
Second layer is 90 – 30 = 60 units higher @ $10 600
16-73 (15 min.)
1. Inventory would have decreased by $.8 billion, from 10.6 billion to $9.8 billion,
under LIFO compared to $.3 billion, from 10.6 billion to 10.3 billion, under
FIFO. Therefore, cost of merchandise sold would have been $.5 billion higher,
and operating income would have been $.5 billion lower under LIFO.
3. Prices were rising during fiscal 2012. The most recent prices must be higher
than the beginning prices because the ending inventory under FIFO (which
16-74 (20 min.)
The inventory method determines how costs will be divided between ending
inventory and cost of goods sold. Under the FIFO method, inventory would have
increased by $26 million (that is, $291 million – $265 million) more than it did under

Copyright ©2014 Pearson Education, Inc., Publishing as Prentice Hall.
707
under FIFO.
16-75 (25-30 min.)
1. Nike’s principal business activity is “the design, development and worldwide
2. Nike’s gross margin increased from $8,800 million in fiscal 2010 to $9,509
4. Nike generated $1,812 million from its operating activities, but it used $1,021
million for investing activities and $1,972 million for financing activities. A little
5. Nike declared dividends on common stock of $1.20 per share or $569 million.
16-76 (30-40 min.) For the solution to this Excel Application Exercise, follow the
step-by-step instructions provided in the textbook chapter.
3. LIFO has the highest cost of goods sold only when prices are rising; when prices
are falling, FIFO has a higher cost of goods sold.
16-77 (30 min.)
The purpose of this exercise is to learn which accounts belong to the income
account.
16-78 (15-25 min.) NOTE TO INSTRUCTOR: This solution is based on the web site
1. Lowe’s calls its income statement a “Consolidated Statement of Earnings.” It
uses a multiple-step format, with subtotals for gross margin, total expenses, and
2. Lowe’s largest current asset is merchandise inventory at $8,355 million, and its
largest current liability is accounts payable at $4,352 million. This is a common
3. Lowe’s retained earnings is its largest stockholders’ equity account, comprising
4. Lowe’s cash flow from operations is $4,349 million – $1,839 million = $2,510
million more than its net income. The main factor explaining this is the add-back
5. Lowe’s spent more ($1,829 million) for fixed assets than it charged in