13-63 (25-30 min.)
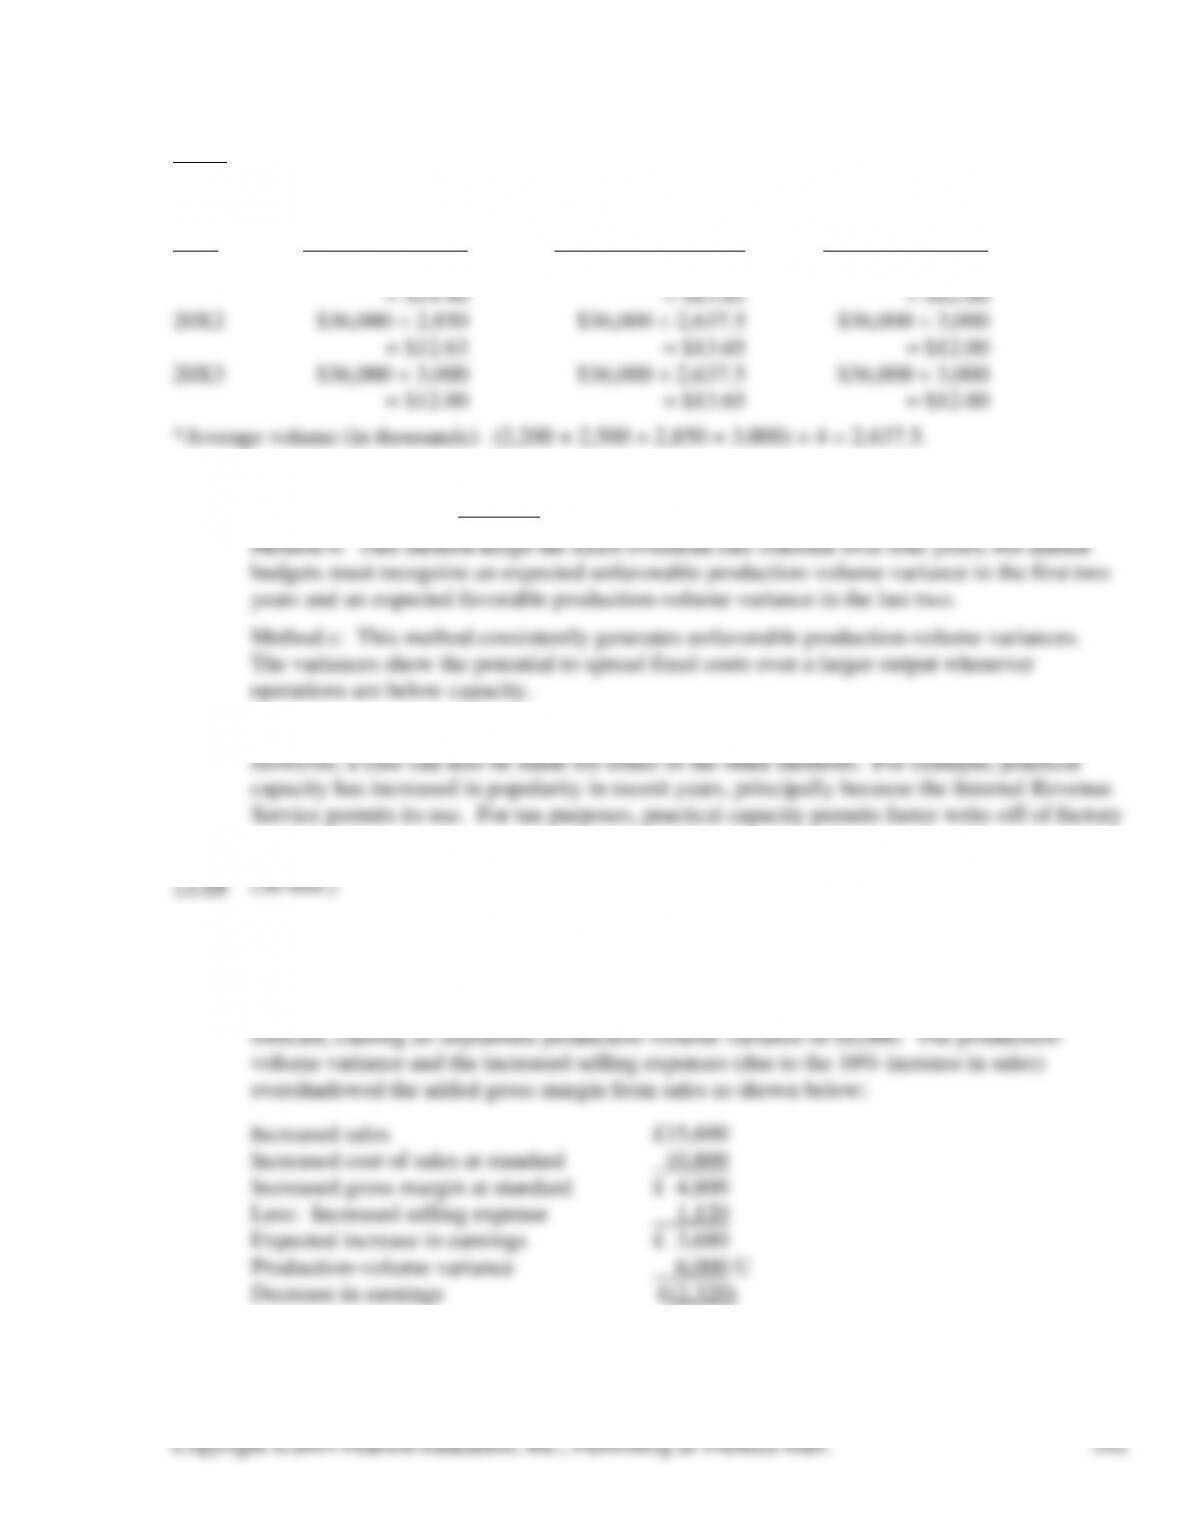
1. Total dollars and machine hours are in thousands:
Year Base a Base b* Base c
20X1 $36,000 ÷ 2,500 $36,000 ÷ 2,637.5 $36,000 ÷ 3,000
2. Method a: This is the most popular method. It keeps the fixed-overhead rate constant over a
year and generates no expected production-volume variance for the year in total.
3. Most students will prefer Method a because the text indicates that it is most popular.
overhead.
1. Because Leeds Tool Company uses absorption costing, the net income is influenced by both
sales volume and production volume. Sales volume was increased in the November 30, 20X0
forecast, and at standard gross profit rates this would increase gross margin before taxes by
£4,800. However, during the same period production volume was below the January 1, 20X0
2. The basic cause of the lower forecast of profits is low production. If raw materials can be
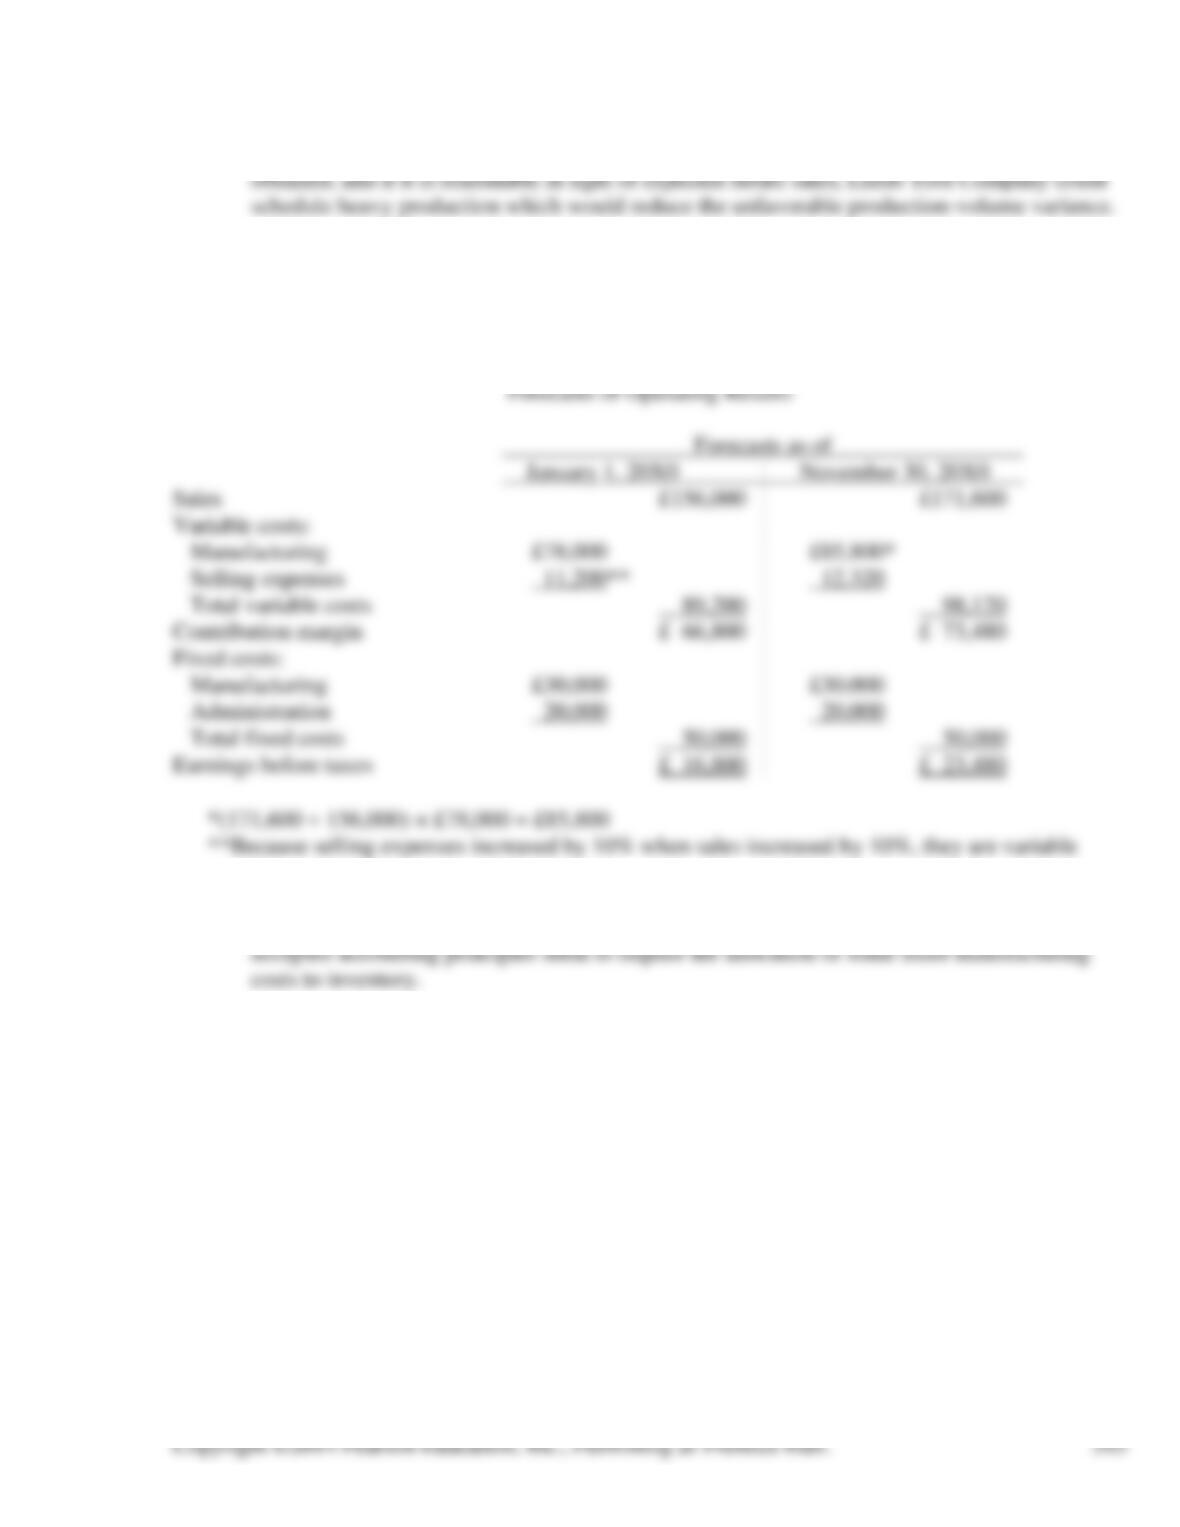
3. Leeds Tool Company could adopt variable costing. Then fixed manufacturing costs would be
treated as period costs and would not be assigned to production. Consequently, earnings
would not be affected by production volume but only by sales volume. The following
statements are prepared on a variable-costing basis.
LEEDS TOOL COMPANY
costs.
4. Variable costing would not be acceptable for financial reporting purposes because generally
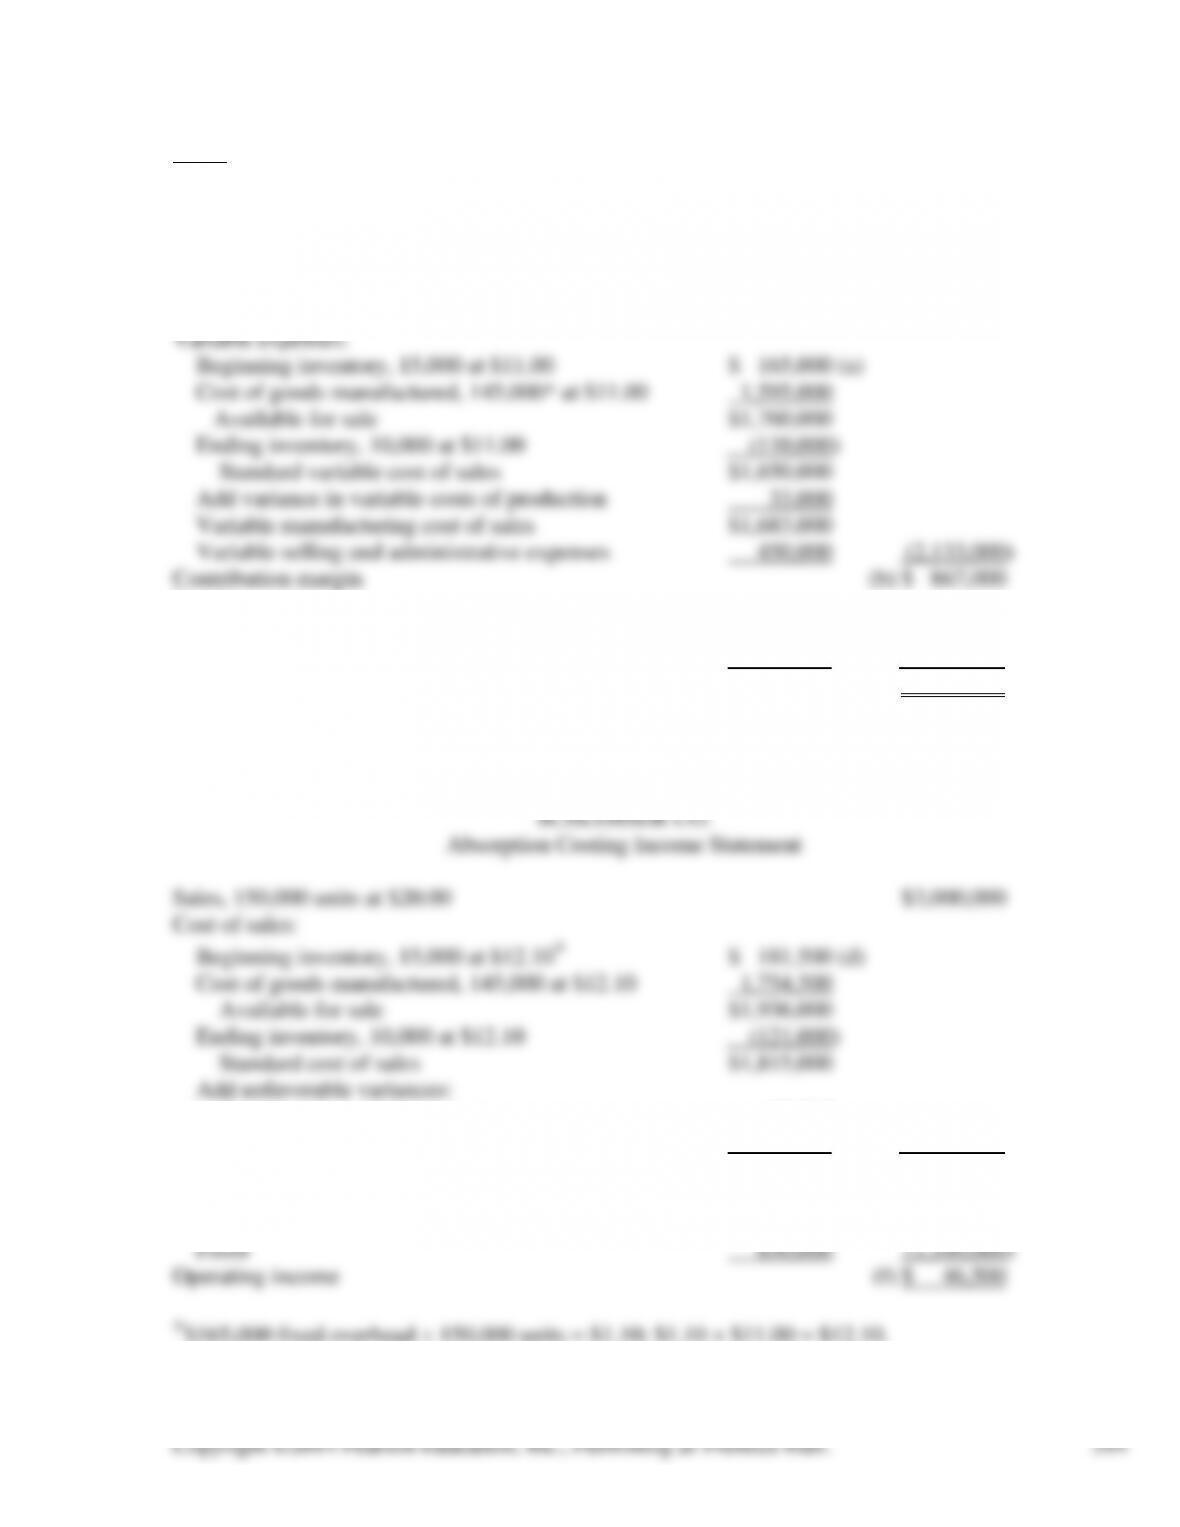
13-65 (30-40 min.) The unknowns, labeled a through f, are indicated in the following variable-
costing and absorption-costing income statements.
SCHLOSSER CO.
Variable Costing Income Statement
Sales, 150,000 units at $20.00 $3,000,000
Fixed expenses:
Manufacturing $ 165,000
Selling and administrative 650,000 (815,000)
Operating income (c) $ 52,000
*Production = sales – decrease in inventory = 150,000 – 5,000 = 145,000 units
Variable manufacturing costs 33,000
Prod.-volume variance, 5,000 at $1.10 5,500 (1,853,500)
Gross margin (e) $1,146,500
Selling and administrative expenses:
Variable, 150,000 at $3.00 $ 450,000
13-66 (20-30 min.)
1. (in thousands)
a. b.
2. a. Ending inventory, Method (a): 19,500 units × $15 = $292,500
b. Ending inventory, Method (b): (19,500 units × $15) + (19,500 ÷ 97,500) × $42,000 =
3. Supporters of Method (a) claim that variances arise from inefficiencies or efficiencies of the
period and therefore should affect the current period’s income statement. They are not
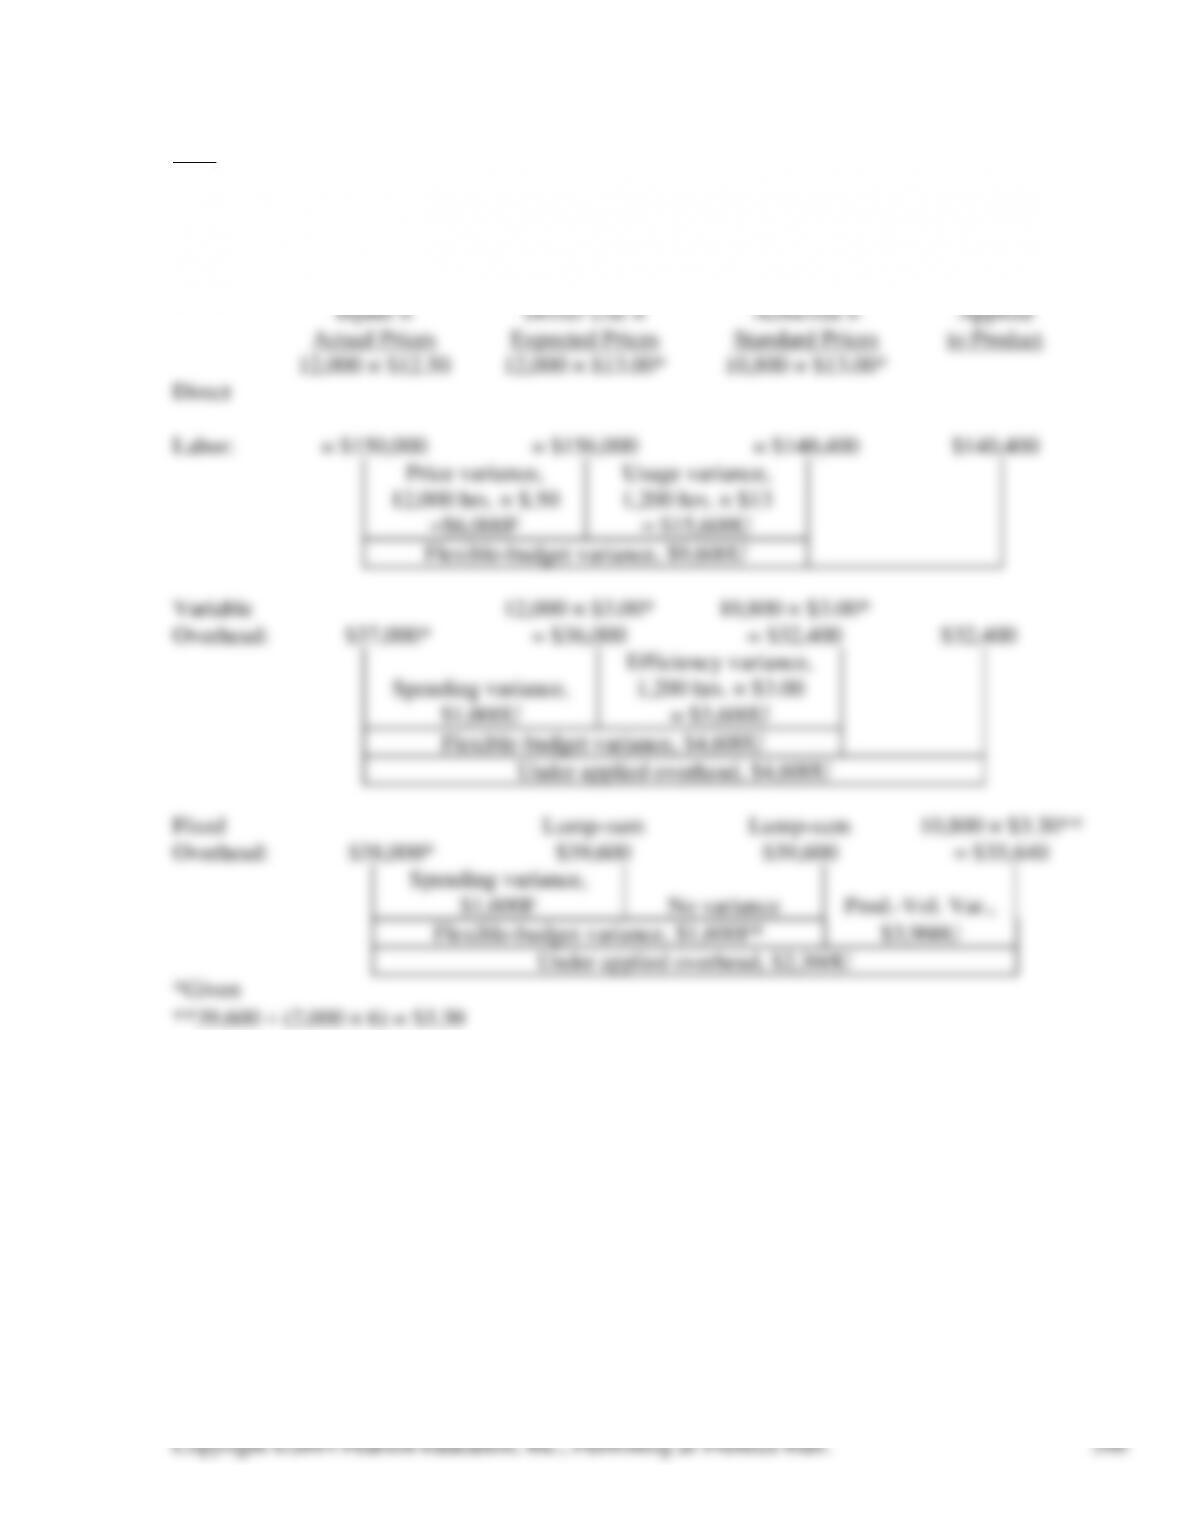
13–67 (35–45 min.)
Cost Incurred:
Actual
Inputs ×
Actual Prices
Predicted
Overhead
Based on Actual
Driver Use ×
Expected Prices
Flexible Budget:
Standard Driver
Use Allowed for
Actual Output
Achieved ×
Standard Prices
Product
Costing
Applied
to Product
Direct
12,000 × $12.50
12,000 × $13.00*
10,800 × $13.00*
Labor:
= $150,000
= $156,000
= $140,400
$140,400
Price variance,
Usage variance,
12,000 hrs. × $.50
=$6,000F
1,200 hrs. × $13
= $15,600U
Flexible-budget variance, $9,600U
Variable
12,000 × $3.00*
10,800 × $3.00*
Overhead:
$37,000*
= $36,000
= $32,400
$32,400
Efficiency variance,
Spending variance,
$1,000U
1,200 hrs. × $3.00
= $3,600U
Flexible-budget variance, $4,600U
Under applied overhead, $4,600U
Fixed
Lump-sum
Lump-sum
10,800 × $3.30**
Overhead:
$38,000*
$39,600
$39,600
= $35,640
Spending variance,
$1,600F
No variance
Prod.-Vol. Var.,
Flexible-budget variance, $1,600F*
$3,960U
Under applied overhead, $2,360U
*Given
**39,600 (2,000 × 6) = $3.30
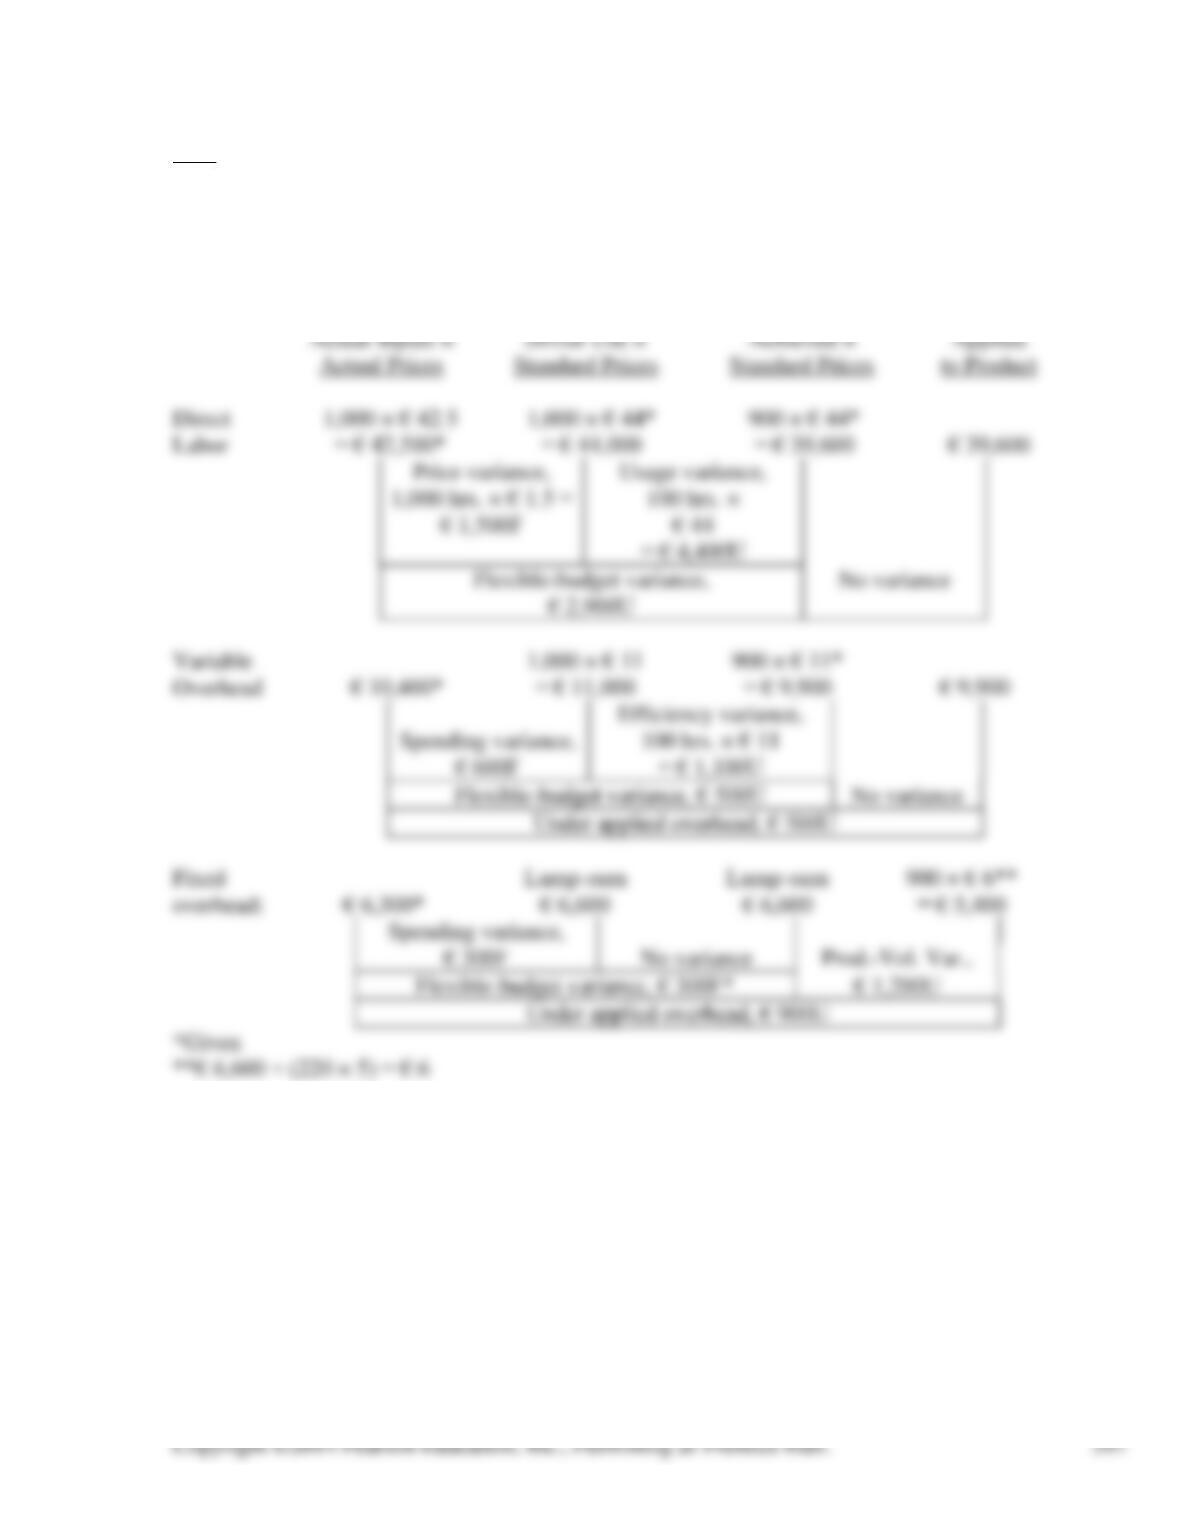
13–68 (35–40 min.)
Cost Incurred:
Actual Inputs ×
Actual Prices
Predicted
Overhead
Based on Actual
Driver Use ×
Standard Prices
Flexible Budget:
Standard Driver
Use Allowed for
Output
Achieved ×
Standard Prices
Product
Costing
Applied
to Product
Direct
1,000 × € 42.5
1,000 × € 44*
900 × € 44*
Labor
= € 42,500*
= € 44,000
= € 39,600
€ 39,600
Price variance,
Usage variance,
1,000 hrs. × € 1.5 =
€ 1,500F
100 hrs. ×
€ 44
= € 4,400U
Flexible-budget variance,
€ 2,900U
No variance
Variable
1,000 × € 11
900 × € 11*
Overhead
€ 10,400*
= € 11,000
= € 9,900
€ 9,900
Efficiency variance,
Spending variance,
€ 600F
100 hrs. × € 11
= € 1,100U
Flexible-budget variance, € 500U
No variance
Under applied overhead, € 500U
Fixed
Lump-sum
Lump-sum
900 × € 6**
overhead:
€ 6,300*
€ 6,600
€ 6,600
= € 5,400
Spending variance,
€ 300F
No variance
Prod.-Vol. Var.,
Flexible-budget variance, € 300F*
€ 1,200U
Under applied overhead, € 900U
*Given
**€ 6,600 ÷ (220 × 5) = € 6
Copyright ©2014 Pearson Education, Inc., Publishing as Prentice Hall.
598
13-69 (15-20 min.)
1. Factory Overhead
Activity Costs Applied
1. 1 × $ 1.20 = $ 1.20
2. 39 × .07 = 2.73
2. Direct labor is no longer traced separately via time tickets to individual products. Instead, it
3. Managers would primarily favor this multiple overhead rate, activity-based costing system
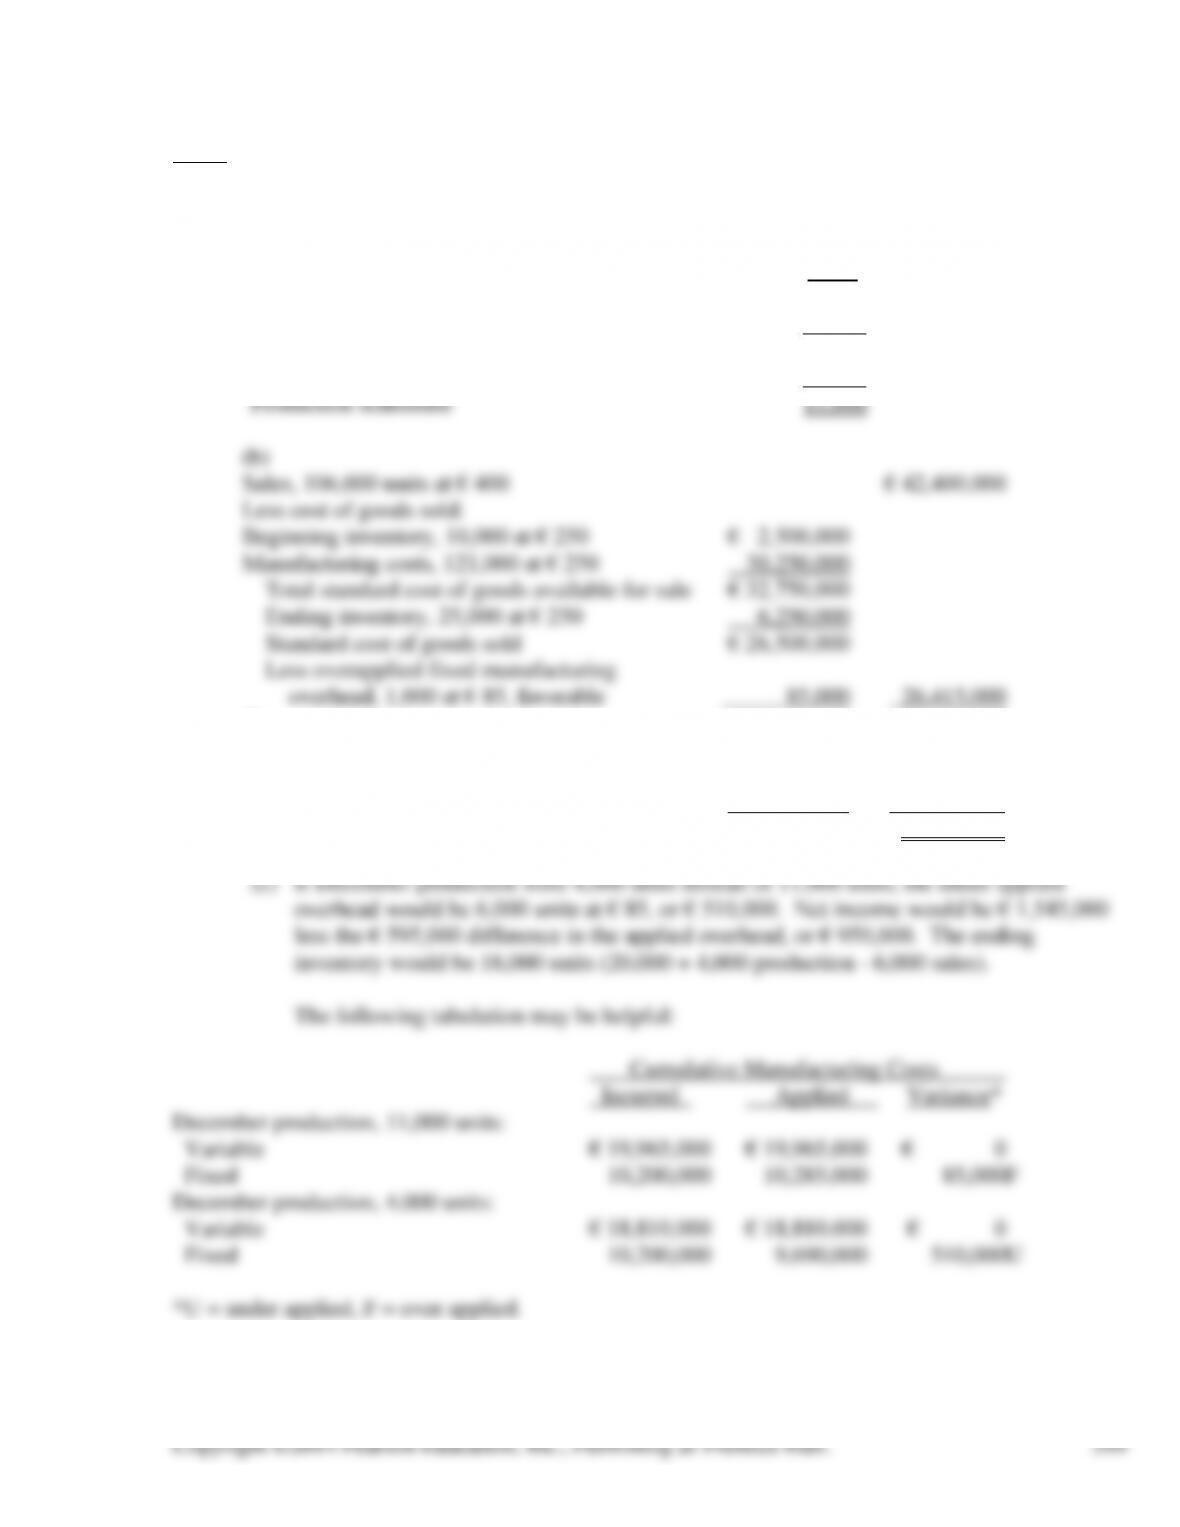
13-70 (40-60 min.) Note that € is the symbol for the Euro.
1. (a) The division manager would want to build inventory and thereby maximize current
income:
Units
Desired ending inventory, maximum possible 25,000
December sales 6,000
Total needs 31,000
November 30 inventory, 110,000 + 10,000 – 100,000 20,000
Gross margin 15,985,000
Other expenses:
Variable, 106,000 at € 40 € 4,240,000
Fixed 10,200,000 14,440,000
Operating income € 1,545,000
2. (a)(b)
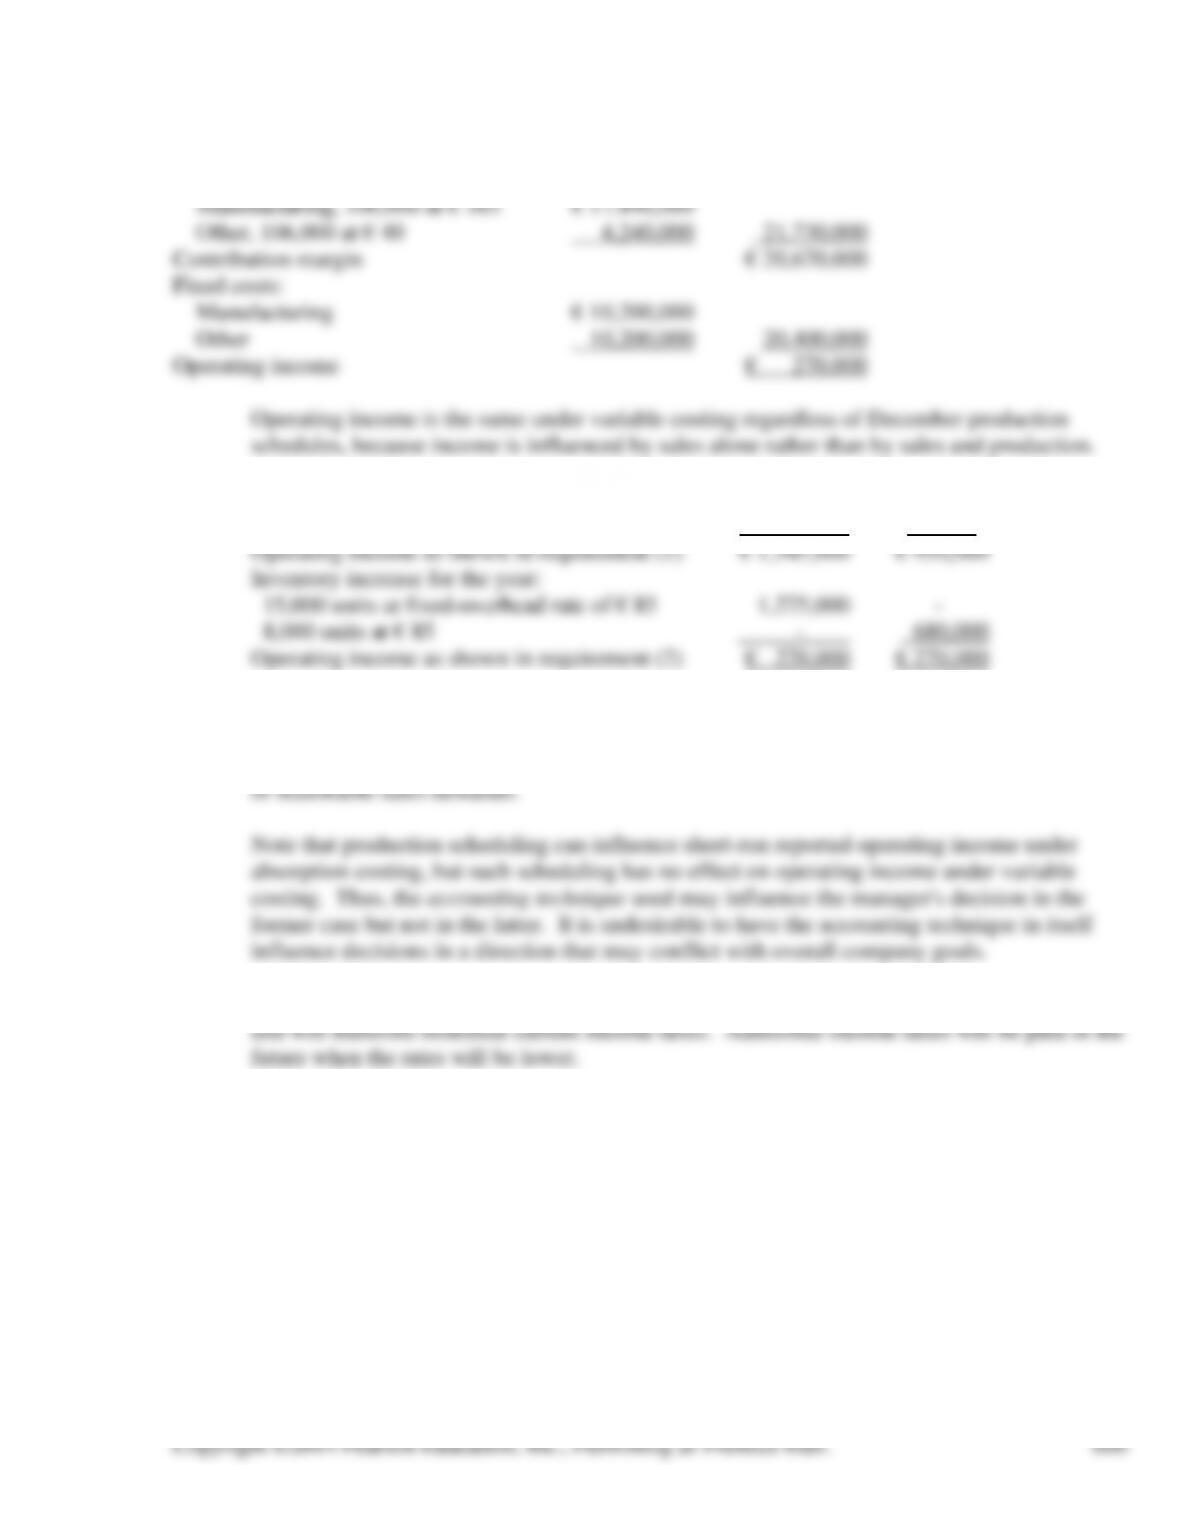
Sales, 106,000 units at € 400 € 42,400,000
Variable costs:
2. (c)
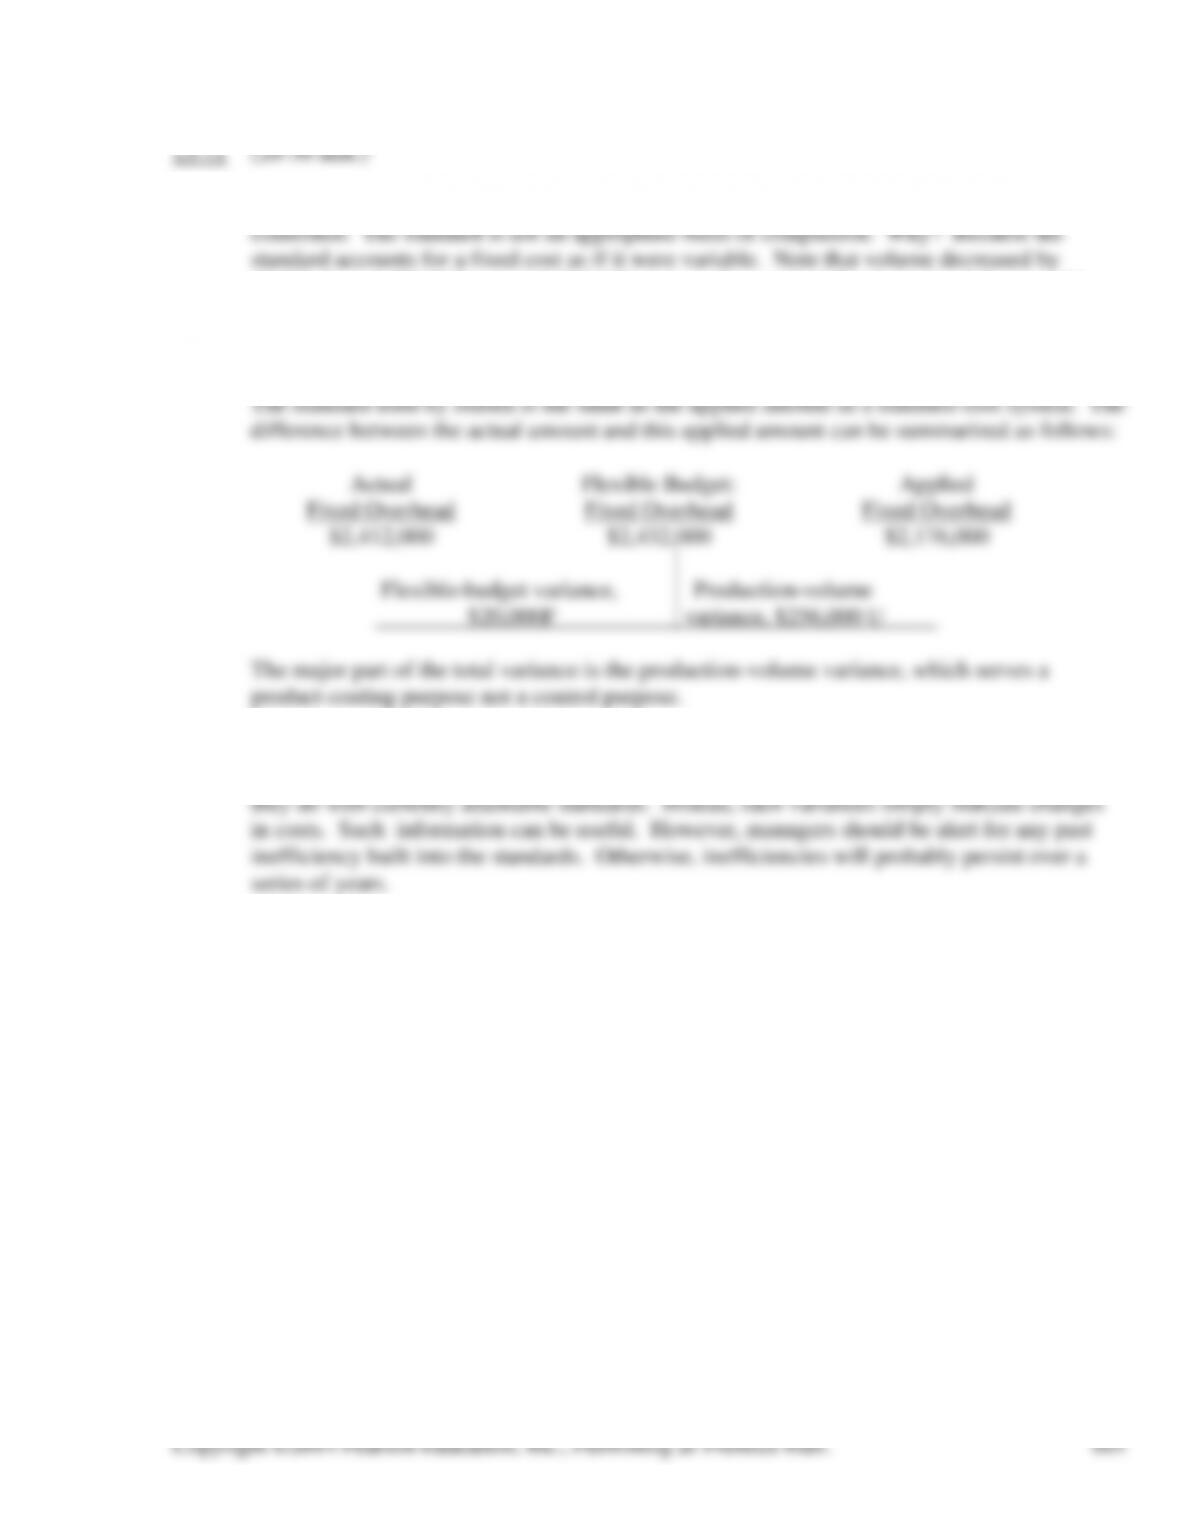
December production schedule, units 11,000 4,000
3. The division manager should set the minimum production schedule of 4,000 units. This will
reduce the inventories by 2,000 units. She may be tempted to ask for permission to reduce
production even below 4,000 units, because the outlook is for ending inventories far in excess
4. 4,000 units should be scheduled in December. This will minimize income for the current year
Copyright ©2014 Pearson Education, Inc., Publishing as Prentice Hall.
601
13-71 (20-30 min.)
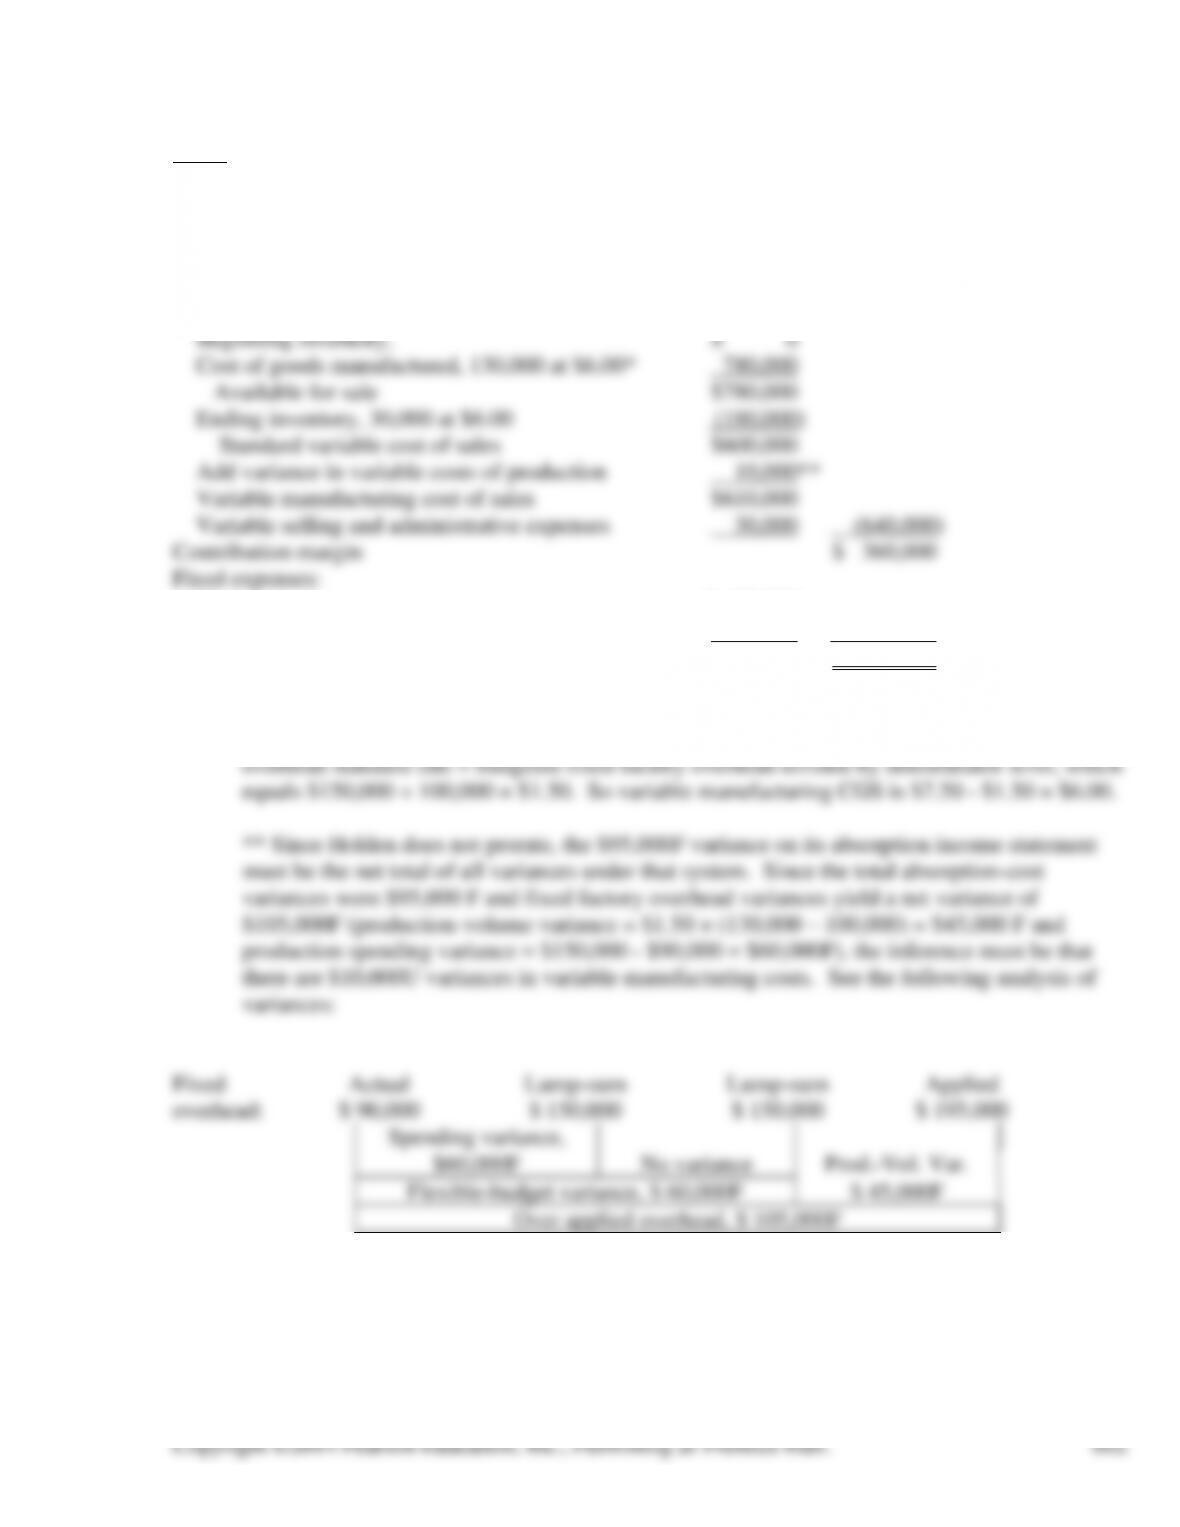
1. The fixed overhead variance does not reveal how well fixed overhead costs have been
10.5%, from 1,520,000 cwt. to 1,360,000 cwt., so the standard fixed overhead decreased by
10.5%, from $2,432,000 to $2,176,000. But fixed overhead would not be expected to change.
The flexible (control) budget for fixed overhead, based on 20X0 costs, is $2,432,000. From a
control perspective, there was a $2,432,000 – $2,412,000 = $20,000F variance.
2. Setting standards based on last year’s costs is not uncommon. Managers must carefully
interpret the resulting variances. Such variances do not necessarily measure efficiency, as
13-72 (25-35 min.)
HOLDEN CORP.
Variable Costing Income Statement
Sales, 100,000 units at $10.00 $1,000,000
Variable expenses:
Manufacturing $ 90,000
Selling and administrative 170,000 (260,000)
Operating income $ 100,000
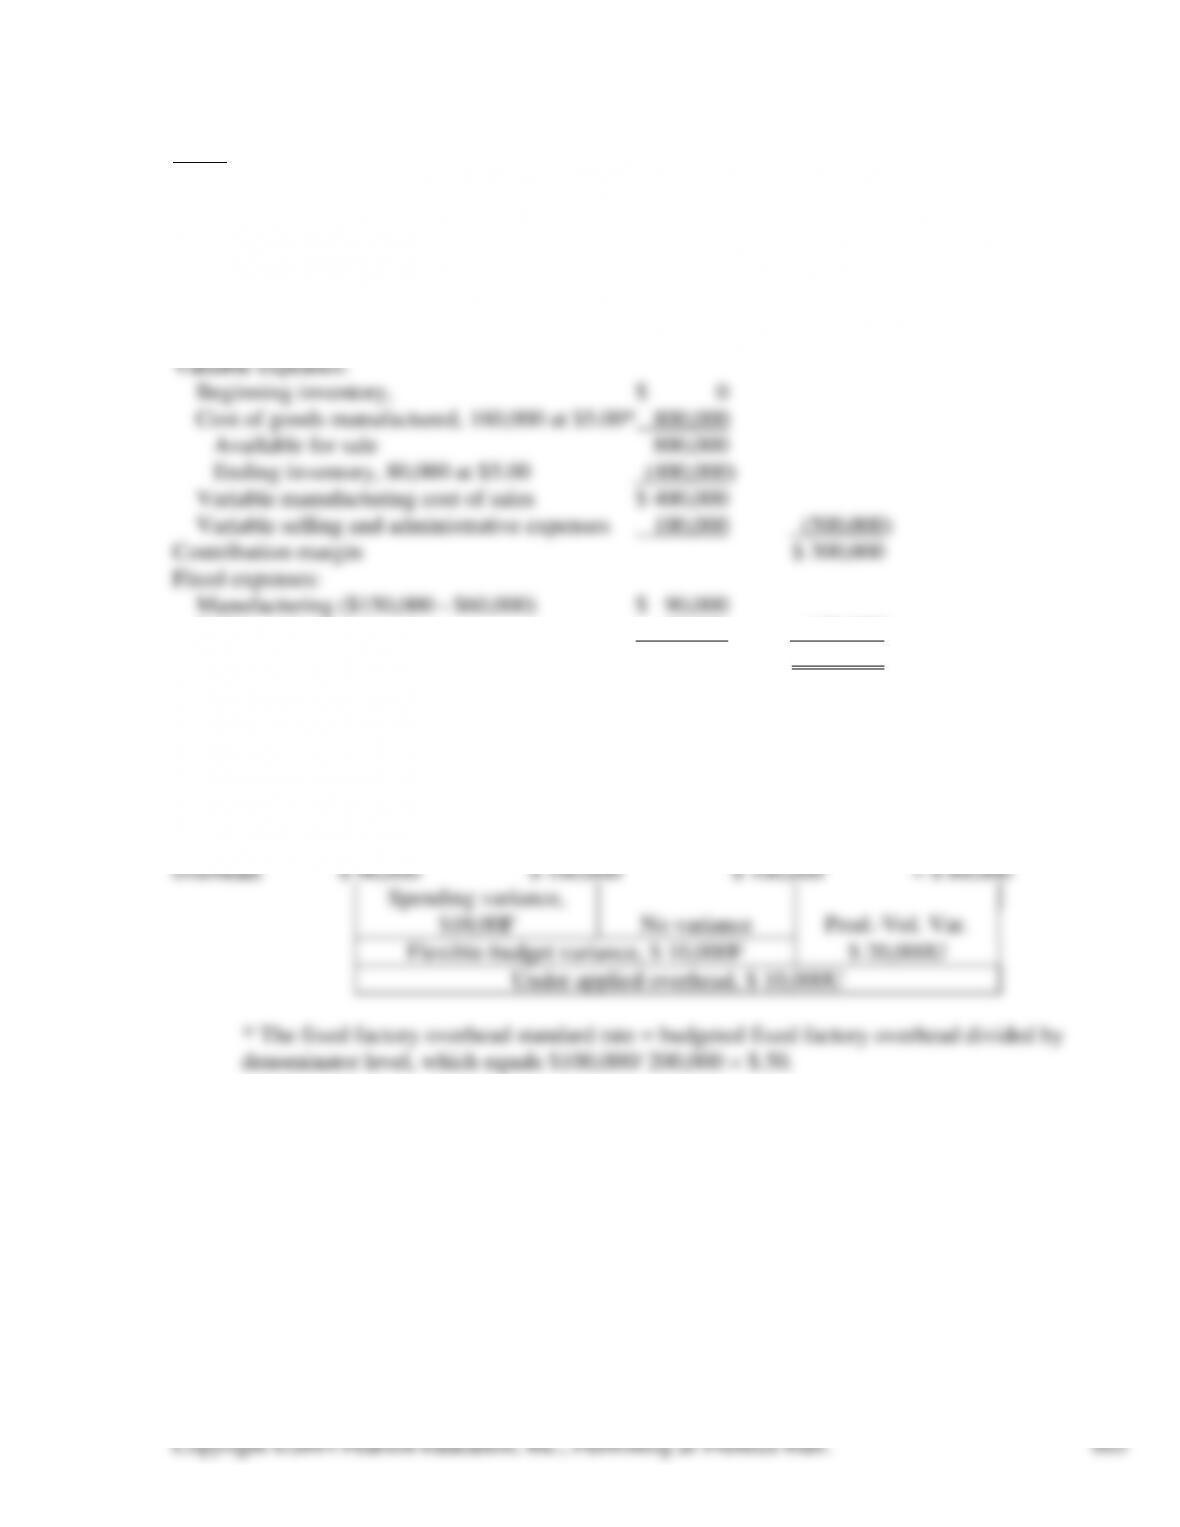
* Variable manufacturing CGS = standard absorption CGS – the fixed factory overhead rate.
The standard absorption CGS is $750,000 ÷ 100,000 units sold = $7.50. The fixed factory
13-73 (25-35 min.)
First, it is helpful to determine the variable-costing income statement:
MOSELEY CORP.
Variable Costing Income Statement
Sales, 80,000 units at $10.00 $ 800,000
Selling and administrative 60,000 (150,000)
Operating income $ 150,000
* The variable manufacturing CGS is $400,000 ÷ 80,000 units sold = $5.00.
Next, analyze the fixed overhead:
Fixed
Actual
Lump-sum
Lump-sum
Applied
160,000 × $ .50*
overhead:
$ 90,000
$ 100,000
$ 100,000
= $ 80,000
Spending variance,
$10,00F
No variance
Prod.-Vol. Var.
Flexible-budget variance, $ 10,000F
$ 20,000U
Under applied overhead, $ 10,000U
* The fixed factory overhead standard rate = budgeted fixed factory overhead divided by
denominator level, which equals $100,000/ 200,000 = $.50.
Copyright ©2014 Pearson Education, Inc., Publishing as Prentice Hall.
604
MOSELEY CORP.
Absorption Costing Income Statement
Sales, 80,000 units at $10.00 $ 800,000
Cost of sales:
Beginning inventory, $ 0
Cost of goods manufactured, 160,000 at $5.50* 880,000
Available for sale 880,000
Ending inventory, 80,000 at $5.50 (440,000)
The variable manufacturing CGS is $400,000 ÷ 80,000 units sold = $5.00. So standard
absorption CGS is $5.00 + $.50 = $5.50.
** Since Moseley prorates, half of the $10,000U net variances from fixed factory overhead
goes to CGS, and the other half goes to ending finished goods (they are evenly split between
the two accounts because there is no ending WIP, and each account is worth the same amount,
Copyright ©2014 Pearson Education, Inc., Publishing as Prentice Hall.
605
13-74 (20-25 min.)
1. Umbro makes soccer gear and apparel. A plant that makes soccer gear would have numerous
variable- and fixed-cost resources that are indirect costs and are allocated to the various product types.
A partial list:
Indirect-Cost Resources
Variable Cost
Fixed Cost
Electrical power
Plant depreciation
Overtime labor not dedicated to a specific product line
Equipment depreciation
Temporary labor not dedicated to a specific product line
Supervision salaries
Manufacturing supplies
Regular labor wages
Fuel for equipment such as forklifts
Process and product engineers’ salaries
2. A dedicated production line that makes only soccer shoes would result in several resources
13-75 (20-30 min.) For the solution to this Excel Application Exercise, follow the step-by-step
instructions provided in the textbook chapter.
2. To A: $1,672,000; Overapplied by $282,000.
13-76 (180 min. or more)
The purpose of this exercise is to learn how real companies allocate costs. It involves learning
what costs are included in overhead, how they are categorized, whether cost allocations recognize
cost-behavior patterns, what cost drivers are used for allocation, and the process by which costs are
13-77 (30-40 min.) NOTE TO INSTRUCTOR. This solution is based on the web site as it was in
1. Answers will vary depending on the computer chosen. In the laptop/notebook computers for
home and home office family, there are Inspiron and XPS models. Inspiron notebooks range in
2. The total revenue for Dell was $62.1 billion for the year ended February 3, 2012.
3. From Dell’s 2012 financial statements, the cost of goods sold (cost of revenue) was
$48,260,000,000, selling, general and administrative expenses were $8,524,000,000, and
research, development, and engineering expenses were $856,000,000. Depreciation and
amortization was $936,000,000.