Exhibit 12-47, Part 2
Model 1 Model 2 Model 3
Direct materials:
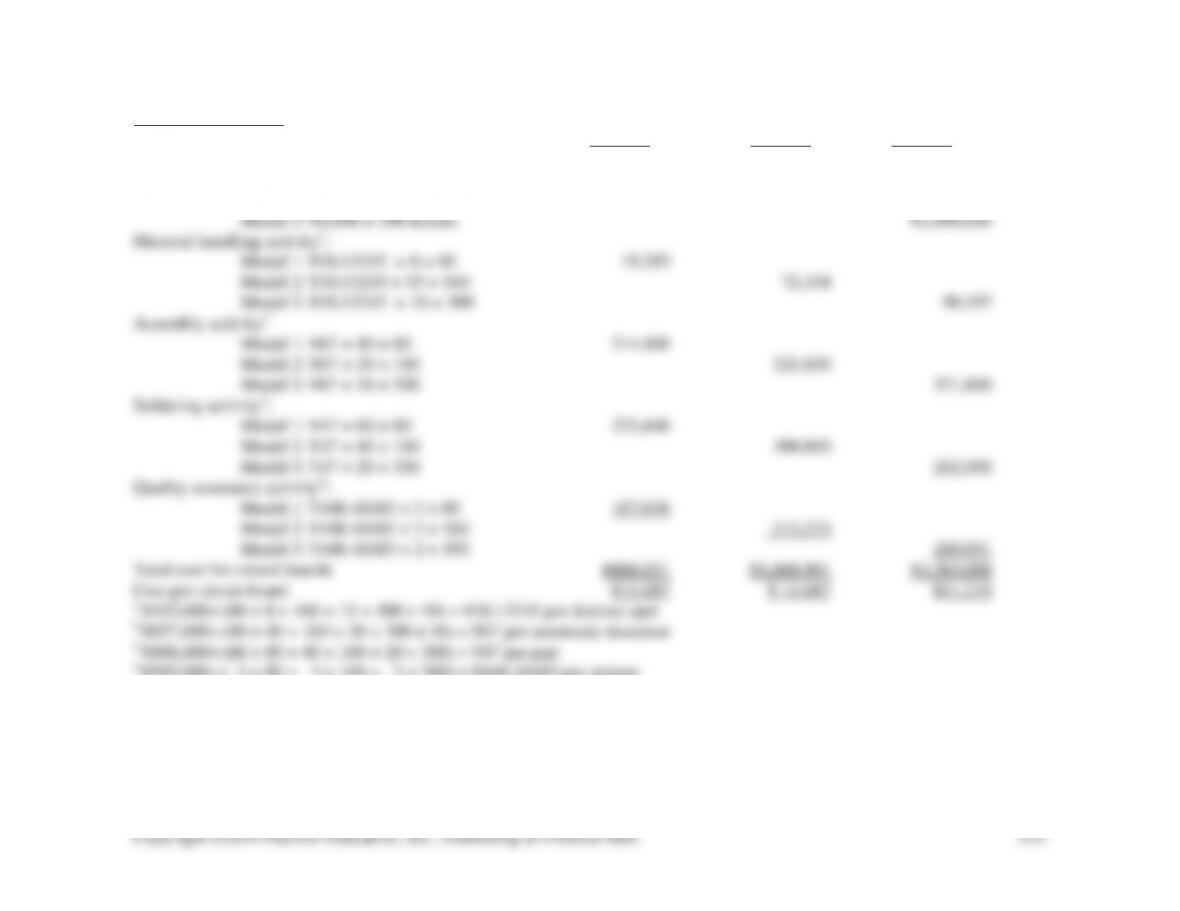
Model 1: ¥4,000 × 80 boards ¥320,000
Model 2: ¥6,000 × 160 boards ¥960,000
Copyright ©2014 Pearson Education, Inc., Publishing as Prentice Hall.
543
12-49 (20 min.)
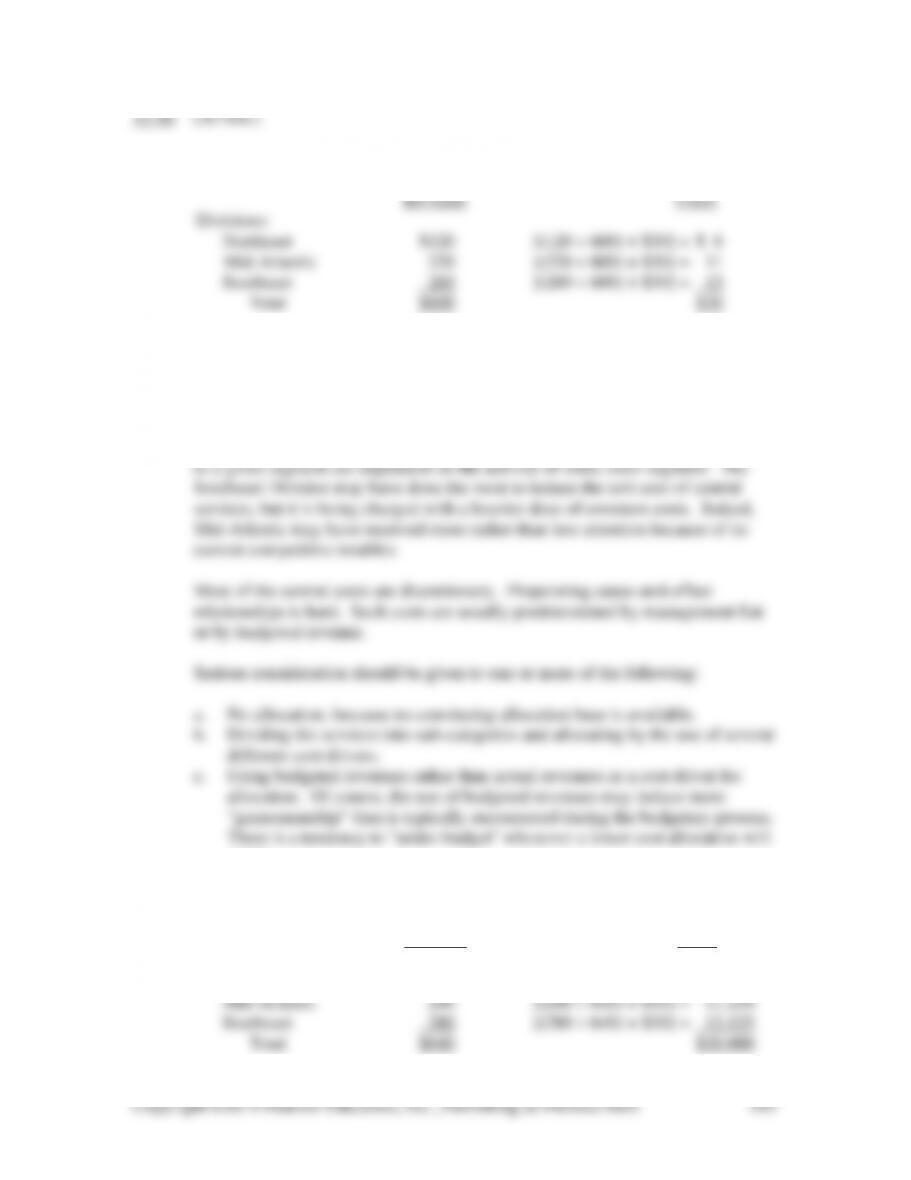
1. Allocations are in millions:
Actual Allocated
2. Northeast’s manager would probably be indifferent, Mid-Atlantic’s would be
pleased, and Southeast’s would be displeased.
The major weakness of using revenue as a basis for cost allocation is that it often
fails to portray underlying cause-and-effect relationships. The major point of
this problem is to show how strange results occur when the costs being allocated
result.
3. Allocations are in millions:
Budgeted Allocated
Revenue Costs
Divisions:
Northeast $120 [(120 ÷ 640) × $30] = $ 5.625
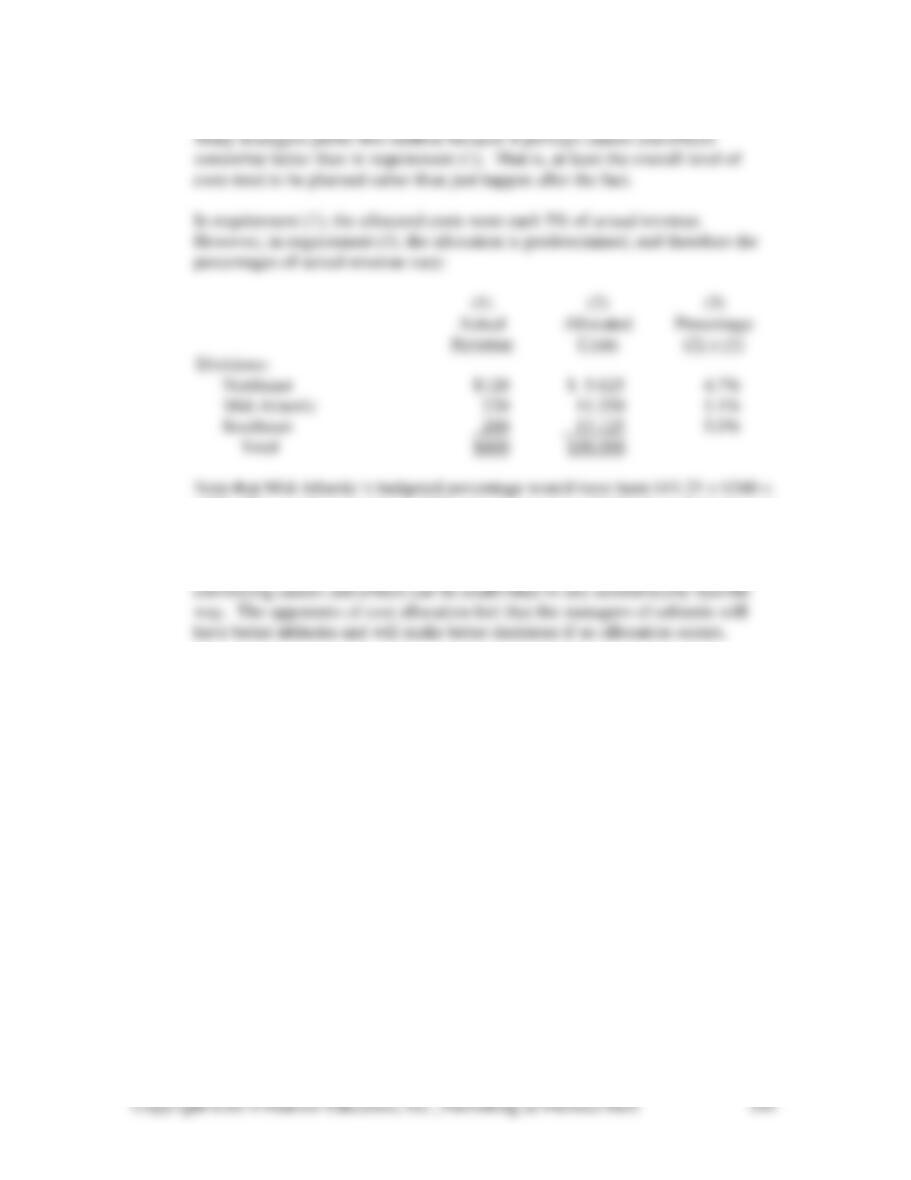
4.7%. The resultant deviation of the actual percentage (5.1%) from the budgeted
percentage (4.7%) would highlight the effects of Mid-Atlantic’s troubles.
4. Many accountants and managers oppose allocating any central costs when no
Copyright ©2014 Pearson Education, Inc., Publishing as Prentice Hall.
545
12-50 (20-40 min.)
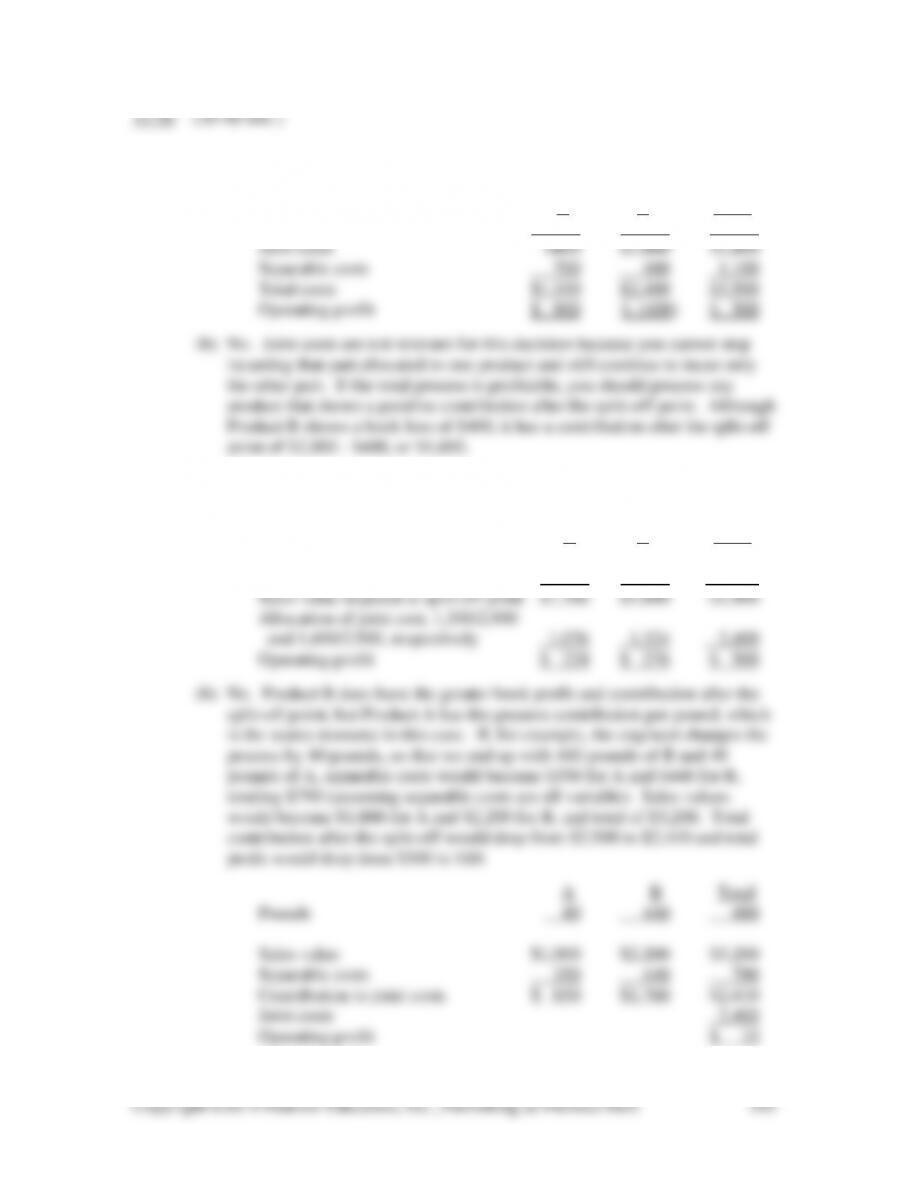
1. (a) The allocation of joint costs would be in a 1:5 ratio:
Product Product
A B Total
Sales value $2,000 $2,000 $4,000
2. (a) The relative sales value method deducts separable costs to arrive at an
imputed sales value at split-off point:
A B Total
Sales value $2,000 $2,000 $4,000
Separable costs 700 400 1,100
12-51 (100 – 200 min.)
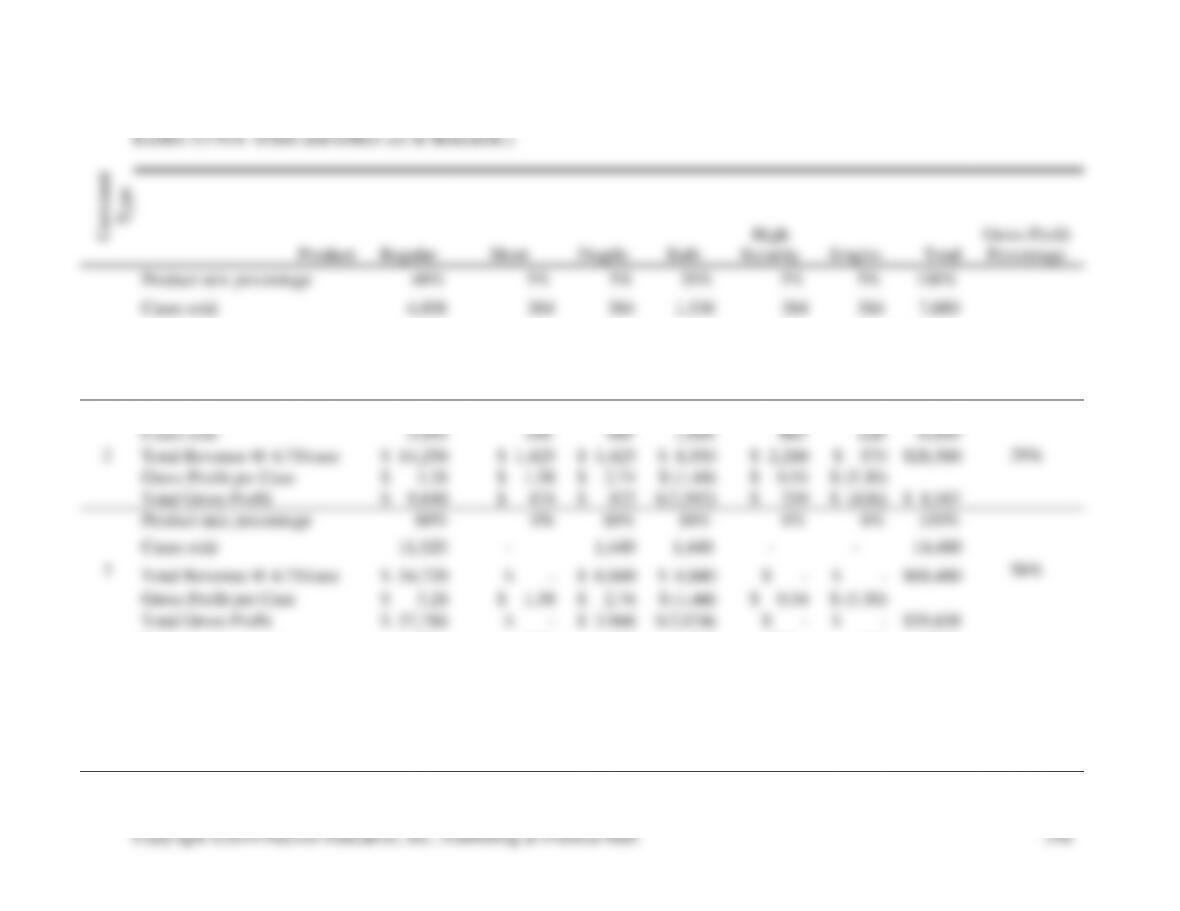
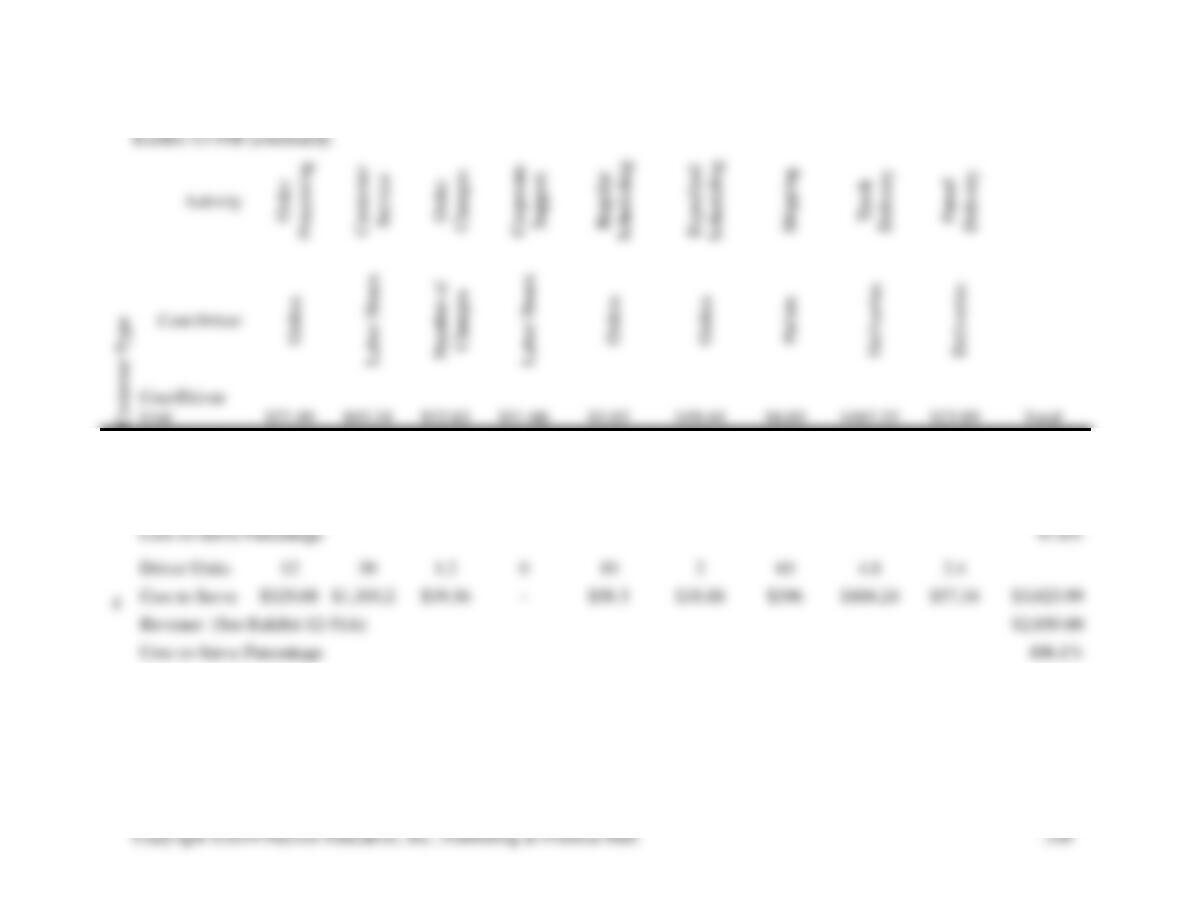
1. Exhibits 12-51A and 12-51B show the calculation of customer gross margin
2. Suggested strategies for profit improvement for the 4 customer types follow.
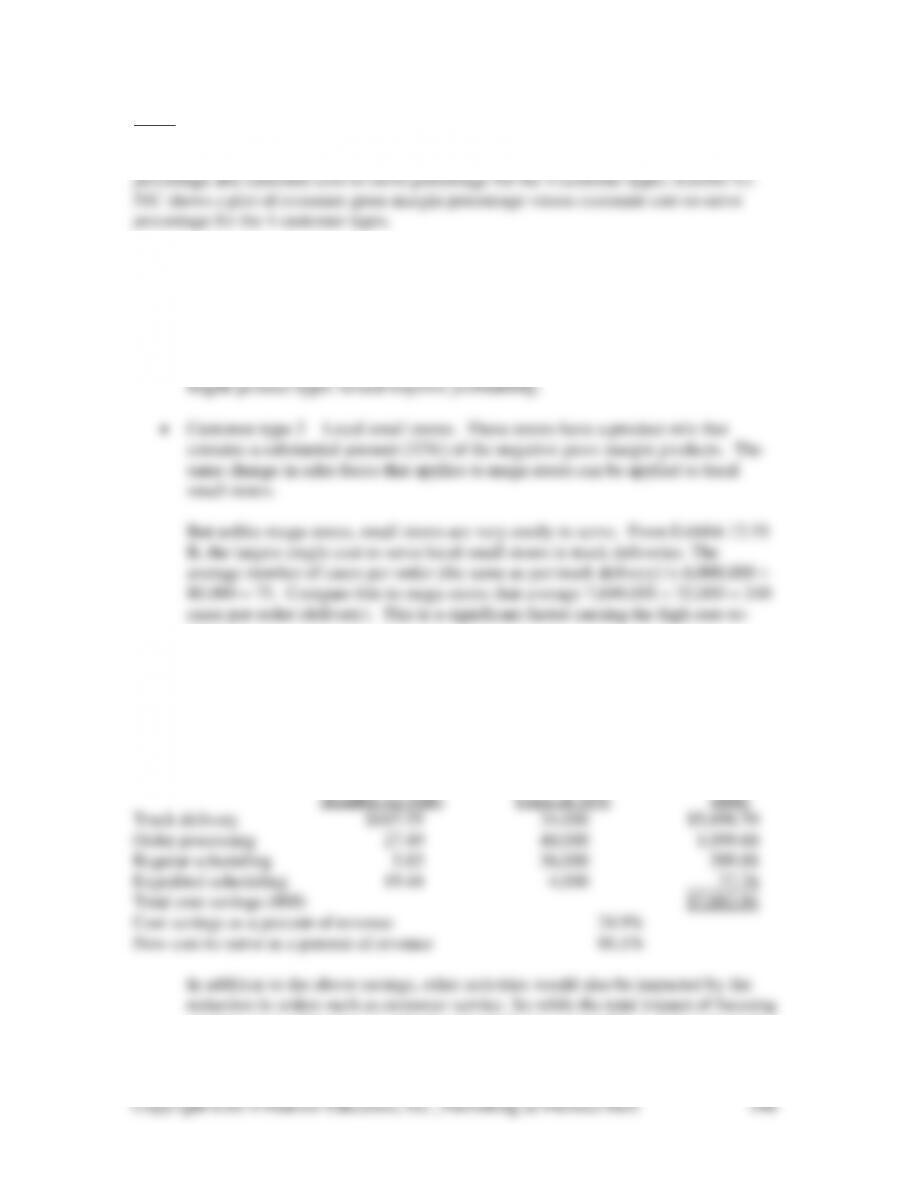
• Customer type 1 – Mega stores. These stores have the lowest cost-to-serve.
Profitability can be improved by focusing on a better product mix. A quarter of
the sales (cases) to these stores are from bulk and singles products – both of
which have a negative gross margin. A shift in mix towards more regular and
serve.
For example, suppose that the average order size could be increased from 75,000
to 150,000 cases. If the total annual cases sold is unchanged (6,000,000), a total of
40 orders, a 50% reduction, would be made. An estimate of the cost savings and
the impact on the cost-to-serve percentage can be made as follows:
Cost per Driver Unit Reduction in Driver Cost Savings
on increasing order size can only be estimated, it is reasonable to expect dramatic
cost savings from the current 85% of revenue.
Other factors that should be investigated include the high level of corporate
support and customer service.
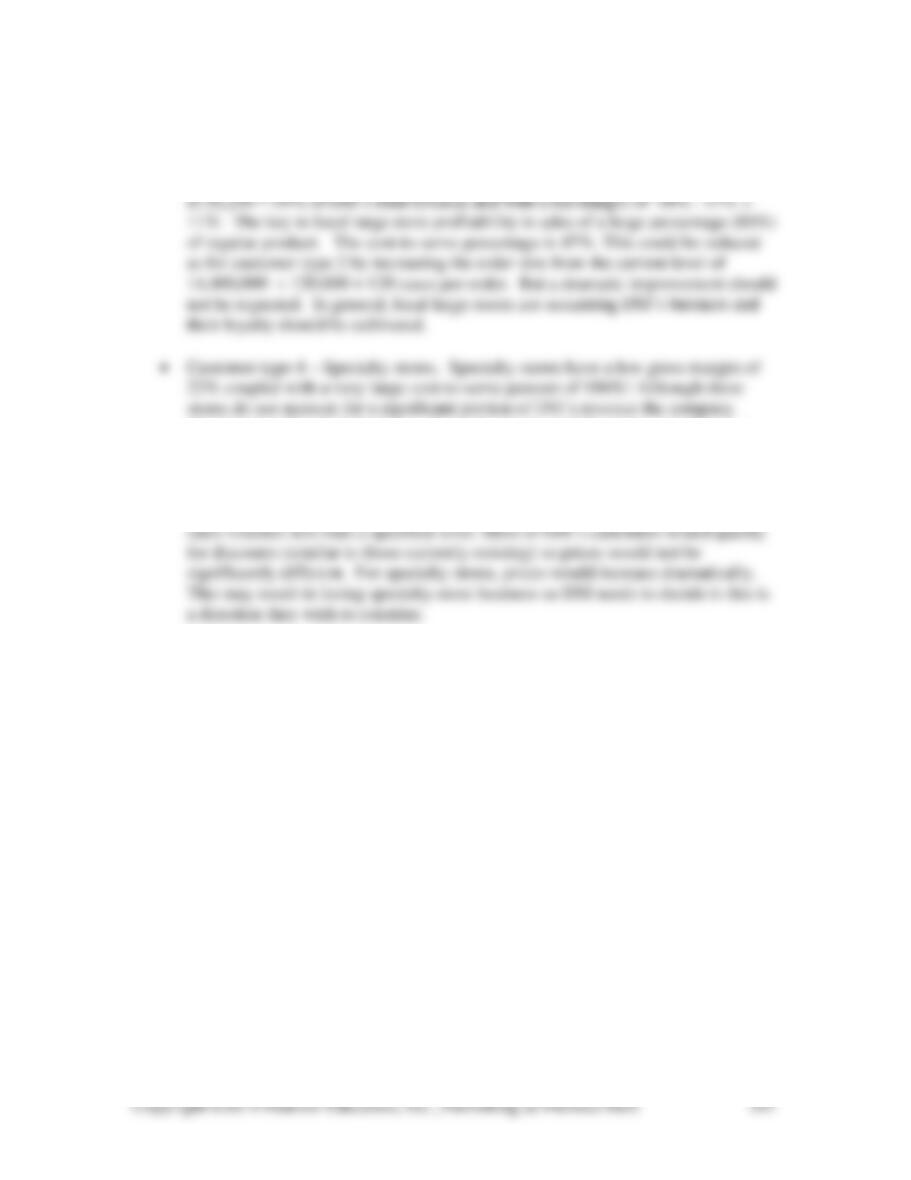
• Customer type 3 – Local large stores. Local large stores generate $68,400 ÷
should rationalize their business. Several actions could be suggested. One is to
charge a premium for all high-security products. The vast majority of these
products are sold to specialty stores with only marginal sales to mega and local
small stores. Another action is to adopt a customer loyalty program based on
volume of sales. The list price of $7.25 per case would apply to customers with
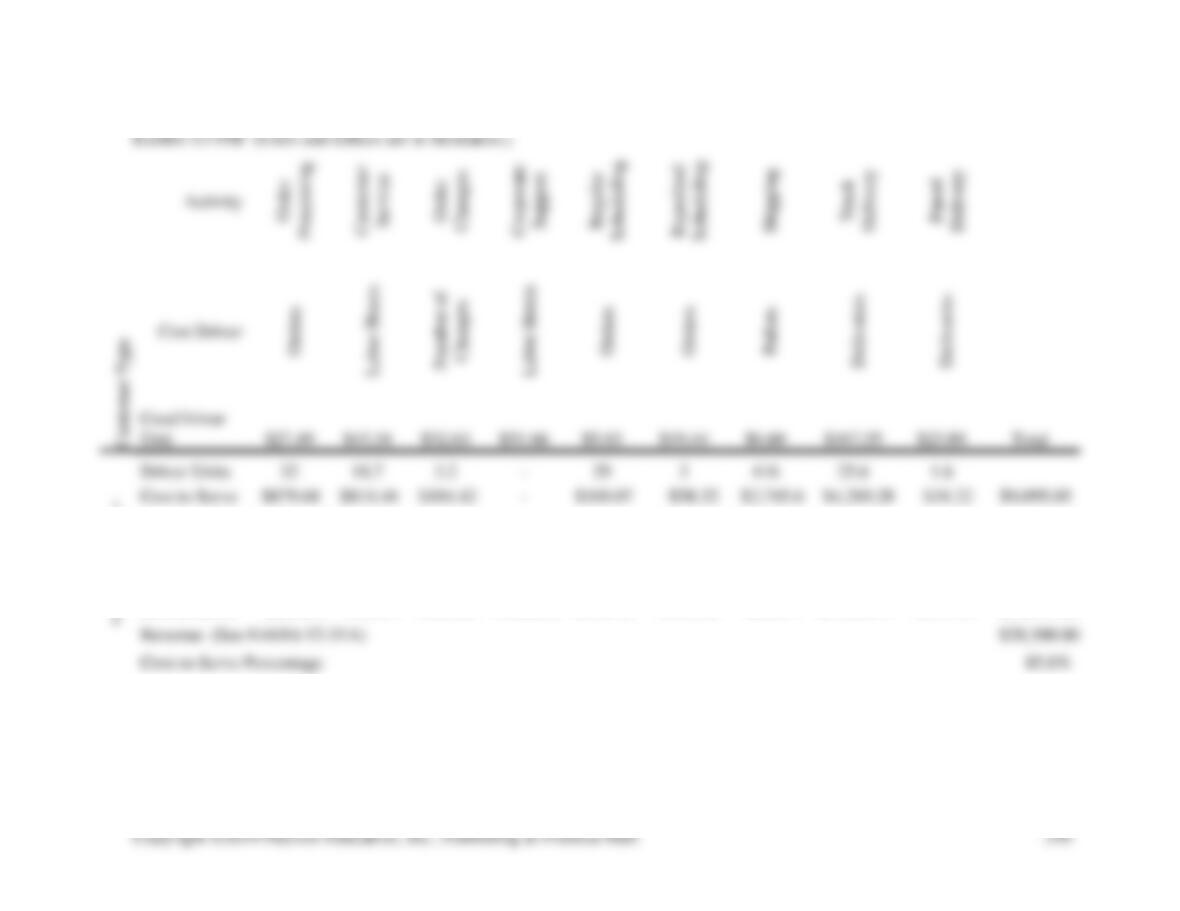
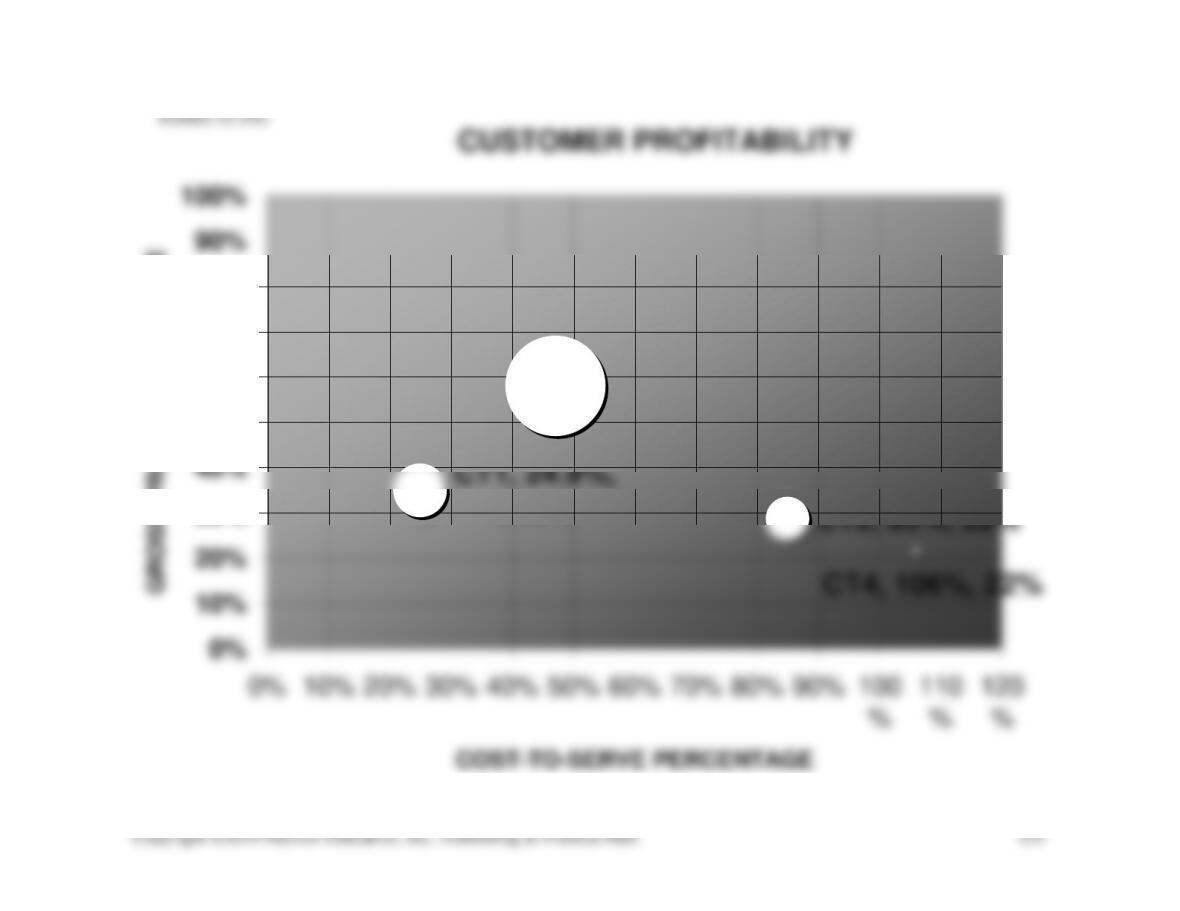
CUSTOMER PROFITABILITY
CT3, 47%, 58%
CT2, 85%, 29%
CT1, 24.9%,
34.9%
CT4, 106%, 22%
0%
10%
20%
30%
40%
50%
60%
70%
80%
90%
100%
0% 10% 20% 30% 40% 50% 60% 70% 80% 90% 100
%
110
%
120
%
COST-TO-SERVE PERCENTAGE
Exhibit 12-51C
Copyright ©2014 Pearson Education, Inc., Publishing as Prentice Hall.
552
12-52 (50-60 min.)
1. Systems Claims
Department Claims Department
First Department First
2. Solution is in Exhibit 12-52.
3. a. The new charging system should improve cost control in the Systems
Department (if the rates are valid) because inefficiencies can no longer be
passed on to the user departments. Thus, the Systems Department would be
forced to watch its costs closely.
b. The recommended system for charging costs to user departments should
Copyright ©2014 Pearson Education, Inc., Publishing as Prentice Hall.
553
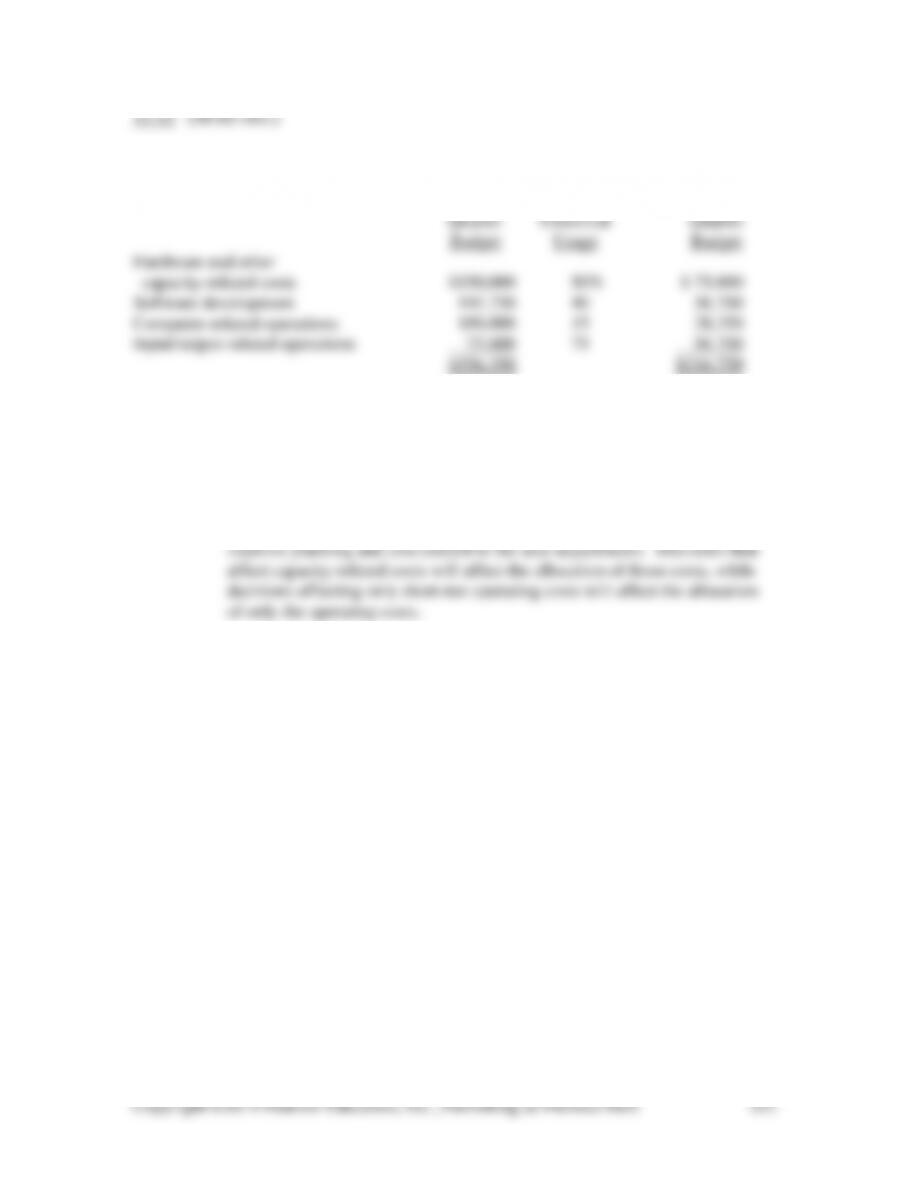
EXHIBIT 12-52
Total
First Quarter
Systems Allocated
Department Not Department
Costs Allocated Total Records Claims Finance Outside
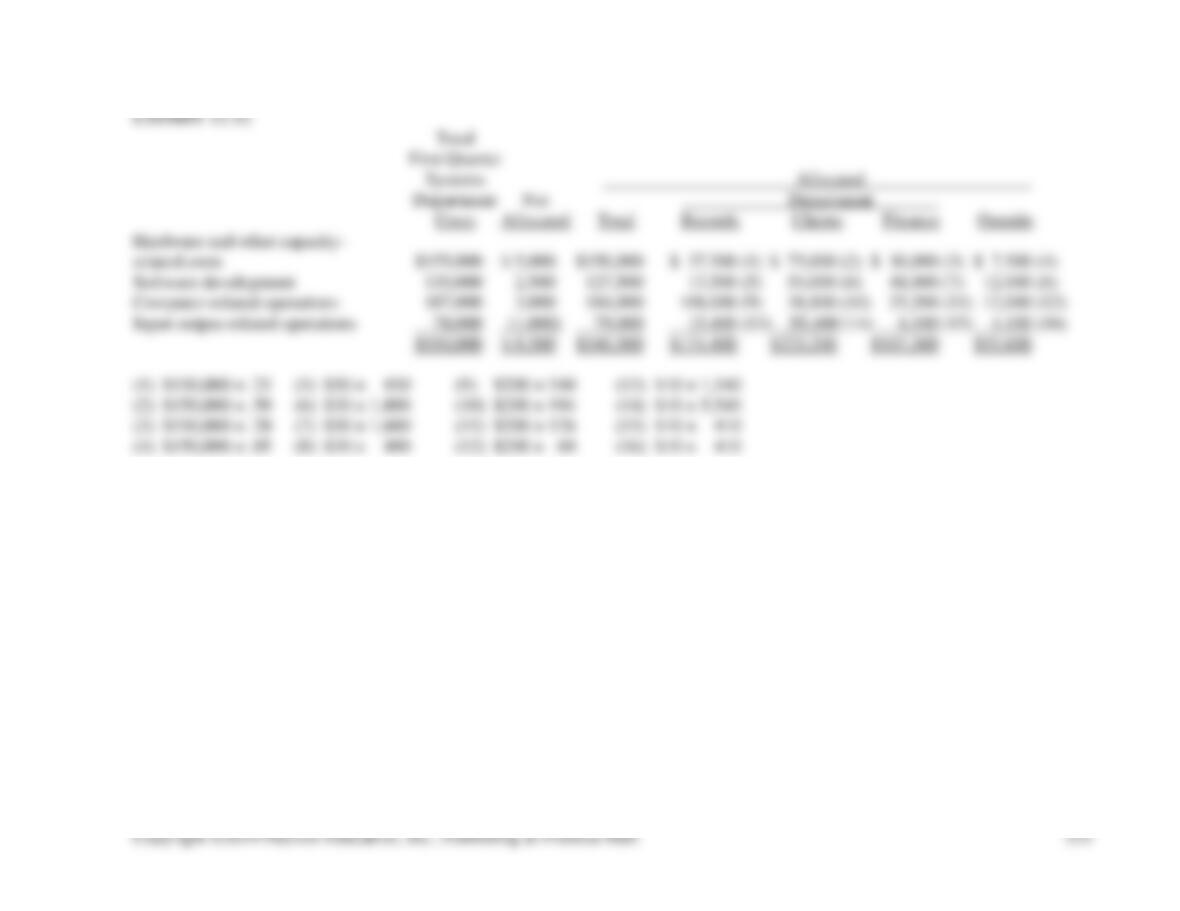
Hardware and other capacity-
related costs $155,000 $ 5,000 $150,000 $ 37,500 (1) $ 75,000 (2) $ 30,000 (3) $ 7,500 (4)
Software development 130,000 2,500 127,500 13,500 (5) 54,000 (6) 48,000 (7) 12,000 (8)
Computer-related operations 187,000 3,000 184,000 108,000 (9) 38,800 (10) 25,200 (11) 12,000 (12)
Input-output-related operations 78,000 (1,000) 79,000 15,400 (13) 55,400 (14) 4,100 (15) 4,100 (16)
$550,000 $ 9,500 $540,500 $174,400 $223,200 $107,300 $35,600
(1) $150,000 × .25 (5) $30 × 450 (9) $200 × 540 (13) $10 × 1,540
(2) $150,000 × .50 (6) $30 × 1,800 (10) $200 × 194 (14) $10 × 5,540
(3) $150,000 × .20 (7) $30 × 1,600 (11) $200 × 126 (15) $10 × 410
(4) $150,000 × .05 (8) $30 × 400 (12) $200 × 60 (16) $10 × 410
12-53 (15-20 min.) Amounts are in millions.
Earnings
Earnings Allocation After
Before of Allocation of
1. Residential = $305,500
Commercial = $504,500
3. Commercial = $504,750
4. In this case there is little difference between the two methods, so the less costly
12-55 (100 min. or more)
The purposes of this exercise are to conduct library research in the current
management accounting literature and to gain a better understanding of activity-based
costing and activity-based management. Students must find their own article on ABC or
12-56 (30-40 min.) NOTE TO INSTRUCTOR: This solution is based on the web site as
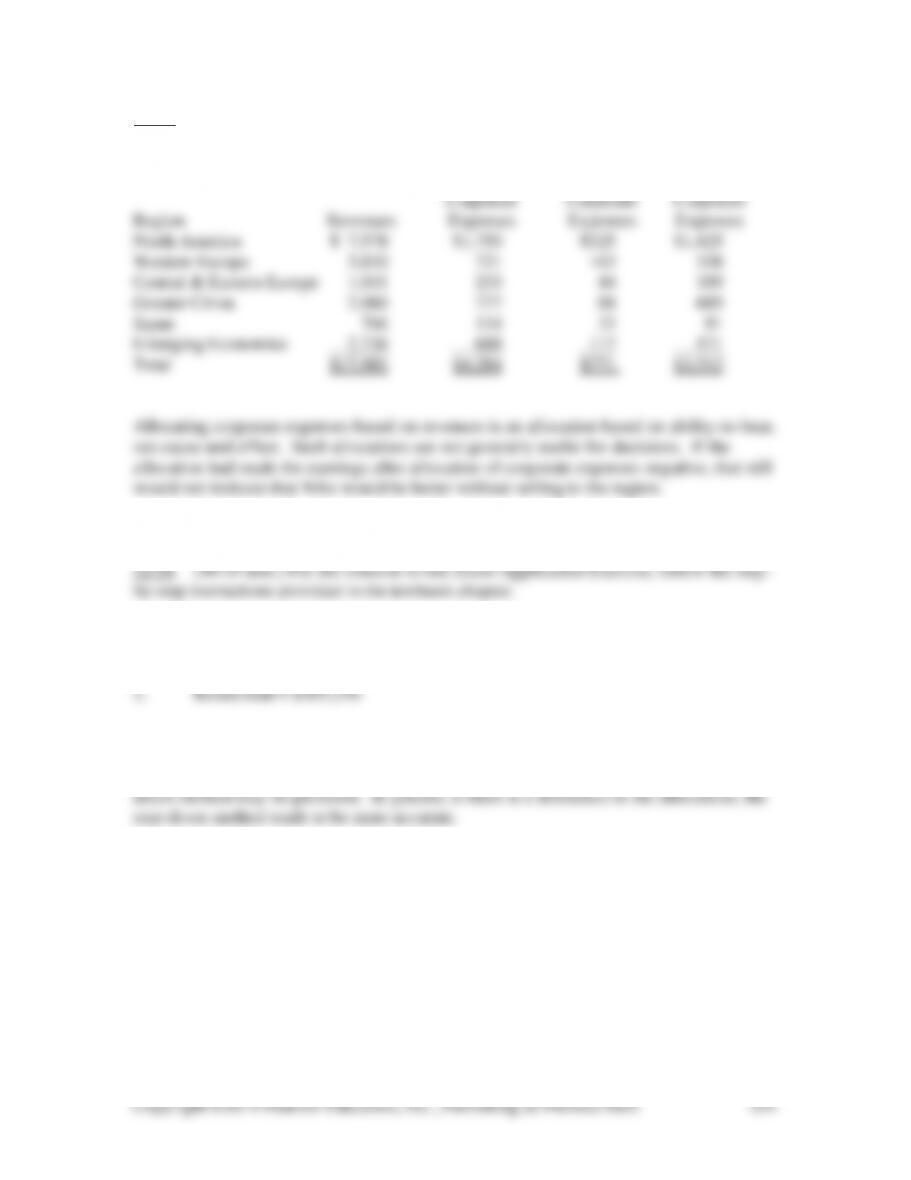
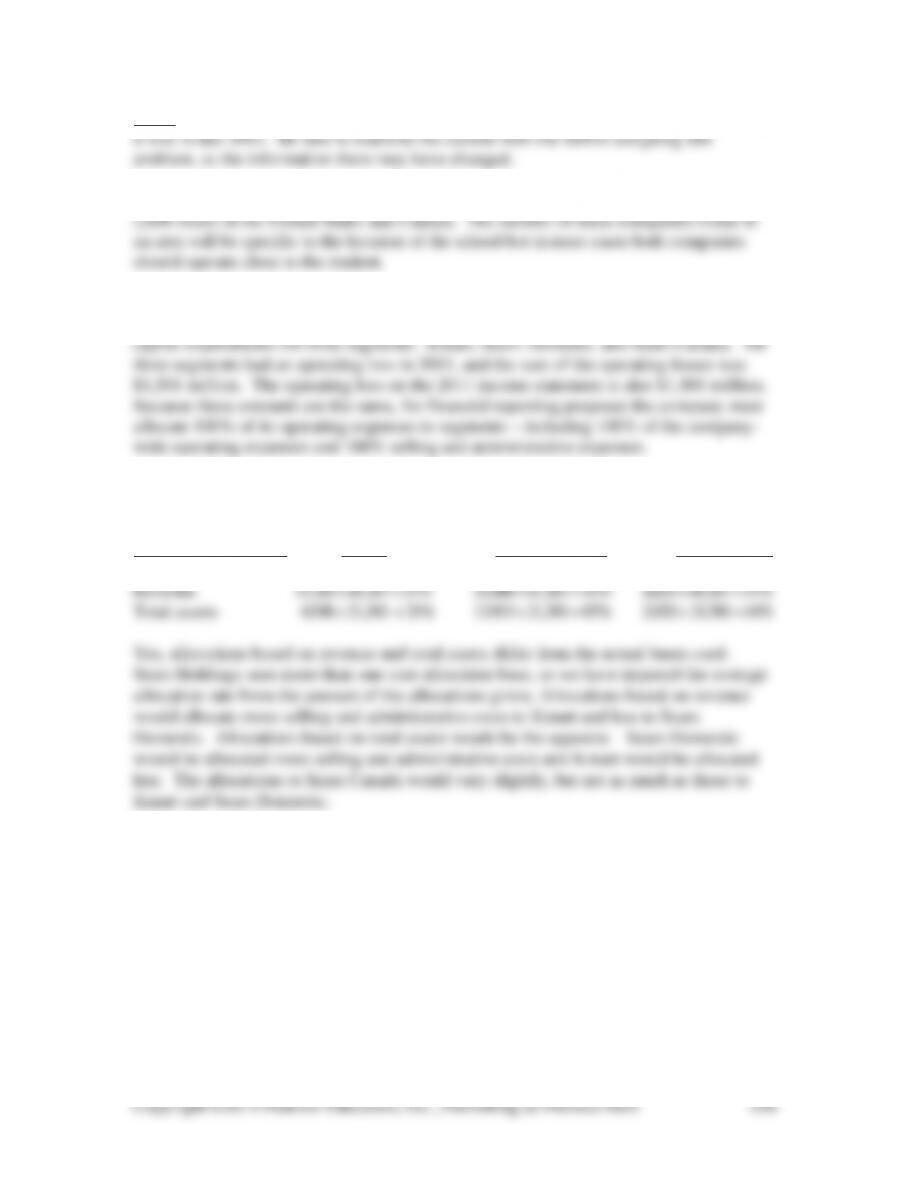
1. Sears Holdings consists of Kmart and Sears stores. Sears and Kmart operate over
2. In footnote 17 to the financial statement in the 10K report for 2011, the company
reports revenue, operating costs and expenses, operating profits (loss), total assets, and
3. The percent of selling and administrative costs allocated to segments with different
cost-allocation bases is:
Cost-Allocation Base Kmart Sears Domestic Sears Canada
Actual “bases” used 3,371 ÷ 10,664 = 32% 6,042 ÷ 10,664 = 57% 1,251 ÷ 10,664 = 12%