CHAPTER 12
COVERAGE OF LEARNING OBJECTIVES
LEARNING
OBJECTIVE
FUNDA-
MENTAL
ASSIGN-
MENT
MATERIAL
CRITICAL
THINKING
EXERCISES,
AND
EXERCISES
PROBLEMS
CASES,
NIKE 10K,
EXCEL,
COLLAB. &
INTERNET
EXERCISES
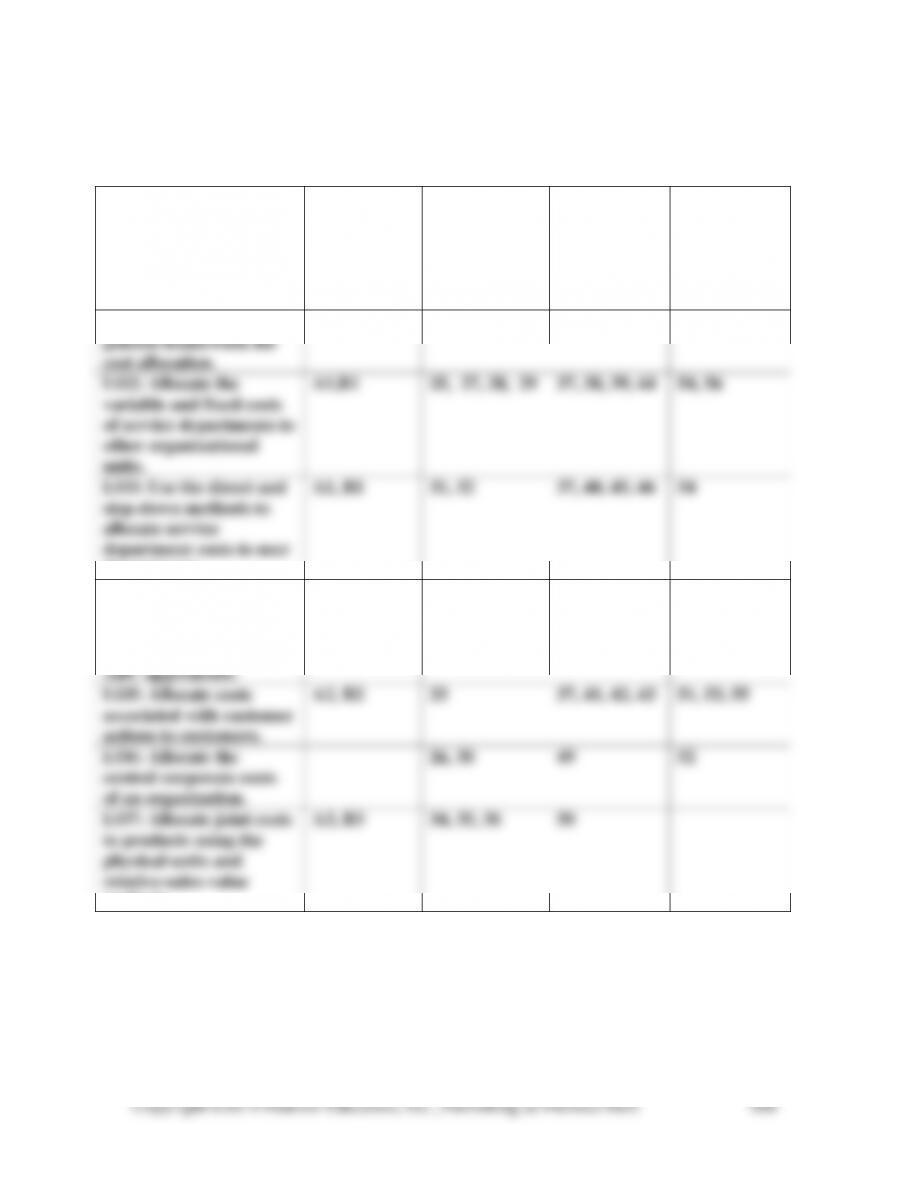
LO1: Describe the
general framework for
cost allocation.
A1, B1
37, 39, 44
LO2: Allocate the
variable and fixed costs
of service departments to
other organizational
units.
A1,B1
25, 27, 28, 29
37, 38, 39, 44
54, 56
LO3: Use the direct and
step-down methods to
allocate service
department costs to user
departments.
A1, B1
31, 32
37, 40, 45, 46
54
LO4: Allocate costs from
producing departments
to products or services
using the traditional and
ABC approaches.
30, 31
37, 40, 47, 48
51, 55
LO5: Allocate costs
associated with customer
actions to customers.
A2, B2
33
37, 41, 42, 43
51, 53, 55
LO6: Allocate the
central corporate costs
of an organization.
26, 30
49
52
LO7: Allocate joint costs
to products using the
physical-units and
relative-sales-value
methods
A3, B3
34, 35, 36
50
Copyright ©2014 Pearson Education, Inc., Publishing as Prentice Hall.
507
CHAPTER 12
Cost Allocation
12-A1 (30-50 min.) The numerical answers for requirements 1 and 2 are in Exhibit 12-
3. The allocation types from Exhibit 12-1 are 3 and 4. Each of the allocations to the
12-A2 (40-50 min.)
1. Product
A B C Total
2. Product
A B C Total
Customer Type 1
Sales $500 $1,000 $13,000 $14,500
Gross Margin 50 200 5,200 5,450
Copyright ©2014 Pearson Education, Inc., Publishing as Prentice Hall.
508
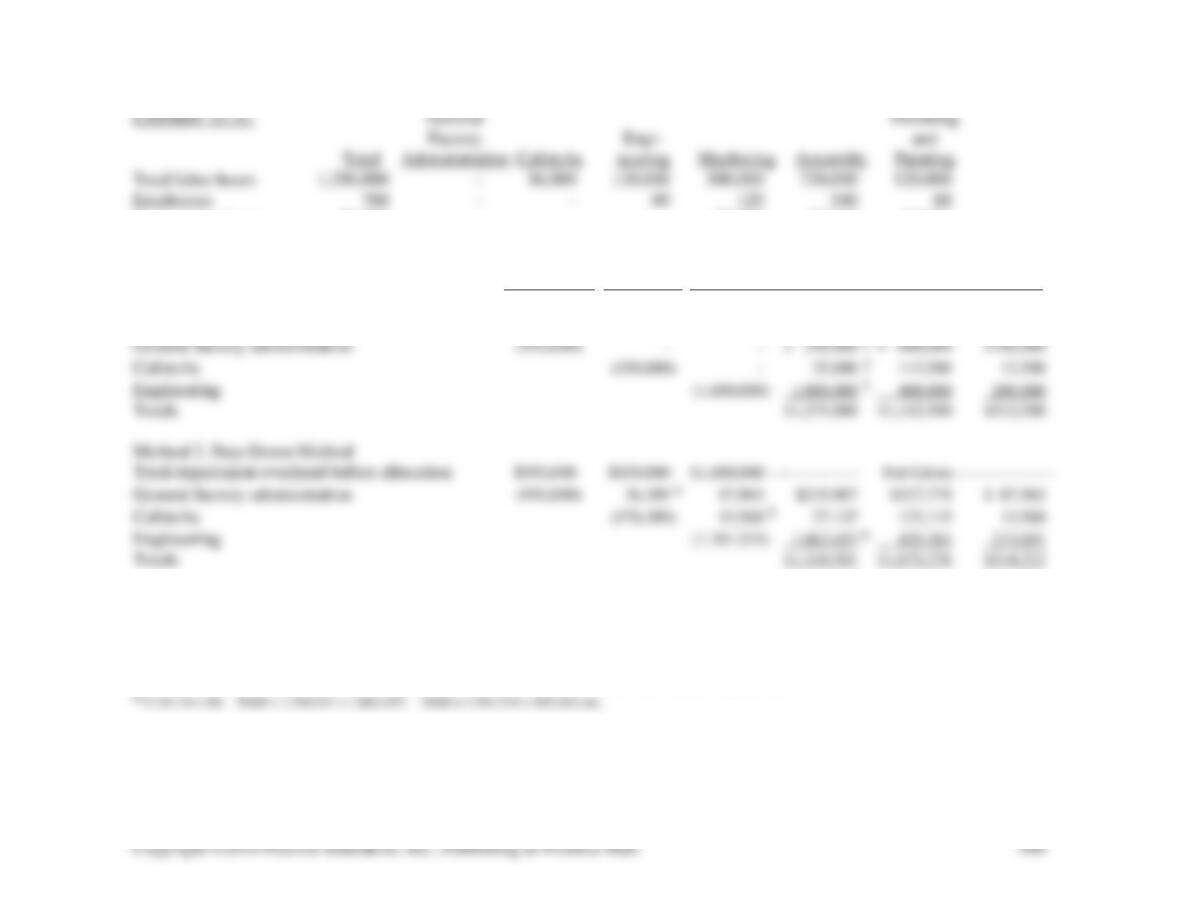
EXHIBIT 12-A1 General Finishing
Factory Engi- and
Total Administration Cafeteria neering Machining Assembly Painting
Total labor hours 1,296,000 – 36,000 120,000 300,000 720,000 120,000
Employees 780 – – 60 120 540 60
Engineering hours 80,000 – – – 50,000 20,000 10,000
Total Engineering Finishing
Cost Drivers Labor Hours Employees Hours Machining Assembly & Painting
Method 1, Direct Method
Total department overhead before allocation $950,000 $150,000 $1,600,000 – – – – – – – – – – Not Given– – – – – – – – – – –
1 300 + 720 + 120 = 1,140; (300÷1,140) × 950,000 = 250,000; (720÷1,140) × 950,000 = 600,000; etc.
2 120 + 540 + 60 = 720; (120÷720) × 150,000 = 25,000; (540÷720) × 150,000 = 112,500; etc.
3 50 + 20 + 10 = 80; 50/80 × 1,600,000 = 1,000,000; 20/80 × 1,600,000 = 400,000; etc.
4 36+120+300+720+120 =1,296 ; (36÷1,296)×950,000 =26,389 ; (120÷1,296)×950,000 =87,963 ; (300÷1,296)×950,000 =219,907 ; etc.
5 60+120+540+60 =780 ; (60÷780)×176,389 =13,568 ; (120÷780)×176,389 =27,137 ; (540÷780)×176,389 =122,115 ; etc.
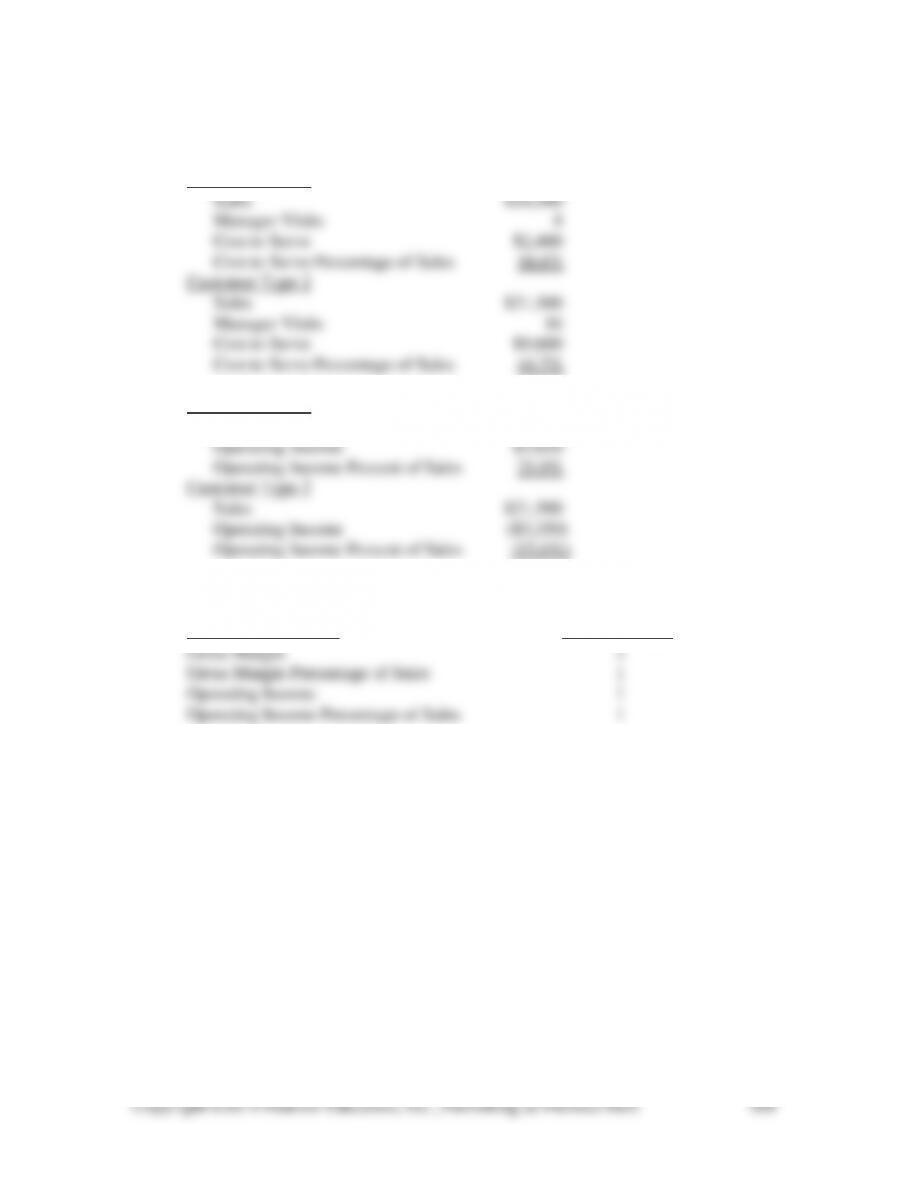
3. Cost to Serve $12,000
Cost to Serve per Visit $12,000 ÷ (4 + 16) = $600
Customer Type 1
4. Customer Type 1
Sales $14,500
5. Most Profitable
Profitability Measure Customer Type
Copyright ©2014 Pearson Education, Inc., Publishing as Prentice Hall.
510
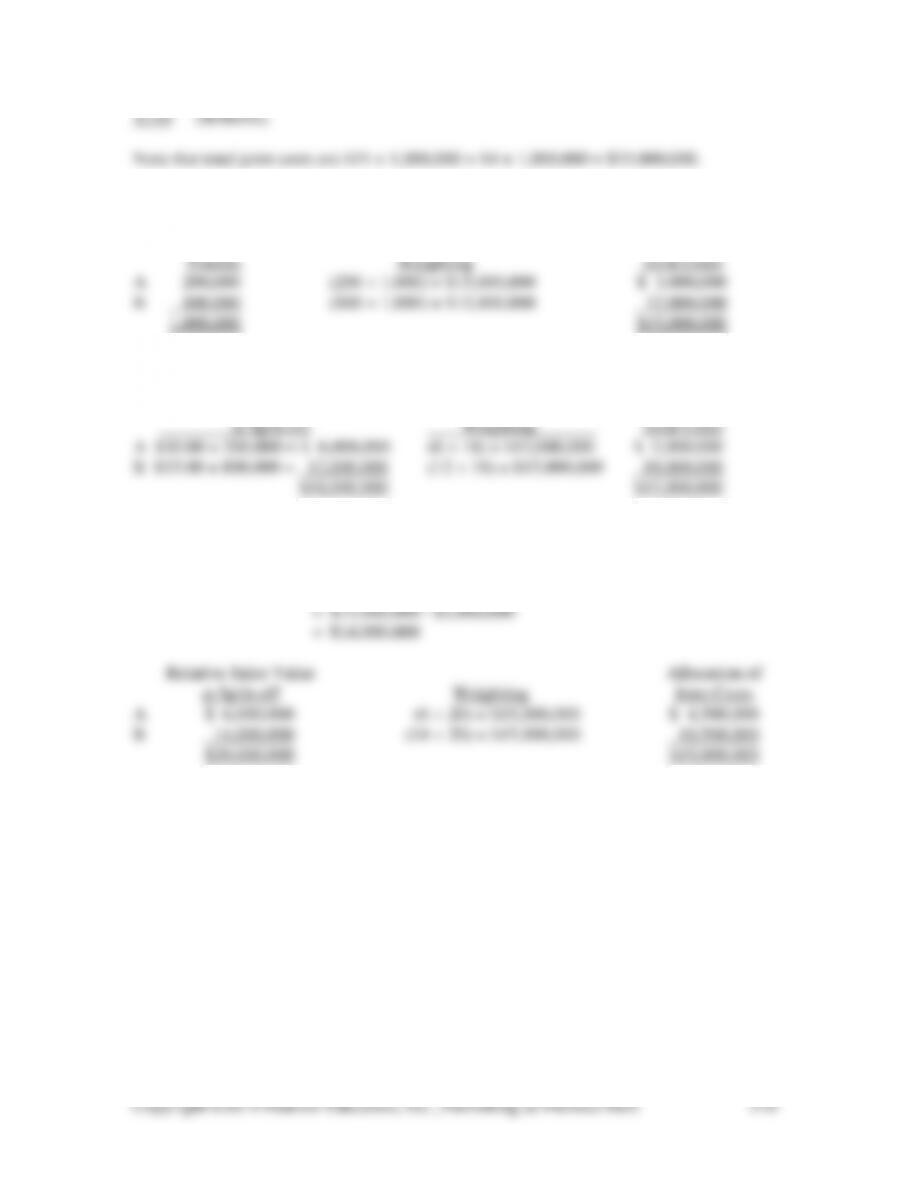
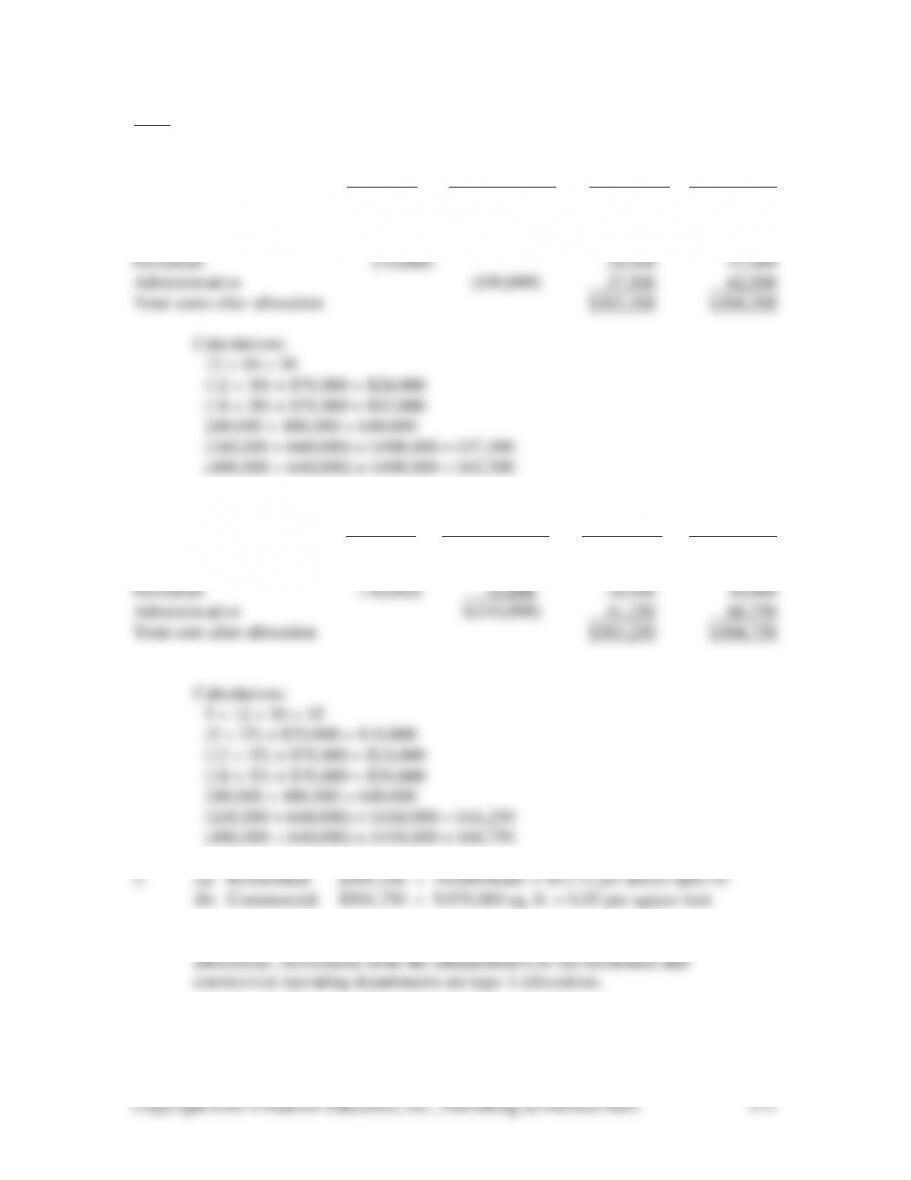
12–A3 (20–30 min.)
Note that total joint costs are $11 × 1,000,000 + $4 × 1,000,000 = $15,000,000.
1. Physical units method:
Allocation of
2. Relative sales value method:
Relative Sales Value Allocation of
3. The sales value of B at the split-off point must be approximated:
Sales value of B = Final sales value – Separable costs
= ($18.75 × 800,000) – [$200,000 + ($1 × 800,000)]
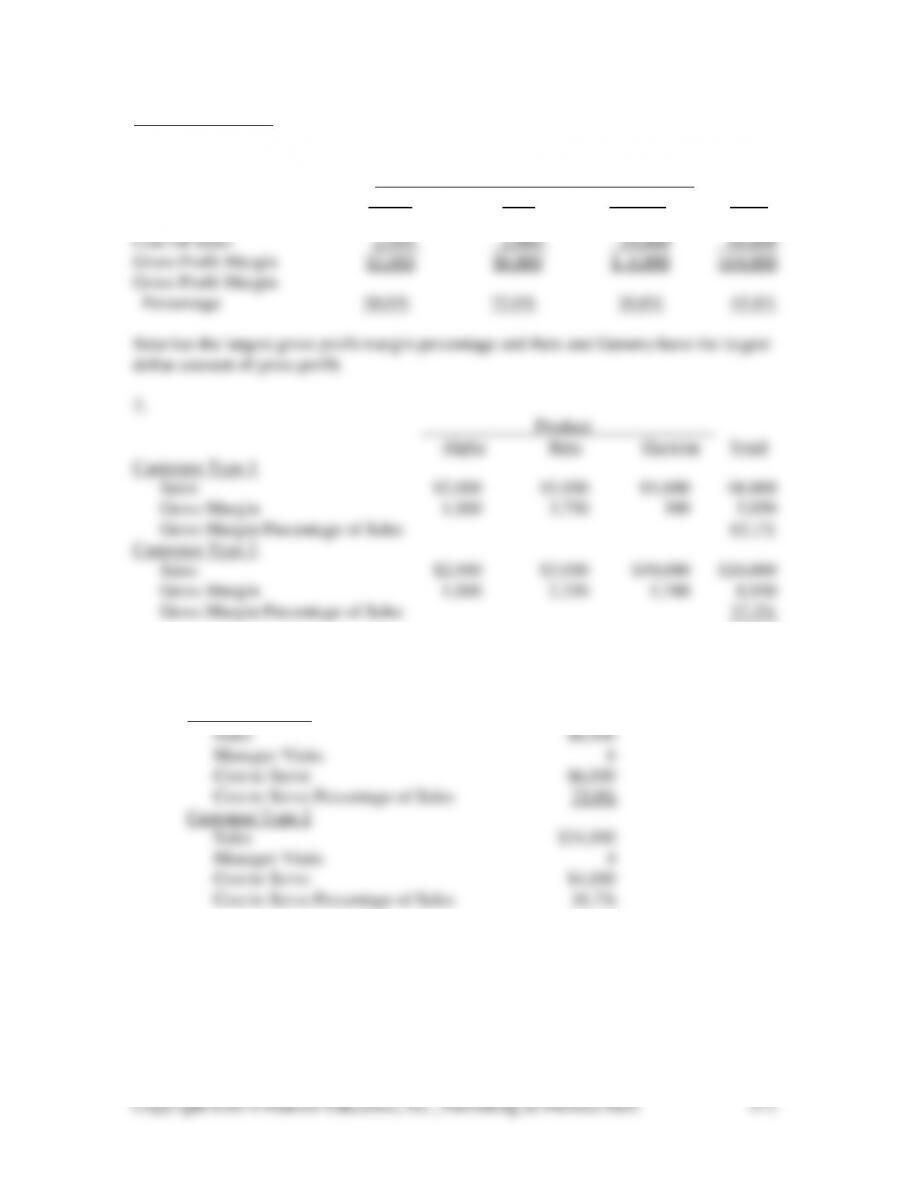
12–B1 (30–40 min.)
1. Direct method:
Personnel Administrative Residential Commercial
Direct departmental
costs before allocation $ 70,000 $ 100,000 $240,000 $400,000
2. Step-down method:
Personnel Administrative Residential Commercial
Direct departmental
cost before allocation $ 70,000 $ 100,000 $240,000 $400,000
4. Allocations from the personnel to the administrative departments are type 3
12-B2 (40-50 min.)
1.
Product
Alpha Beta Gamma Total
Sales $4,000 $8,000 $20,000 $32,000
3. Cost to Serve $10,000
Cost to Serve per Visit $10,000 ÷ (6 + 4) = $1,000
Customer Type 1
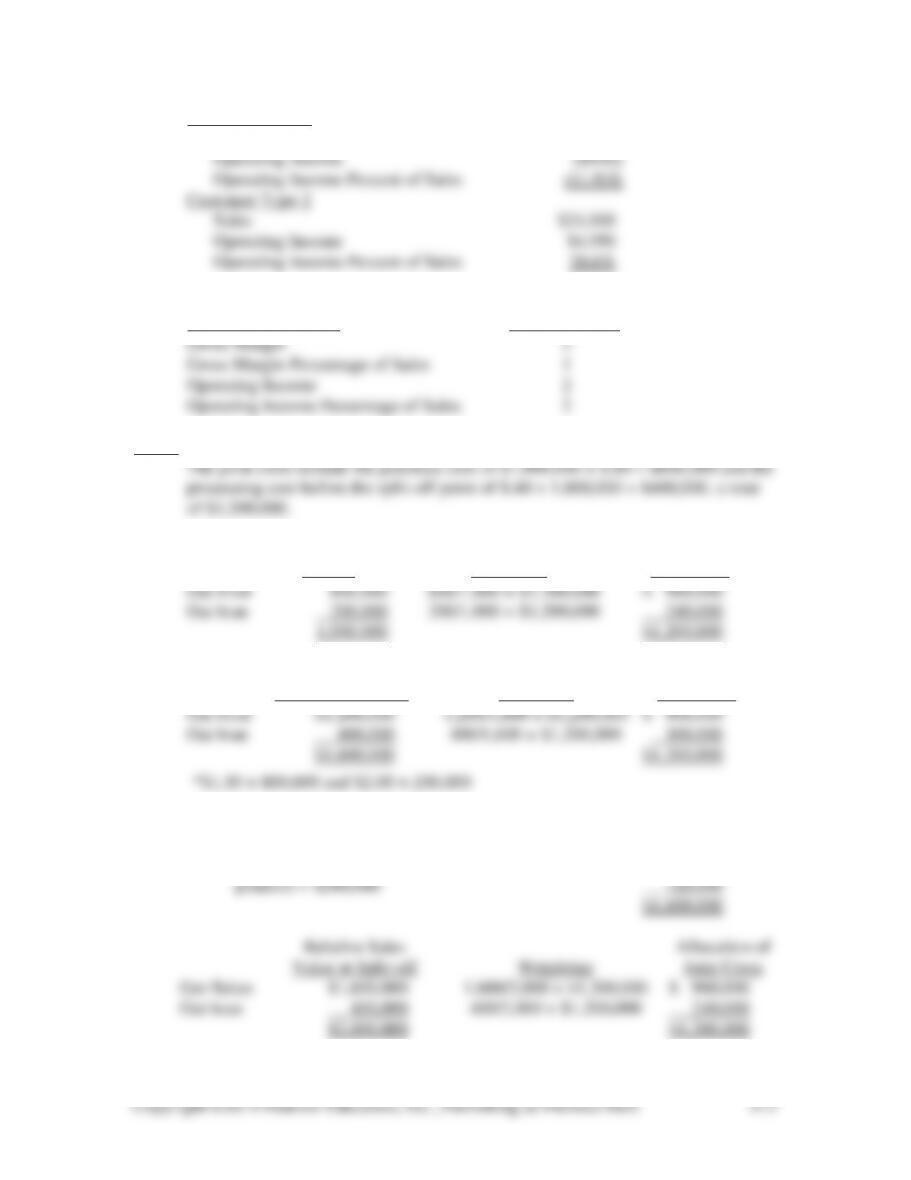
4. Customer Type 1
Sales $8,000
5. Most Profitable
Profitability Measure Customer Type
12-B3 (15 min.)
1. Allocation of
Pounds Weighting Joint Costs
2. Relative Sales Allocation of
Value at Split-off* Weighting Joint Costs
3. Estimated value of oat flour at split-off:
Sales value of oat flakes, $2.90 × 800,000 pounds $2,320,000
– Processing cost after split-off point, ($.60 × 800,000
12-1 For most companies, accountants can directly trace less than 60% of operating costs
12-2 Exhibit 12-1 shows the ten types of cost assignments.
2. Indirect costs allocated to departments
4. Service department costs allocated to producing departments
6. Directly traced costs to producing departments that an organization can also
trace directly to products and services
8. Directly traced costs to service departments that an organization can also trace
directly to customers
10. Product/service costs assigned to customers
12-4 The preferred guidelines for allocating service department costs are:
a. Evaluate performance using budgets for each service (staff) department, just as
they are used for each production or operating (line) department. When feasible,
12-5 The distinction between direct and indirect depends on the cost object. A cost
such as the salaries of service department personnel are a direct cost when the cost object
12-6 Using budgeted rather than actual cost rates protects the using departments from
inefficiencies in the service departments and from intervening price fluctuations.
12-7 The motivation to underestimate long-run usage is a common problem with
12-8 It would be ideal if every cost pool would contain only fixed or only variable
costs. This should be the goal. In practice, there are many reasons why this goal may not
12-9 Two methods of allocating service department costs are the direct method and
the step-down method. The direct method ignores other service departments when any
given service department’s costs are allocated. No costs are allocated from one service
12-10 The direct method of allocating service department costs ignores services that one
service department provides to another service department. The method is easier to apply
12-12 The four steps are as follows:
2. Trace the direct costs to the appropriate products or services.
4. Allocate (apply) the costs in each cost pool to the products or services in
proportion to their usage of the related cost-allocation base.
12-13 First, managers identify the key activities in the organization, and they collect
12-14 Some possible activities and cost drivers are:
Activity Cost driver
12-15 Step 1: Determine the key components of the system.
Step 2: Develop the relationships between resources,
12-16 The simplest answer is to recommend a traditional costing system for the
Youngstown plant and an ABC costing system for the Salem plant. Why? Because one
of the primary purposes of any costing system is to provide as accurate cost information
12-17 When the cost objective is customers, allocating customer-related service-
12-18 Suppose that not only are all of a company’s products profitable (that is, gross
profit is positive), its average gross profit margin percentage is 30%. What if the total
costs of the distribution and customer service value-chain functions is 35% of sales? In
12-19 Low Cost to Serve High Cost to Serve
Large order quantity Small order quantity
Few order changes Many order changes
12-20 If allocations are based on actual rather than forecasted sales, the allocation to a
12-21 What is worse, no allocation or inaccurate allocation based on either implausible
or unreliable cost drivers? Most cost accountants would opt for no allocation. This would
12-22 Joint costs are allocated to products or services for purposes of inventory
12-23 The physical units method allocates joint costs in proportion to some physical
12-24 By-products, like joint products, are not separately identifiable before the split–
off point. However, by-products have relatively insignificant sales values compared to
12-25 Fixed costs are often allocated separately from variable costs because they are
12-26 Sales dollars are often a poor basis for allocation of costs because they reflect
12-27 One way to allocate national advertising costs to territories is on the basis of
1. Business Engineering
Fixed costs per month:
2. Business Engineering
Fixed costs per month:
210/610 × $100,000 $34,426
users.
12-29 (10-15 min.)
2. Fixed cost pool allocated as a lump sum depending on predicted usage:
To City Planning: (36,000 ÷ 100,000) × $3,000 = $1,080 per month
3. The second method, the one that allocated fixed- and variable-cost pools
separately, is preferable. It better recognizes the causes of the costs. The fixed
12-30 (10 – 15 min.)
Bellevue Richfield Hightower
2. Allocation based on actual sales** 120,000 140,000 100,000
3. The major argument against using actual sales as a cost driver for cost allocation
is that a department’s allocation depends on the success of other departments.
Here, Bellevue is allocated an extra $12,000 because sales in the Richfield store
12-31 (25-30 min.)
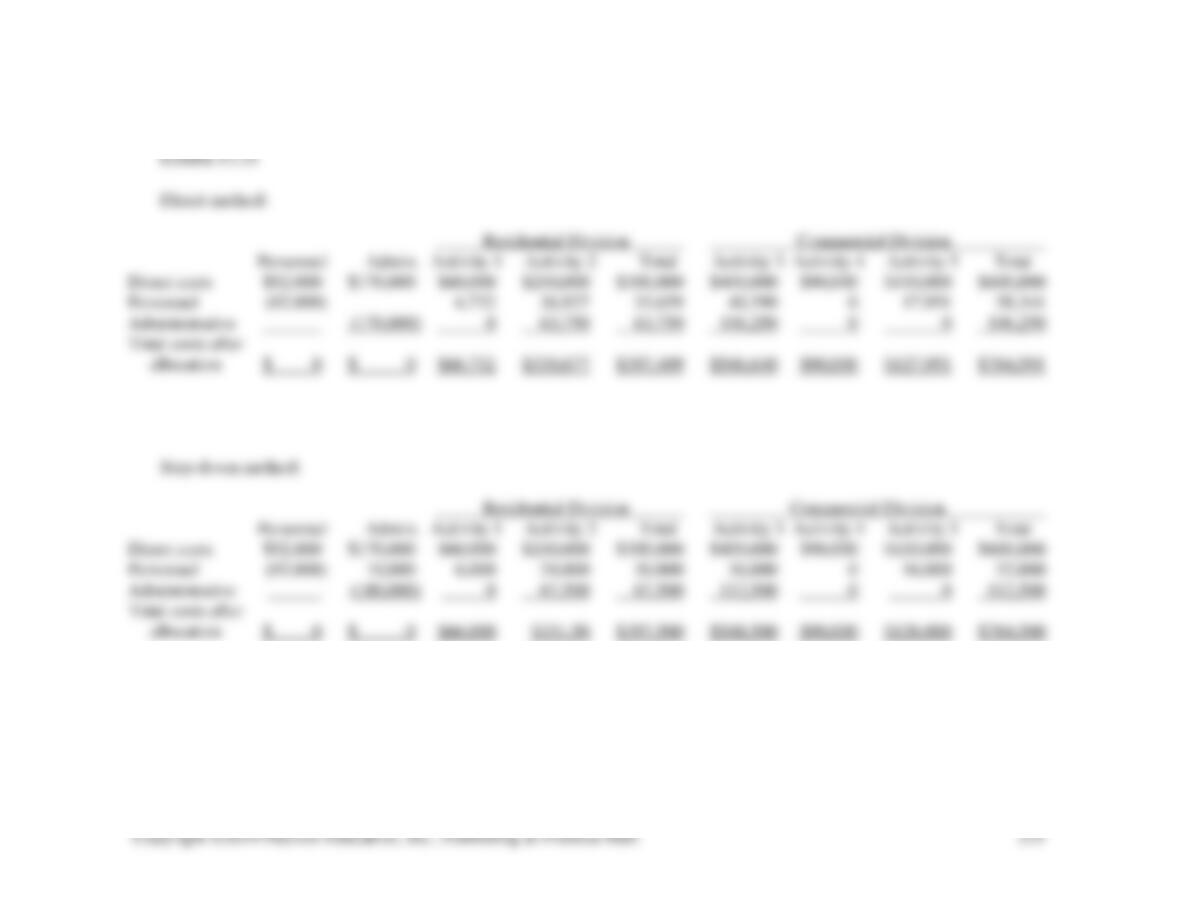
1. See Exhibit 12-31. Calculations for the exhibit follow:
3 + 12 + 18 + 8 = 41
(3 41) × $92,000 = $6,732
2. See Exhibit 12-31. Calculations for the exhibit follow:
5 + 3 + 12 + 18 + 8 = 46
(5 46) × $92,000 = $10,000
(3 46) × $92,000 = $6,000
(12 46) × $92,000 = $24,000
Copyright ©2014 Pearson Education, Inc., Publishing as Prentice Hall.
522
12–32 (15–20 min.)
1. Direct method:
Personnel Custodial Machining Assembly
Direct department costs
2. Step-down method:
Personnel Custodial Machining Assembly
Direct department costs
12-33 (30-40 min.)
1. Product A Product B Product C Product D
Sales $32,000 $88,000 $280,000 $143,000
Cost of sales 20,000 70,400 224,000 81,000
23.2%) as well as the largest dollar contribution to operating income ($17,251 – $7,368 =
$9,883).
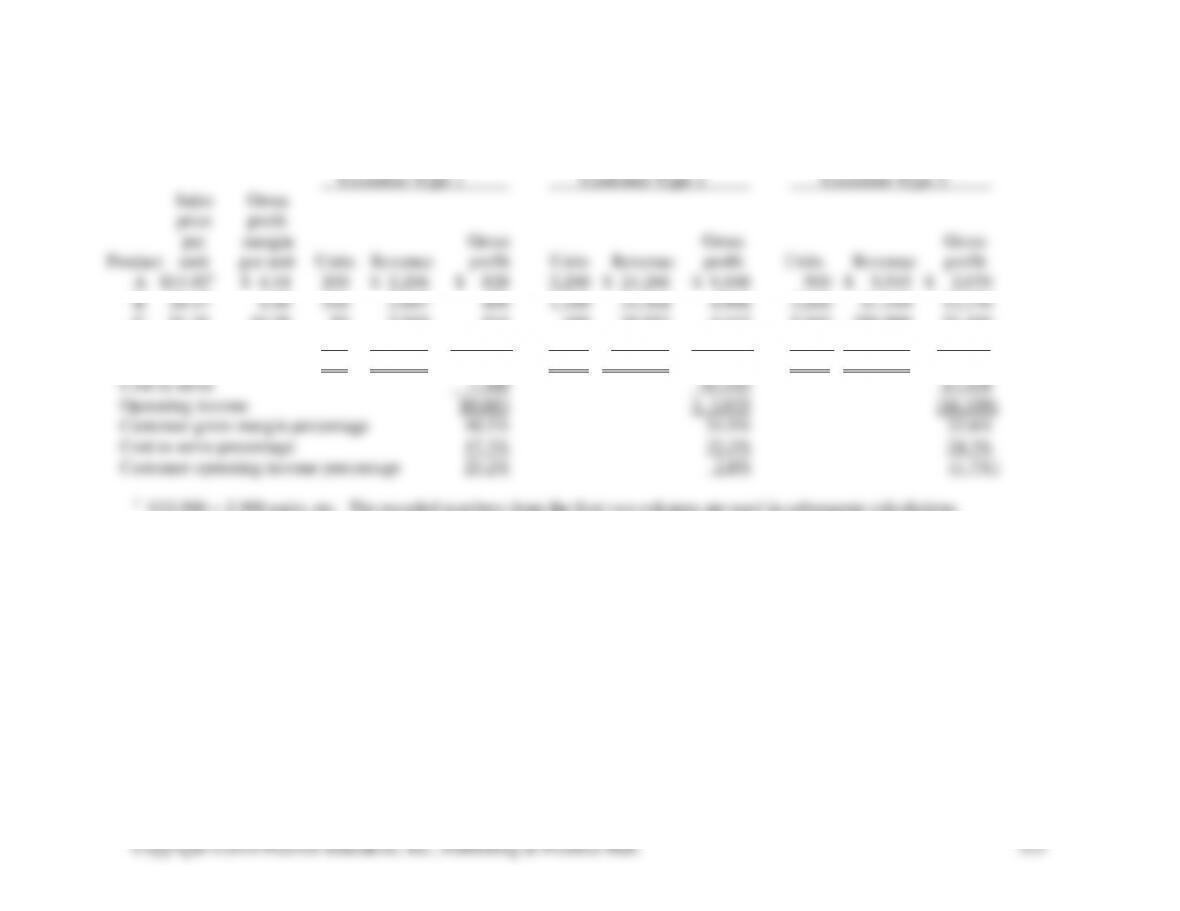
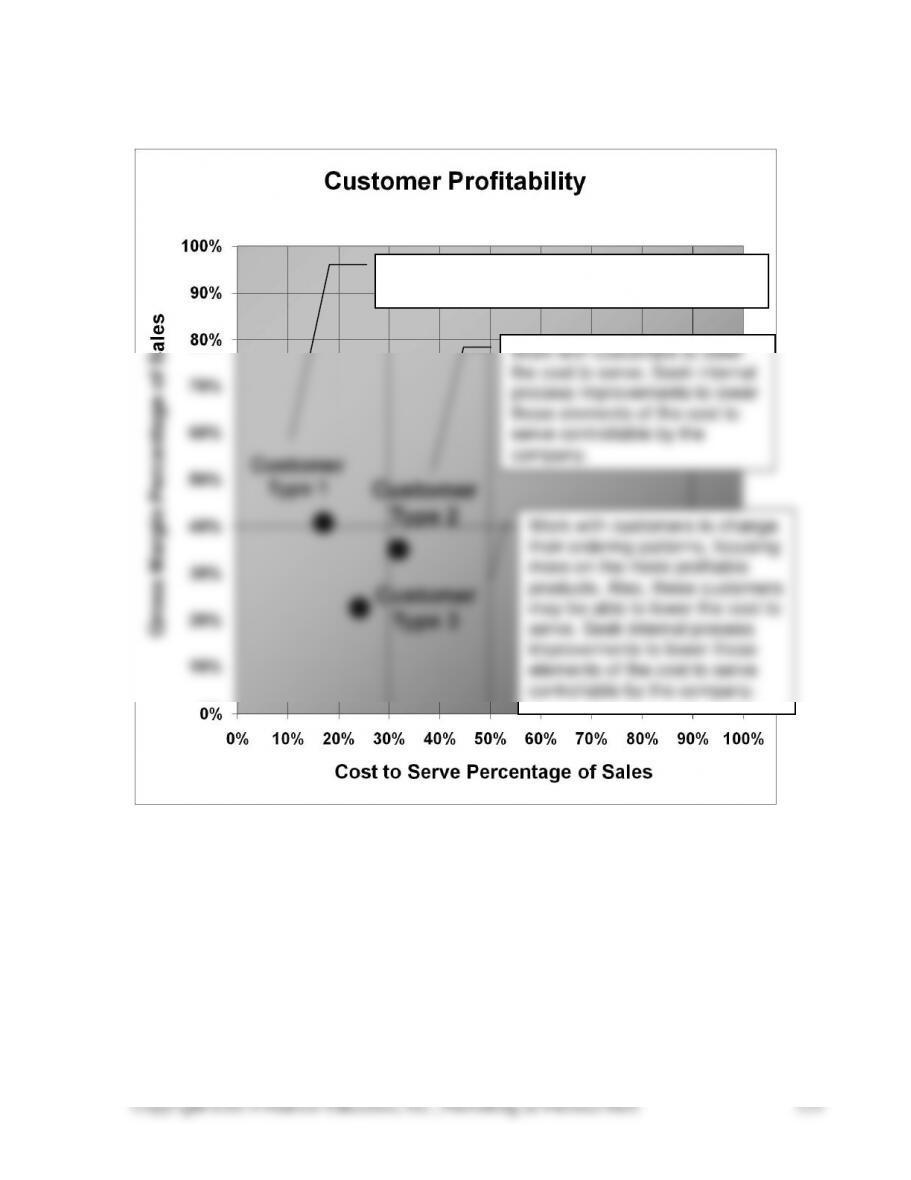
Exhibit 12-33
C 51.38 10.28 50 2,569 514 400 20,552 4,112 5,000 256,900 51,400
D 89.38 38.75 400 35,752 15,500 800 71,504 31,000 400 35,752 15,500
Total 750 $42,574 17,251 4,600 $140,886 49,128 8,900 $359,577 81,240
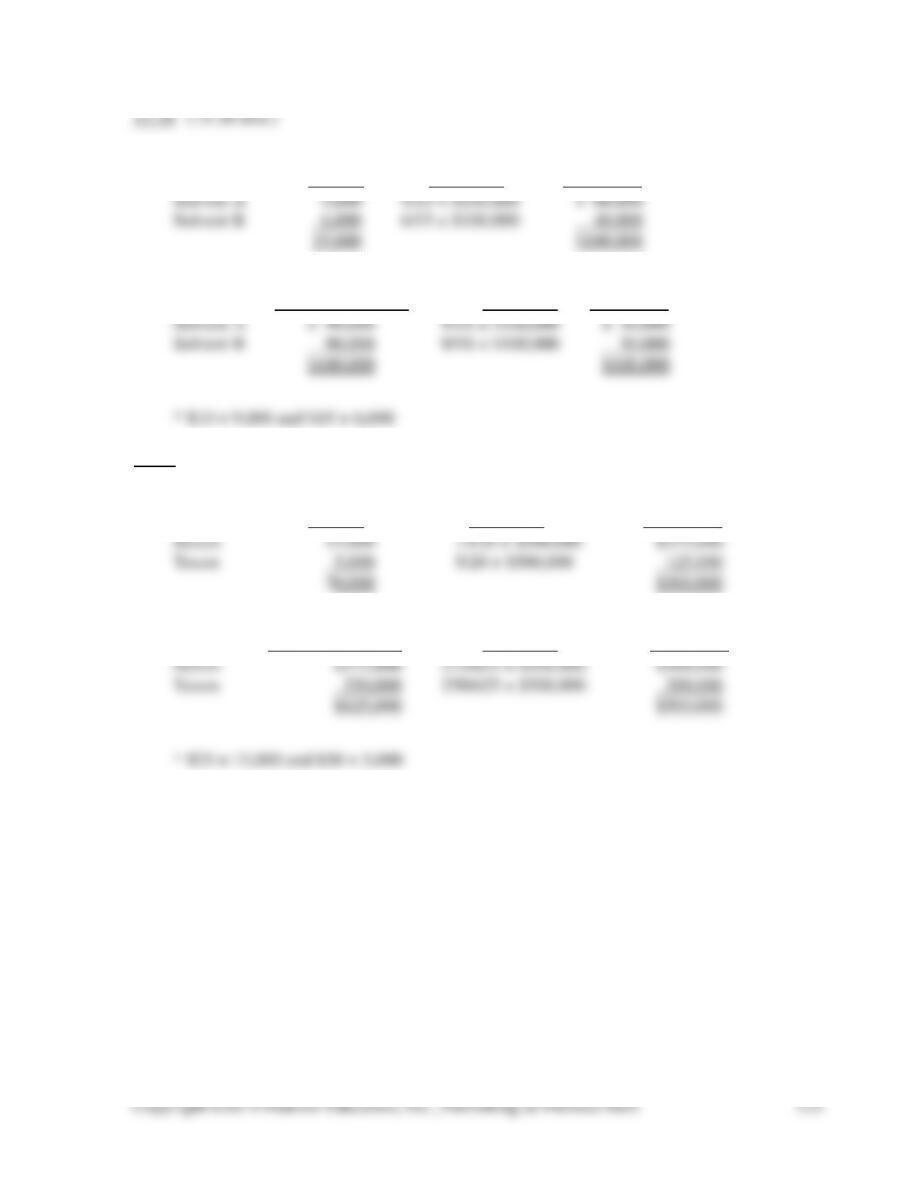
5. The chart below shows customer profitability for the three customer types and suggested
strategies for profit improvement.
Grow business with this customer type by
focused sales efforts and quantity discounts.
Work with customers to lower
the cost to serve. Seek internal
process improvements to lower
those elements of the cost to
serve controllable by the
company.
Work with customers to change
their ordering patterns, focusing
more on the more profitable
products. Also, these customers
may be able to lower the cost to
serve. Seek internal process
improvements to lower those
elements of the cost to serve
controllable by the company.
Copyright ©2014 Pearson Education, Inc., Publishing as Prentice Hall.
525
12-34 (15-20 min.)
1. Allocation of
Gallons Weighting Joint Costs
2. Relative Sales Allocation of
Value at Split-off* Weighting Joint Costs
12-35 (10 min.)
1. Allocation of
Gallons Weighting Joint Costs
2. Relative Sales Allocation of
Value at Split-off* Weighting Joint Costs