2018 127,500 .4371 54,812 (24,244)
2. The payback time is just under four years as shown by the Cumulative Net Cash Flow column. Because the maximum allowable
payback period is 3 years, DGI would not produce the game if the company uses the payback method.
4. The payback model and NPV model lead to different decisions. In general, the NPV method leads to better decisions than the
payback model because the payback model doesn’t measure profitability. Therefore, DGI should probably accept the project and
11-63 (20-35 min.)
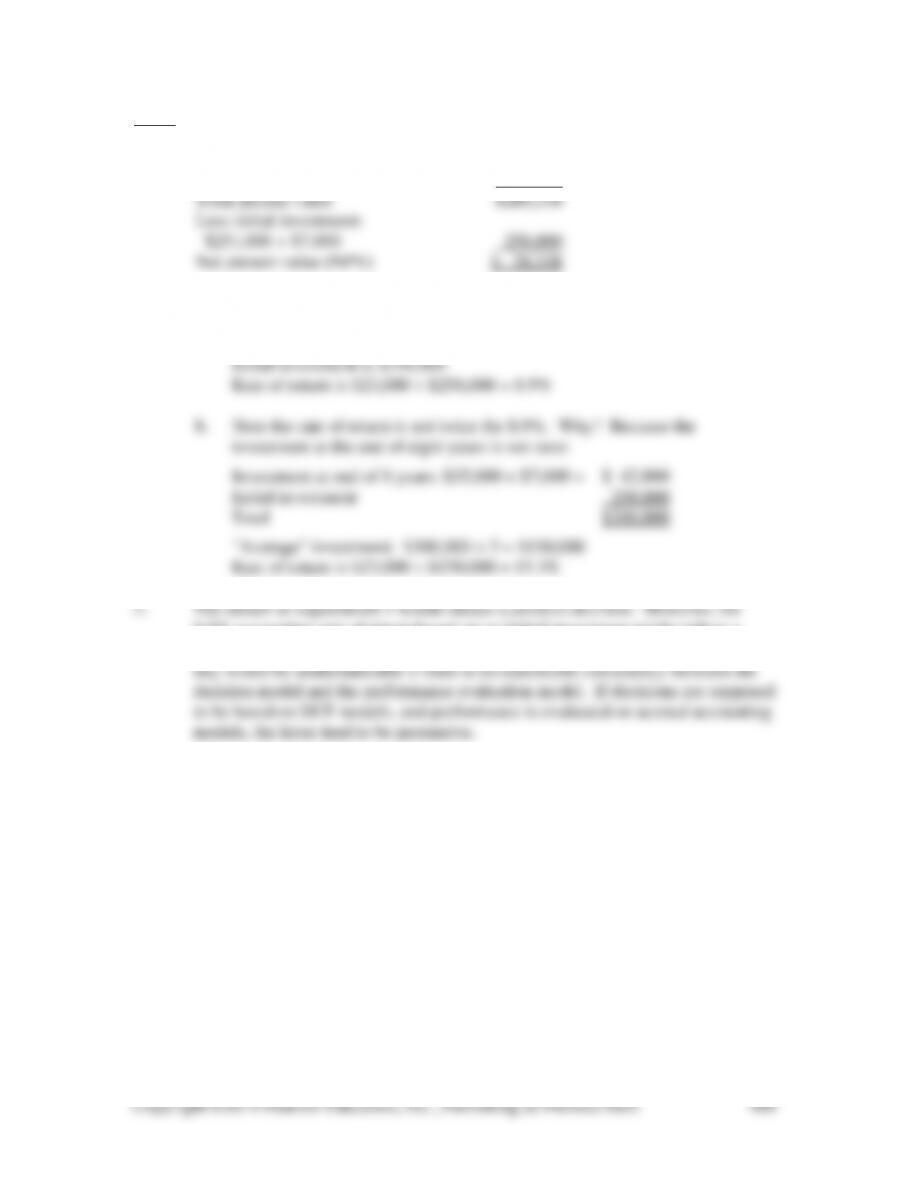
1. $50,000 × 5.3349 factor $266,745
($35,000 + $7,000) × .4665 factor 19,593
2. a. Annual depreciation is ($251,000 – $35,000) ÷ 8 = $27,000
Increase in expected average annual operating income = $50,000 – $27,000
= $23,000
8.9% accounting rate of return based on an initial investment might induce a
negative decision because it is less than 10%. An administrator’s reluctance to
11-64 (20 min.)
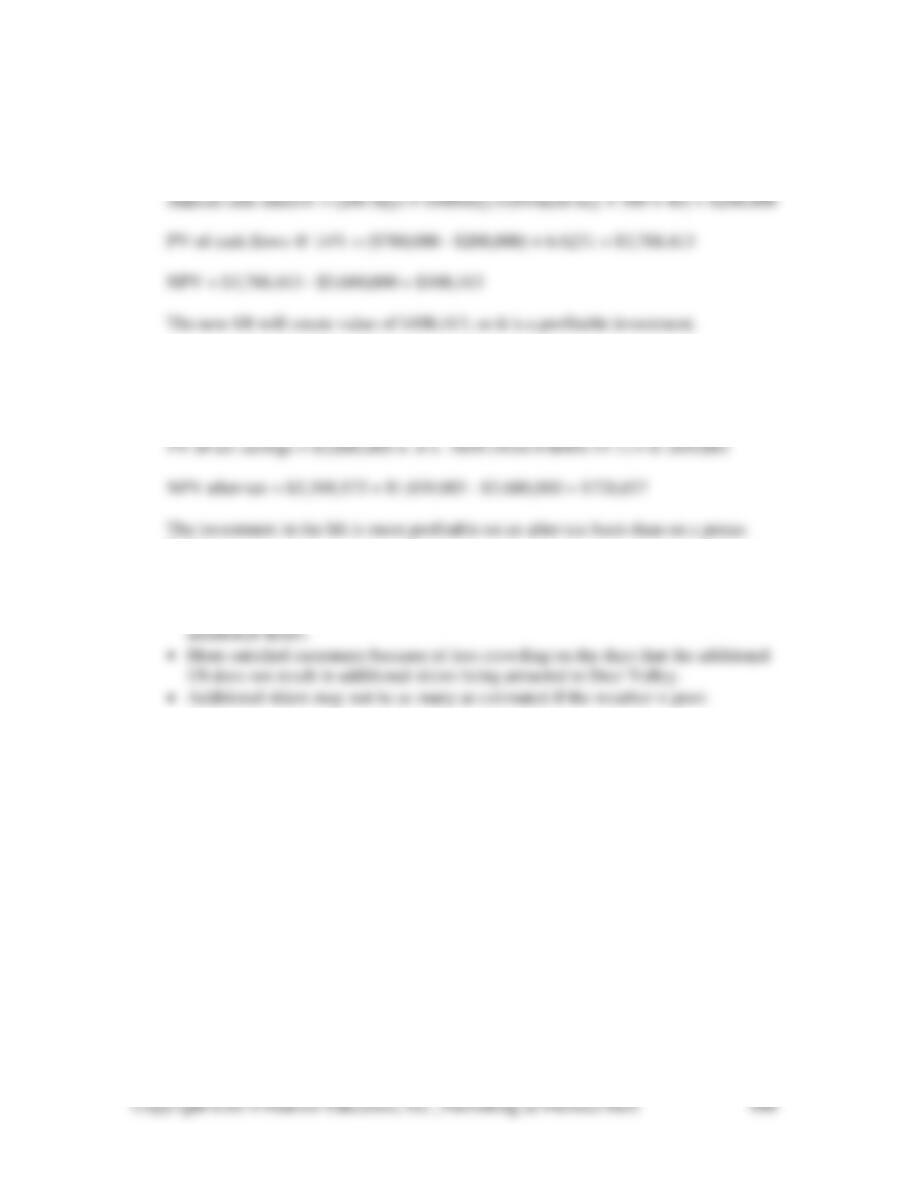
1. Investment = $2,200,000 + $1,480,000 = $3,680,000
Annual cash inflow = 300 skiers × 40 days × $65/skier-day = $780,000
2. After-tax cash flows = $572,000 × .6 = $343,200
PV of after-tax cash flows @ 8% = $343,200 × 9.8181 = $3,369,572
basis.
3. Subjective factors that might affect this decision include:
• Profits on sales of food, rental of equipment, and other items purchased by the
11-65 (30 min.)
Investment $(85,000)
Net cash operating inflows
Annual savings (60,000 – 42,000) $18,000
Income taxes @ 30% 5,400
1. See Exhibit 11-66 on the following page for the solution to requirement.
2. The greatest difficulty is the reliability of the numbers in a world of uncertainty.
Although “the numbers” indicate the truck is a favorable alternative, the following
other factors could influence the final decision:
(a) If the back-haul agreement can be canceled by Retro at any time, the truck
becomes a more risky investment since the back-haul revenue is needed to make
Copyright ©2014 Pearson Education, Inc., Publishing as Prentice Hall.
492
EXHIBIT 11-66 Total Present After-Tax Cash Flows (in dollars)
Value Year 0 Year 1 Year 2 Year 3 Year 4 Year 5 Year 6
Alternative 1: Continue w/ common carrier
500,000 lbs @ 26¢ $130,000
Inc. tax savings @ 40% (52,000)
After-tax (Year 0) $ 78,000
3 19.2 9,600 3,840 3,840
4-5 11.52 5,760 2,304 2,304 2,304
6 5.76 2,880 1,152 1,152
Back-haul revenue*
50 trips** @ $2,400 $120,000
Copyright ©2014 Pearson Education, Inc., Publishing as Prentice Hall.
493
11-67 (20-30 min.)
1 & 2. See Exhibit 11-67 for the solution to requirements 1 and 2.
3. Correct analysis of inflation can affect decisions. Using a required rate of return
projects.
11-68 (25-30 min.) Amounts are in Estonian kroons (EEK).
Annual cash savings (EEK 520,000 × 5) EEK 2,600,000
1. NPV = (EEK 800,000 × 4.9676*) – EEK 2,800,000
= EEK 3,974,080 – EEK 2,800,000
2. Pessimistic:
Annual savings = EEK 800,000 – EEK 520,000 = EEK 280,000
Economic life = 5 years
NPV = (EEK 280,000 × 3.6048) – EEK 2,800,000
=EEK 1,009,344 – EEK 2,800,000 = EEK (1,790,656)
Copyright ©2014 Pearson Education, Inc., Publishing as Prentice Hall.
494
EXHIBIT 11–67
14% Total Sketch of Relevant Cash Flows
PV Present (in dollars)
Description Factor Value 20X0 20X1 20X2 20X3 20X4 20X5
1. Per Problem Instructions (But that is
an incorrect analysis, which includes an
2. Correct Analysis:
(Includes an inflation element in
both the discount rate and the
predicted cash flows.)
3. Investment in new technology often has many effects that are difficult to quantify.
A special report in Business Week reported that most companies do not provide a
quantitative cost justification for the purchase of computers. However, the article
goes on to point out that analyses such as NPV are being increasingly demanded by
11-69 (30-40 min.) This case focuses on the appropriate baseline for NPV analysis for an
1. This is a straightforward NPV analysis:
End Present Value Differential Present Value
of @ 12% Net of Differential
Year from Table 1 Cash Flow Cash Flow
2. An additional advantage of the CIM must be recognized in this analysis. In the
absence of investment in the CIM, some of the existing contribution margin will be
lost each year. Investment avoids this loss, so the amount of the contribution margin
that would have been lost is in essence a savings from investment in the CIM.
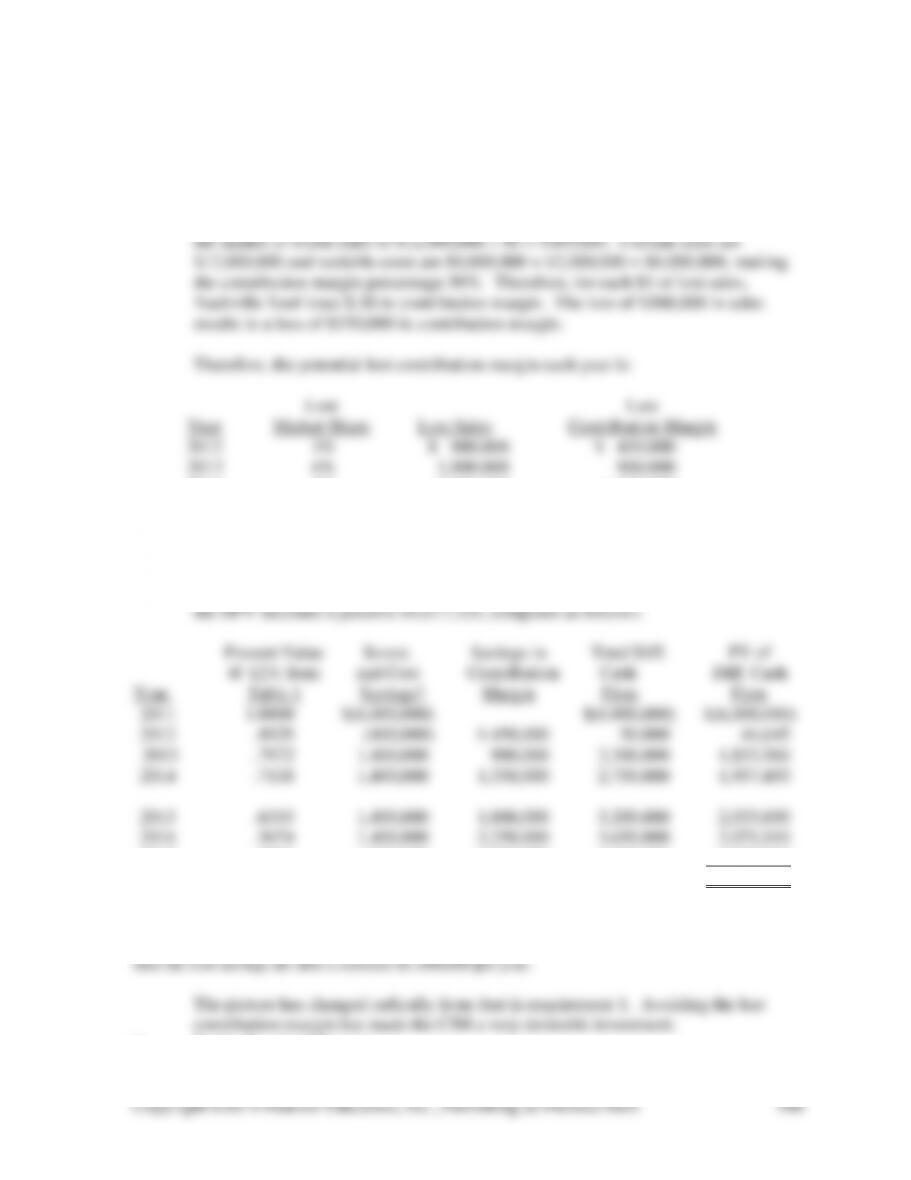
The current market share of 40% and sales of $12 million implies that each 1% of
2014 9% 2,700,000 1,350,000
2015 12% 3,600,000 1,800,000
2016 15% 4,500,000 2,250,000
2017 18% 5,400,000 2,700,000
Combining the savings from variable costs with the savings in contribution margin,
2017 .5066 1,400,000 2,700,000 4,100,000 2,077,060
Total $ 4,017,325
*These cost savings are the same as those in part 1 because even though the variable cost of goods
sold declines with the decrease in sales, this only occurs if the CIM investment is not made. If the
investment is made, market share remains constant at 40% ($12,000,000 in revenues) every year, and
3. To the Board of Directors:
I recommend that Nashville Tool invest in the new CIM system. I have made two
net present value analyses, the first one showing a negative NPV of more than
$1,850,000 and the second showing a positive NPV of over $4 million. Let me
explain why the second analysis is better.
11-70 (30-40 min.)
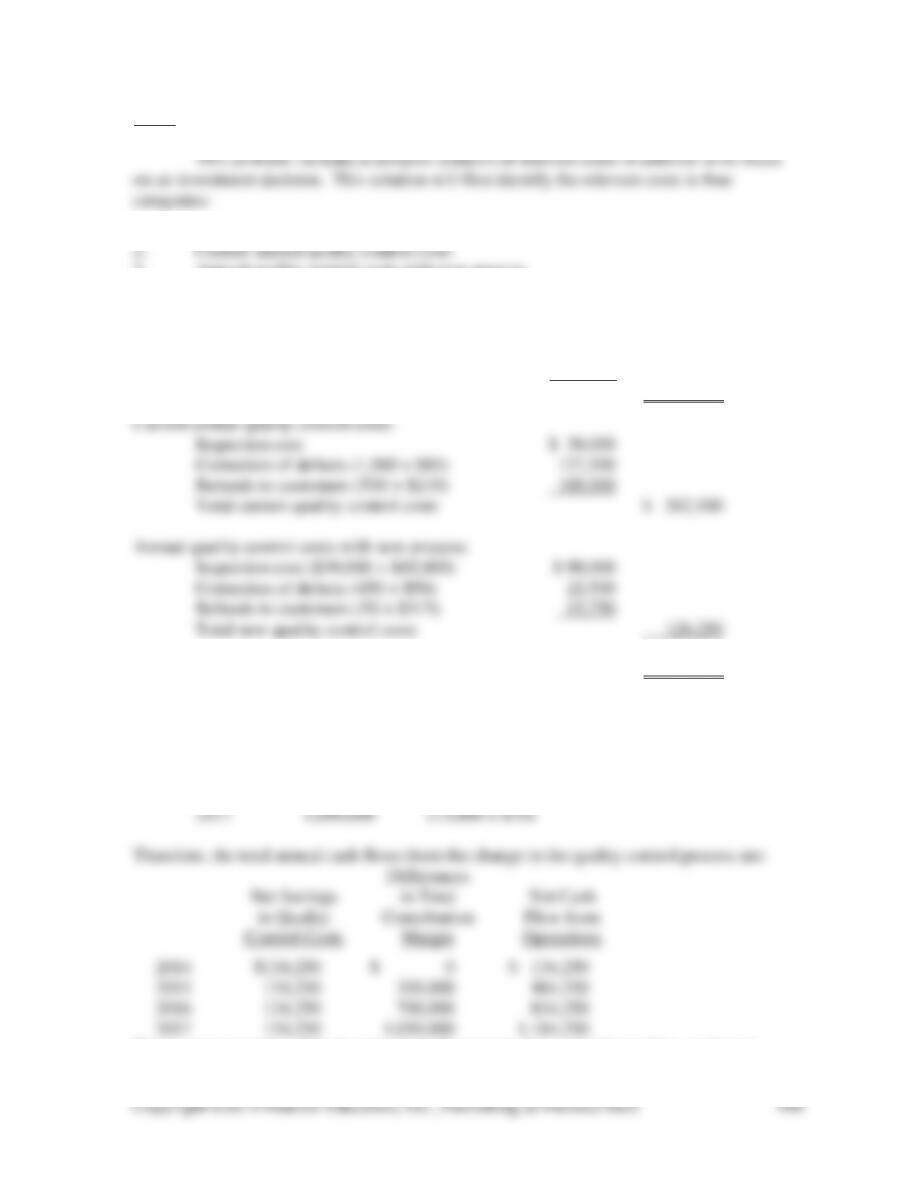
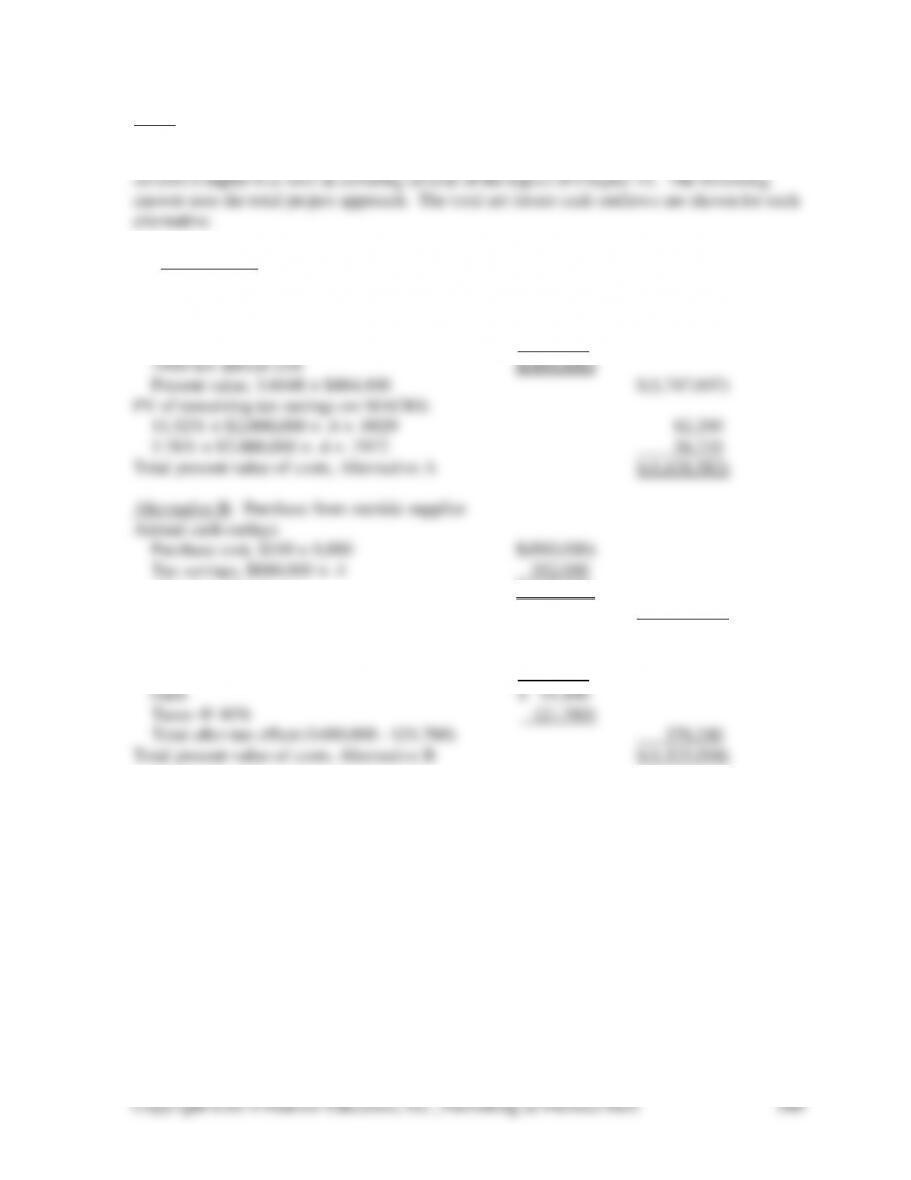
1. Initial investment
3. Annual quality control costs with new process
4. Forgone profits if quality is not improved
Initial investment:
Worker training $950,000
X-ray machine 250,000
Total investment $1,200,000
Net savings in quality control costs $ 134,250
Difference in contribution margin if quality is not improved:
2014 $ 0
2015 350,000 (5,000 × $70)
2016 700,000 (10,000 × $70)
The net present value of the investment in the new quality control is positive, so invest:
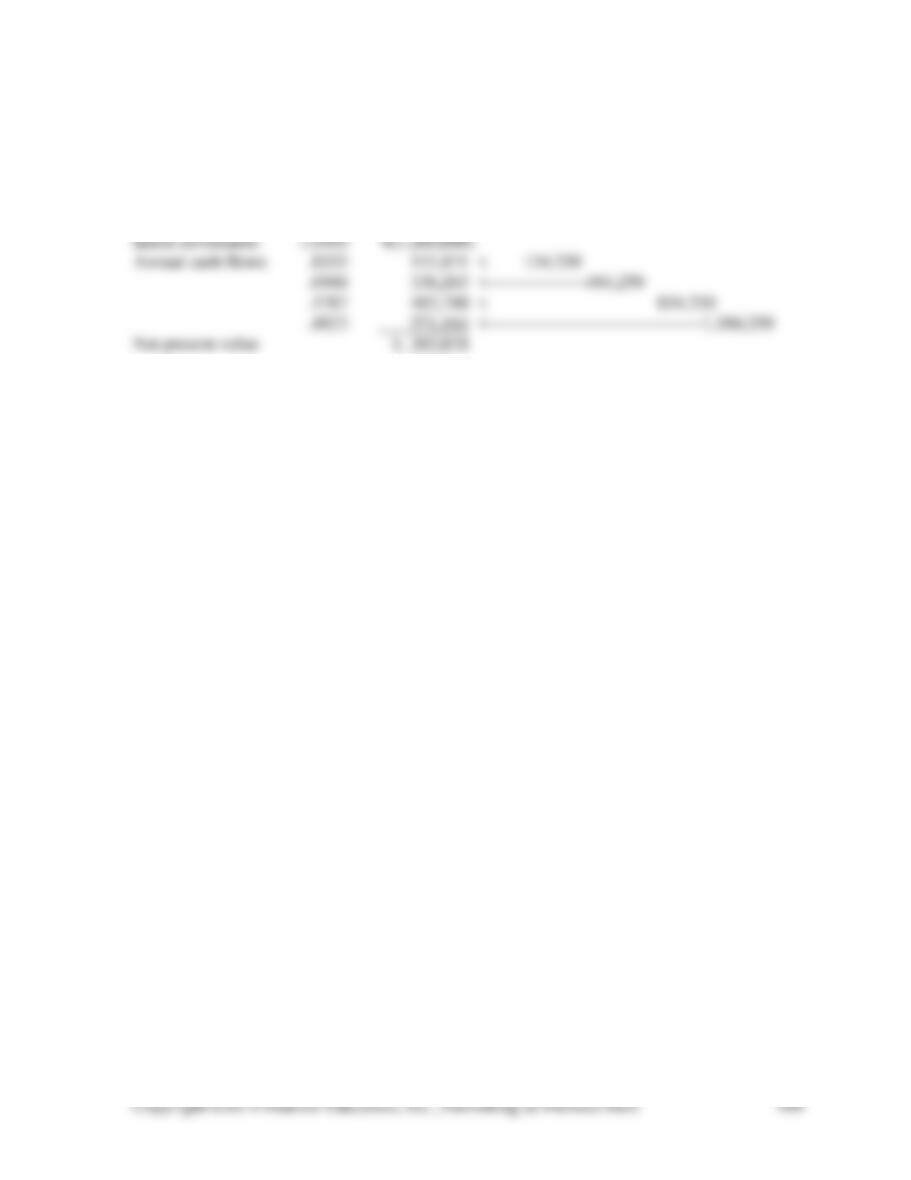
Total Sketch of annual cash flows
PV of $1 Present
@ 20% Value |–––––––|–––––––|–––––––|–––––––|
0 1 2 3 4
11-71 (60-90 min.)
This is a complex problem because it requires comparing three alternatives. It
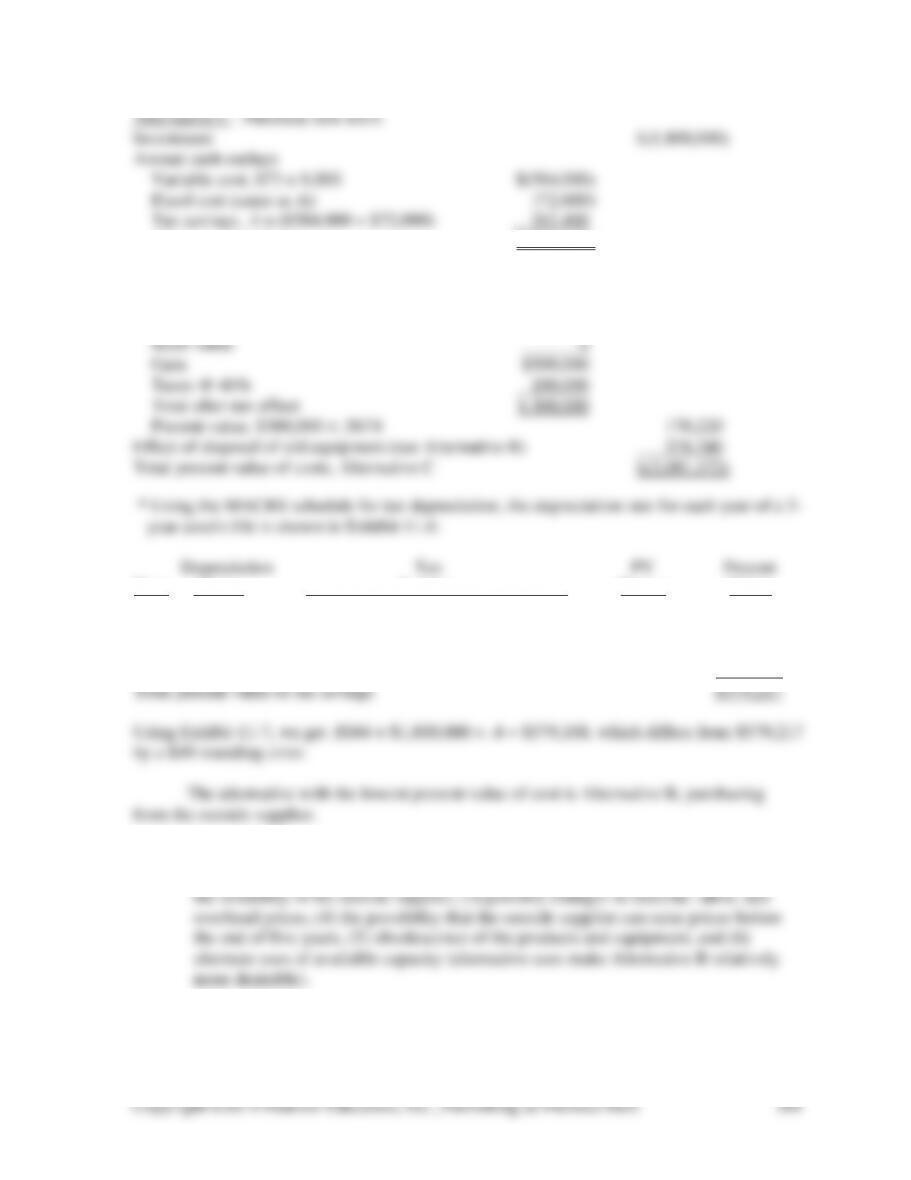
1. Alternative A: Continue to manufacture the parts with the current tools.
Annual cash outlays
Variable cost, $92 × 8,000 $(736,000)
Fixed cost, 1/3 × $45 × 8,000 × .6 (72,000)
Tax savings, .4 × ($736,000 + $72,000) 323,200
After-tax annual cost $(528,000)
Present value, $528,000 × 3.6048 $(1,903,334)
Sale of old equipment:
Sales price $ 400,000
Book value [(11.52% + 5.76%) × $2,000,000] 345,600
Copyright ©2014 Pearson Education, Inc., Publishing as Prentice Hall.
501
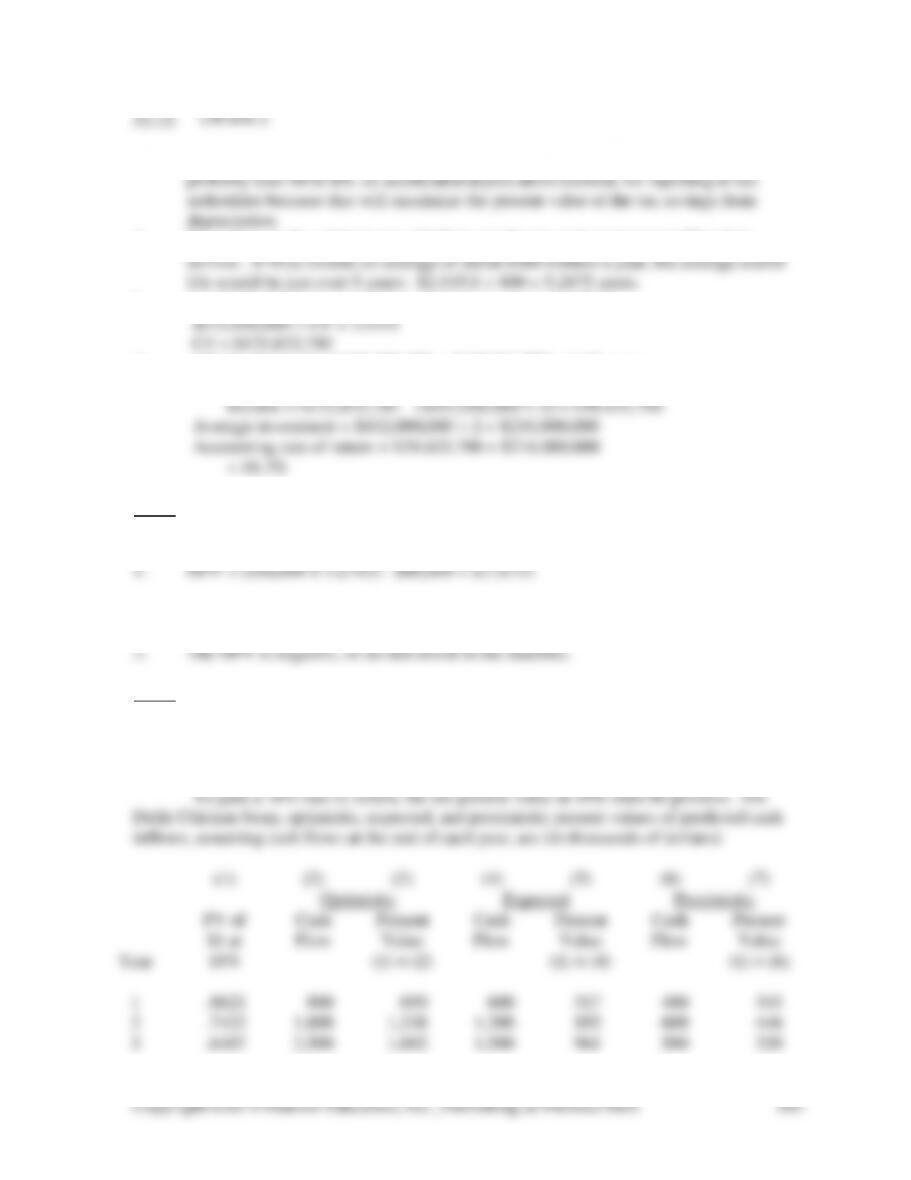
Alternative C: Purchase new tools
Investment $(1,800,000)
Annual cash outlays
Variable cost, $73 × 8,000 $(584,000)
Fixed cost (same as A) (72,000)
Tax savings, .4 × ($584,000 + $72,000) 262,400
After-tax annual cost $(393,600)
Present value, $393,600 × 3.6048 (1,418,849)
Tax savings on new equipment* 579,217
Effect of disposal of new equipment
Sales price $ 500,000
Year Rate Savings Factor Value
1 33.33% .3333 × $1,800,000 × .40 = $239,976 .8929 $214,275
2 44.45% .4445 × 1,800,000 × .40 = 320,040 .7972 255,136
3 14.81% .1481 × 1,800,000 × .40 = 106,632 .7118 75,901
4 7.41% .0741 × 1,800,000 × .40 = 53,352 .6355 33,905
2. Among the major factors are (1) the range of expected volume (both large increases
and decreases in volume make the purchase of the parts relatively less desirable), (2)
11-72 (30 min.)
1. From Note 1, Nike uses the straight-line method for reporting to shareholders. Nike
2. From Note 3, the original cost of Nike’s machinery and equipment is $2,115.0
3. Let CF be the minimum average annual pre-tax cash inflow:
4. a) Payback period = $432,000,000 ÷ $125,833,790 = 3.43 years
b) Accounting rate of return:
11-73 (20-30 min.) For the solution to this Excel Application Exercise, follow the step-by-
step instructions provided in the textbook chapter.
2. Payback period = $60,000 ÷ 16,000 = 3.75 years
11-74 (20 min.)
The purpose of this exercise is to see how financial analyses and behavioral and
ethical issues interact in decision making. We first present the NPV analysis that should
form the basis of Rossi’s meeting with Sharma. Then we discuss other items that are likely
to surface in the meeting.
4
.5523
4,000
2,209
2,200
1,215
400
221
5
.4761
5,000
2,381
2,600
1,238
200
95
Total
8,220
4,823
1,427
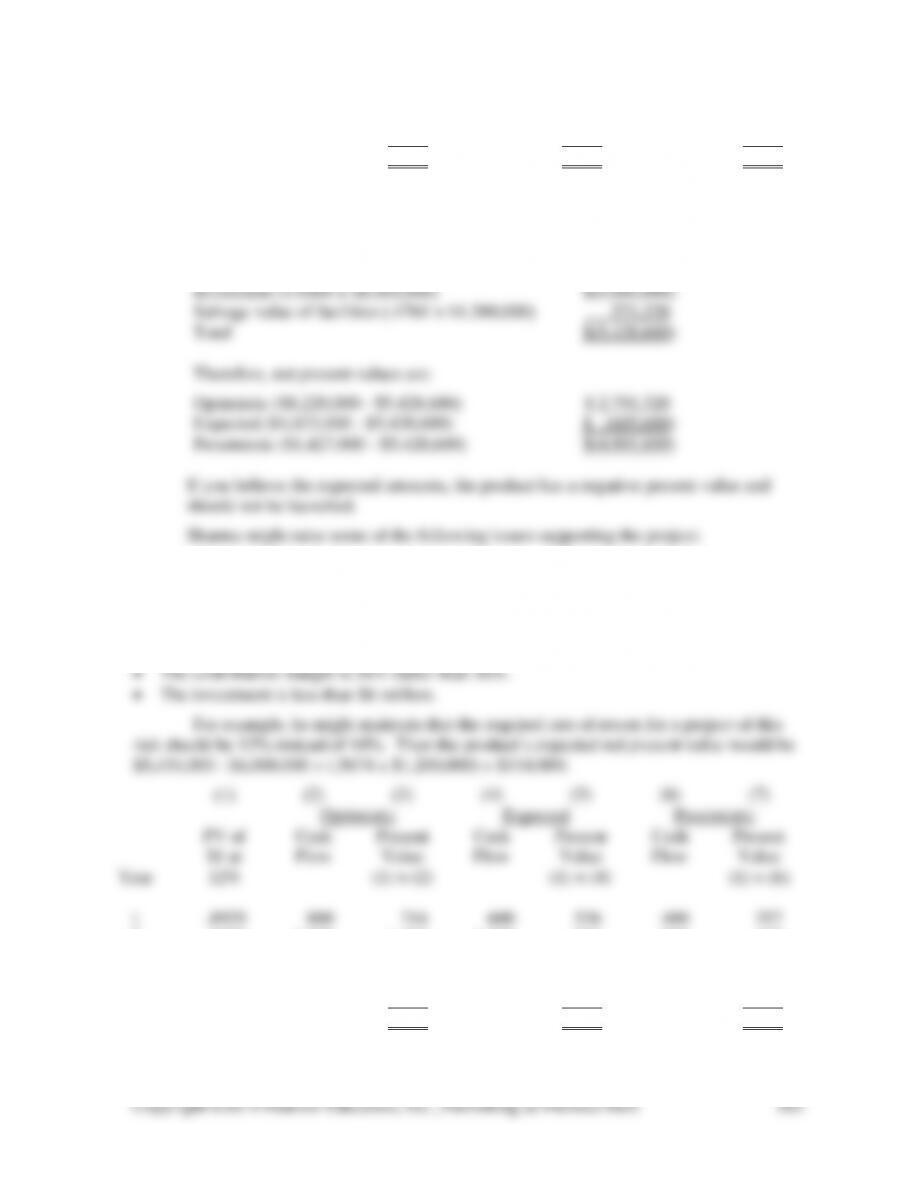
The investment and salvage values do not depend on the optimistic and pessimistic
forecasts:
• The required rate of return is less than 16%.
• The optimistic scenario is more likely than the pessimistic scenario, making the expected
cash flows more than those listed.
• The cash flow predictions for either the optimistic or pessimistic scenarios (or both) are
understated.
PV of
Cash
Cash
Cash
Year
12%
1
.8929
600
400
357
2
.7972
1,800
1,435
1,200
600
478
3
.7118
2,500
1,780
1,500
1,068
500
356
4
.6355
4,000
2,542
2,200
1,398
400
254
5
.5674
5,000
2,837
2,600
1,475
200
113
Total
9,308
5,434
1,558

Copyright ©2014 Pearson Education, Inc., Publishing as Prentice Hall.
504
Or he might maintain that each expected cash flow should be $200,000 higher,
making the net present value $4,823,000 + ($200,000 × 3.2743) – $5,428,680 = $49,180. Or,
if the contribution margin were 58% rather than 50%, the net present value would be
[$4,823,000 × (58/50)] – $5,428,680 = $166,000. Finally, if the investment is less than
$6,000,000 by at least $605,680, the net present value would be positive.
Sharma could use some combination of these changes to make the net present value
of the product positive.
The ethical issues in this exercise can be revealing. If Rossi believes her information
is accurate, it would be unethical to produce biased numbers just to satisfy Sharma. Among
the ethical requirements for management accountants are to “communicate information fairly
and objectively,” “disclose fully all relevant information,” and “prepare concise and clear
reports and recommendations after appropriate analyses of relevant and reliable
information.” These standards would be violated if Rossi were to change her analysis just to
satisfy Sharma.
Therefore, Rossi should report numbers that she believes are accurate. This may
11-75 (35-50 min.) NOTE TO INSTRUCTOR: This solution is based on the web site as it
1. Carnival Corporation operates 100 cruise ships under the following lines: Carnival
Cruise Lines, Holland America Line, Princess Cruises and Seabourn in North
business.
2. From Carnival’s 2011 Annual Report, its capacity (defined as available berths) has
increased each of the last five years:
Passengers Carried Passenger Capacity (# of berths)
3. Carnival continues to expand its fleet, though some of the new vessels will replace
4. In 2011, Carnival invested $2.7 billion in property and equipment, and Carnival used