Copyright ©2014 Pearson Education, Inc., Publishing as Prentice Hall.
428
10-38 (25 min.)
1. The two separate components highlight certain features of profitability that are
not revealed by the single calculation.
a. The importance of capital turnover as a key to profits is stressed.
2. Company
Adam Basil Collin
Return on sales 9% 12% .6%
Turnover on capital × 2.7 × .125 × 2.4
Return on investment 23.9% 1.5% 1.5%
Copyright ©2014 Pearson Education, Inc., Publishing as Prentice Hall.
429
investment simply by increasing its return on sales. In contrast, Collin’s
management should concentrate on increasing the return on sales.
3. Basil has a high return on sales and a low capital turnover strategy and probably
10-39 (15-20 min.)
1. (a) Entertainment $210 ÷ $1,050 = 20%
Publishing/Information 140 ÷ 700 = 20%
Consumer/Commercial Finance 265 ÷ 1,060 = 25%
2. This requirement can lead to a lengthy discussion of what causes differences in
the three measures computed in requirement 1. The obvious difference is the
segments.
10-40 (25 – 30 min.) Amounts in thousands.
Economic
Economic Value
Profit Added
1. Year 2 EVA = $4,463 – $3,569 – $292 – (11.5% × $2,854) = $274
Year 1 EVA = $4,510 – $3,615 – $255 – (11.5% × $2,689) = $331
2. EVA decreased from $331 million to $274 million. The decrease was caused by
1. Weighted-average cost of capital:
55% × 10% = 5.50%
2. Holt’s EVA of $3.8 billion means that Holt generated $3.8 billion of value for its
shareholders above the cost of capital, the weighted average of the normal return
10-43 (20-30 min.) Dollar amounts are in thousands.
Tools Appliances Lighting
Historical Cost:
Average net assets $15,000 $44,000 $27,000
Operating income 2,600 6,750 5,000
2. The following rankings exist:
Rate of Return Economic Profit
On On On On
3. In this case, if historical cost is the base, the use of rate of return on net assets
ranks Lighting first, whereas economic profit ranks Appliances first. Used
indiscriminately, each method has its drawbacks, regardless of whether historical
Copyright ©2014 Pearson Education, Inc., Publishing as Prentice Hall.
432
Replacement costs are more helpful than historical costs as indicators of the
relative profitability of divisions because they are usually good approximations
of the current economic sacrifice being made to conduct such operations. As for
managers, their ability to meet budgeted goals, however measured, is paramount.
Students, professors, and managers have disagreements regarding which asset
base is preferable.
10-44 (50-60 min.)
2. Some major companies, including du Pont and Monsanto Chemical, have used
gross assets as an investment base. One reason often cited for using
undepreciated cost is that it partially compensates for the impact of the changing
price level on historical cost. However, if a company desires to use replacement
cost as a base, it should not try to tailor historical costs to the measurement
measured by depreciation.) To count original cost plus the cash accumulation as a
part of the investment base (column 10) is duplication; it does not provide as
useful a base as net assets. In contrast, a plant manager’s or division manager’s
performance often is best analyzed by using gross assets as the investment base
(column 6). The reinvestment of the cash accumulation in the amount of
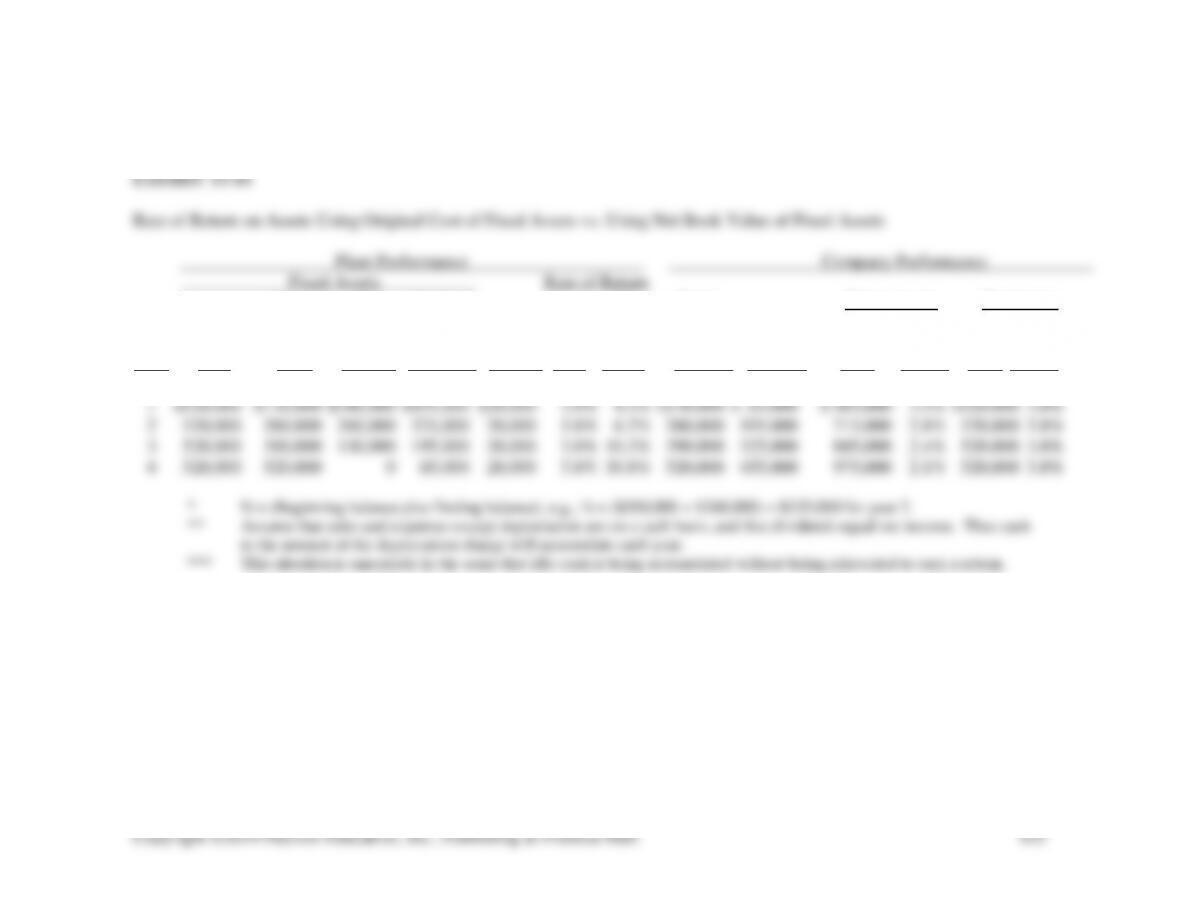
Accumu- Net Average On Total Gross Assets Net Assets
lated Value, Book Annual On Average Cash Average***
Gross Depreci- End Value Net Gross Book Accumu- Cash Rate of Rate of
Year Cost ation of Year for Year* Income Cost Value lation** for Year Base Return Base Return
(1) (2) (3) (4) (5) (6) (7) (8) (9) (10) (11) (12) (13)
Copyright ©2014 Pearson Education, Inc., Publishing as Prentice Hall.
434
The proponents of using net book value as a base maintain that it is less confusing
because (a) it is consistent with the total assets shown on the conventional balance
sheet and (b) it is consistent with net income computations, which include
deductions for depreciation. Using net book value prevents duplication of the
same asset in the base and shows a constantly rising rate of return on plant
performance. See column 7. Note that the inclusion of the cash accumulation and
gross fixed assets duplicates the same item, so that the total fixed and current
10-45 (30-40 min.)
The issues in this problem are covered briefly in a section in the chapter. This
problem was originally used on a final examination. In particular, note that the quotation
is dealing with how to evaluate performance, as distinguished from decisions to buy,
1. Economic values are the best for performance measurement.
3. Market (exit) value is inherently less than or equal to (usually the former)
economic value for a given asset.
5. Replacement value will facilitate the evaluation of the division’s performance
more easily than the division manager’s performance.
The statement correctly establishes economic value as the “ideal” measure of an asset’s
value. The statement fails to disclose the characteristics of economic value that make it
Copyright ©2014 Pearson Education, Inc., Publishing as Prentice Hall.
435
in the future and (b) the appropriate discount rate to be applied to those flows in the
present value process.
The statement presents a reasonable case in favor of replacement value over exit
value.
Some remarks might be made about the fact that replacement costs of highly
specialized assets may be more difficult to obtain than a direct approximation of their
economic values via discounted cash flow techniques.
The biggest defect of the commentary is its failure to mention the cost and value
of information tradeoffs in deciding whether some “current” value basis for evaluation of
performance is superior to continuing to use historical cost.
10-46 (20-30 min.)
The rule to be used is that goods and services should be transferred at a price
equivalent to that prevailing in an outside market at the time of transfer. Where the
internal division meets these selling prices, the buying division must purchase internally.
10-47 (30 min.)
$42.70 price is met. If the shocks and struts division does not sell to the
automotive division, 70% of the strut assembly volume will disappear, and gross
margin will fall to $2,550,000 as follows:
Sales, 300,000 at $61 $18,300,000
Variable costs, at $38.50 $11,550,000
2. Yes, the division should reject intracompany sales and concentrate on outside
sales since the gross margin would be $8,300,000, whereas the gross margin if
automotive division business were accepted would be $5,490,000. The gross
10-48 (30 min.)
1. The U.S. Division should not supply the Australian Division with the sound
system for the $7.00 per unit price. The U.S. Division is operating at capacity and
for $62.00. Assuming that the $10.00 per unit for fixed overhead and
administration is an allocation of costs the Australian Division incurs regardless
3. In the short run there is an advantage to Samtech Electronics of transferring the
sound system at the $7.00 price and thus selling the Game Box for at least $62.00.
To make this happen, Samtech Electronics could overrule the decision of the U.S.
$56.60. As long as the Australian Division has excess capacity, its profit would
increase by at least $5.40 (i.e., $62.00 – $56.60) per Game Box. Therefore, both
10-49 (20-25 min.)
1. The Eugene Division manager would not buy the lumber for $70 and would not
produce the chairs. The division would lose $4 on each chair produced at that
price:
Revenue per chair $95
Division cost per chair:
2. When there is no idle capacity at the Shasta Mill, transferring lumber to the
Eugene Division causes the Mill to pass up sales to outside customers. Compare
the total contribution from selling the lumber to the total contribution from using
the lumber to build chairs and selling the chairs: