
170
©2014 Pearson Education, Inc.
Chapter 9
Properties and Applications of the Competitive Model
Chapter Outline
9.1 Zero Profit for Competitive Firms in the Long Run
Zero Long-Run Profit with Free Entry
Zero Long–Run Profit when Entry Is Limited
Application: Tiger Woods’ Rents
The Need to Maximize Profit
9.2 Producer Surplus
Measuring Producer Surplus Using a Supply Curve
Using Producer Surplus
Solved Problem 9.1
9.3 Competition Maximizes Welfare
Measuring Welfare
Why Producing Less Than the Competitive Output Lowers Welfare
Why Producing More Than the Competitive Output Lowers Welfare
Application: The Deadweight Loss of Christmas Presents
9.4 Policies That Shift Supply Curves
Entry Barrier
Exit Restriction
9.5 Policies That Create a Wedge Between Supply and Demand Curves
Welfare Effects of a Sales Tax
Welfare Effects of a Price Floor
Alternative Price Support
Solved Problem 9.2
Application: How Big Are Farm Subsidies and Who Gets Them?
Welfare Effects of a Price Ceiling
Solved Problem 9.3
Application: The Social Cost of a Natural Gas Price Ceiling
9.6 Comparing Both Types of Policies: Trade
Free Trade Versus a Ban on Imports
Solved Problem 9.4
Free Trade Versus a Tariff

Chapter 9 Properties and Applications of the Competitive Model 171
©2014 Pearson Education, Inc.
Solved Problem 9.5
Free Trade Versus a Quota
Rent Seeking
Teaching Tips
The material in Chapter 9 represents a series of applications of the competitive model to government policies
that alter the equilibrium and so also reduce overall welfare. Many of the concepts presented here, such as
deadweight loss, are needed later in the course. Thus the time spent here will pay dividends later.
While the concept of consumer surplus is straightforward because all students are consumers, you may need
to spend a bit more time on the concept of producer surplus. The advantage here is the direct link between
producer surplus and profit; the disadvantage is that they are not equal in the short run.
It is important to cover the section on deadweight loss for two reasons. First, it drives home the point that
competitive markets are efficient and that any divergence from the competitive equilibrium results in some
level of inefficiency. Second, looking ahead to monopoly, the introduction of deadweight loss due to prices
above equilibrium levels will be important in future chapters. To ensure that these concepts are clear, you
may want to walk the class through Figures 9.3 and 9.4. Students weak in geometry are likely to struggle
with the graphs in this chapter and may need extra help sorting out which areas are transferred from
consumers to firms, which are part of deadweight loss and which are not.
The remainder of the chapter is devoted to the three fundamental ways in which government intervention
affects welfare restrictions on the number of firms (entry and/or exit barriers); taxes and tariffs; and quotas,
floors, and ceilings. Begin this section by asking students which of these government policies are beneficial.
Although most students will accept the fact that at an individual level it depends on who you are, it often
leads to a good discussion on the merits of protectionism or of preserving the family farm through price
supports. When discussing the welfare effects of taxes, you may want to emphasize the point made in the
text that the source of the welfare loss is not the tax revenue itself. Even if all of the tax revenue is used to
increase welfare in other markets with no administrative cost, there is still a deadweight loss in the taxed
market due to the divergence from a competitive equilibrium. This point underscores the normative nature
of taxation. The text has several good examples of agricultural price supports in the United States and in
Europe that are worth spending some class time discussing. American students are usually surprised at the
levels of agricultural subsidies in Europe.
The previous discussion of tariffs and price floors is a good lead–in to the final section on rent–seeking
behavior. In Ross Perot’s 1996 unsuccessful presidential bid, he routinely addressed this issue, noting that
large corporations spent huge sums of money to walk the halls of Congress lobbying for their causes
because the gains are concentrated. Yet consumers have no such representation because the gains are small
for an individual consumer.
As an additional example of government’s limiting entry, there is the case of street food vendors in Philadelphia.
These vendors set up food carts on corners throughout the downtown section of the city. Turf battles between
cart owners over prime locations became such a problem that the city government considered instituting a
lottery to reallocate vacated corners among competing carts rather than allow more than one cart to attempt
to occupy the same location (economic competition).

172 Perloff • Microeconomics: Theory and Applications with Calculus, Third Edition
©2014 Pearson Education, Inc.
Additional Applications
Milk Prices—Reducing a Price Floor1
Every month, the Pennsylvania Milk Marketing Board sets prices to farmers for milk. These prices are
based on costs of transportation, packaging, shipping, and other costs. The final calculated price becomes
the minimum that farmers are guaranteed per hundred pounds of milk. This method of setting price floors
has been in place for over 60 years, and in some ways has very little to do with the supply and demand for
milk in Pennsylvania. For example, the formula price is based partly on the price of cheese in Wisconsin.
The final price does, however, include some level of market input, as it reflects input from local milk
retailers. Milk Marketing Board spokesperson Tracey Jackson indicates that it’s done through a hearing
process. Testimony is given by dealers and stores and the Milk Marketing Board. The board takes into
account packaging, processing, union contracts—anything that is necessary for the processing of milk. The
set price is the wholesale price, not the one paid by consumers. Consumers are charged retail prices that
fluctuate based on local demand.
The existence of price floors means that many farmers who could not survive at competitive market wholesale
prices are able to remain profitable. In April 1999, the price floor was decreased more than 30 percent. The
change in prices sparked anger and frustration among some local dairy farmers and resignation among
others. One Pennsylvania farmer, Russell Dietrich, said, “(T)he whole farm economy is going in the same
direction. Grain prices were the first to go, then pork. I think it’s supply and demand that’s doing it.” But
dairy farmer Hubert Sell observed, “You have to be ready to weather the low points. You have to save
when times are good.”
The reduction in price prompted state legislators to consider increasing the minimum price to reduce the
uncertainty faced by farmers. Two letters to the editor of The Morning Call are indicative of the widely
divergent opinions and understanding of the economics of price supports. One stated in part, “(W)ith even
higher prices, farmers will increase the size of their herds. This will produce an even larger glut of milk on
the market. . . . ” Another read, “I don’t know why the government, or whoever, is lowering milk prices.
Dairy farmers and potato farmers, as well as other farmers, are always picked on. . . . Now they are about
to take their profit margin away. I think it’s a disgrace.”
1. If the price falls to the new minimum, what does that imply about the true equilibrium price
(the unsupported price)?
2. How might the Milk Board change its pricing formula to reflect cost more accurately?
Discussion Questions
1. What are the strengths and weaknesses of the measure of welfare used by many economists:
consumer welfare plus producer surplus?
2. Why might a society prefer a government policy that lowers our standard measure of welfare?
Give some examples.
3. Give some examples of products that are likely to have little if any consumer surplus and explain why.
4. Give some examples of products that are likely to have little if any producer surplus and explain why.
1Chris Peter, “Milk Prices Make Buyers Smile and Farmers Fume,” The Morning Call, March 21, 1999, B1 and B10. Also, Letters
to the Editor, The Morning Call, from April 14, 1999 and May 8, 1999.

Chapter 9 Properties and Applications of the Competitive Model 173
©2014 Pearson Education, Inc.
5. Should the government subsidize farmers? What do you predict would happen if all subsidies were
eliminated?
6. Sales taxes cause a deadweight loss. Are there other taxes that could raise as much revenue but cause
less harm?
7. How important is rent seeking in your country? Do you think rent seeking is more or less important in
developing countries or developed countries? Why?
Additional Questions and Problems
1. Demand in Market 1 for X is Qd = 80 − p. Demand in Market 2 is Qd = 120 − 2p. At a price of $20,
which has a larger consumer surplus?
2. True or false; explain your answer. Producer surplus and profits are always equal, since they mean
the same thing.
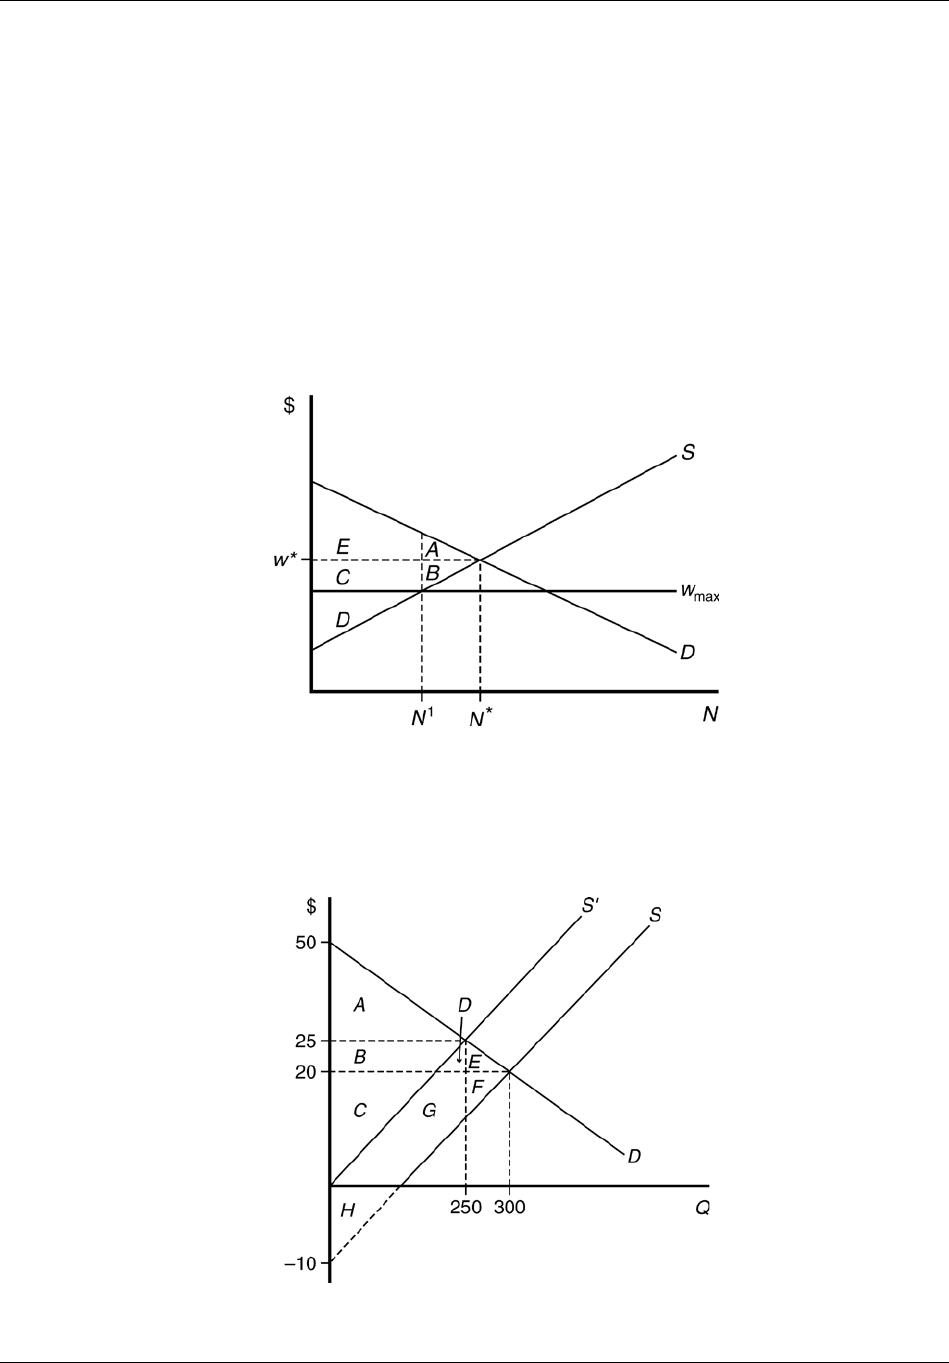
3. Suppose instead of a minimum wage, the government instituted a maximum wage (set below the
equilibrium) in the unskilled labor market. Show the welfare effects of this cap on the market using
a graph.
4. If demand in the cake market is Qd = 500 − 10p, and unrestricted supply is Qs = 100 + 10p, what is
the effect on price, quantity, producer, and consumer surplus of a baker’s license that reduces cake
supply to Q′
s = 10p?
5. True or false; explain your answer. I bought three identical hats because the price was $10 each and
that’s how much each is worth to me.
6. Philadelphia Flyers games are frequently sold out, and a waiting list exists for the right to purchase
season tickets. What would be the welfare effects of a $1 tax on tickets? Explain.
7. Suppose that by coincidence two markets for separate products had the same demand and supply
functions. In each market, Qd = 50 − p, and Qs = p. The government decides to discourage
consumption in both markets. It institutes a $4 per unit tax in one market, and a quota of 23 units
in the other market. Are the welfare effects of these policies equal? Explain.
8. If marginal cost is constant at $5 for all firms, what is the value of producer surplus?
9. Suppose the government decides to subsidize exercise by $2 for every mile (Q) consumers run at a
health club that charges by the mile. The current demand for running is Q = 12 − 2P. The supply of
miles available by the track owners is S = 2P. What is the initial equilibrium price and quantity? How
does the subsidy affect the total number of miles run? What is the new price, including the subsidy?
10. The NFL’s championship game, called The Super Bowl, is played at a neutral site. Home team fans
must put their names into a lottery for a chance to buy tickets to the game. Winners then purchase
tickets at the stated price. Explain why this allocation mechanism does not maximize total fan welfare.
11. In the application Deadweight Loss of Christmas Presents, explain how giving gifts with a gift receipt
changes the welfare.
174 Perloff • Microeconomics: Theory and Applications with Calculus, Third Edition
©2014 Pearson Education, Inc.
12. Suppose the demand curve for a good is Q = 9 − p and the supply curve is Q =
2p. The government
imposes a specific tax of
τ
= 1 per unit. What would be the equilibrium? What effect does the tax
have on consumer surplus, producer surplus, and deadweight loss?
Answers to Additional Questions and Problems
1. Surplus in Market 1 is $180 but only $160 in Market 2.
2. This statement is true in the long run when there are no fixed costs, but false in the short run since
PS = R − VC.
3. When the maximum wage is imposed, employment falls from N* to N′, producer surplus falls from C
+ D + B, to D, and consumer surplus changes from E + A to E + C. The welfare change is −(A + B).
4. When the baker’s license is instituted, the supply curve shifts upwards by $100. Quantity falls from
300 to 250, price increases from $20 to $25, and consumer and producer surplus each fall from
$4,500 to $3,125. See the figure below. Initially, consumer surplus is A + B + D + E, and producer
surplus is C + F + G + H. After the policy goes into effect, consumer surplus is A, and producer
surplus is B + C.