
Solutions to the End-of-Chapter Questions, Problems, and Data
Exercises
5.1 The Risk Structure of Interest Rates
Learning objective: Explain why bonds with the same maturity can have different interest rates.
Review Questions
1.1 The risk structure of interest rates is the relationship among the interest rates on bonds that have
1.2 A bond issuer’s creditworthiness is the projected ability of a company’s or a government’s
1.3 Investors favor liquidity, so a bond that is not liquid would have less demand compared to an
equivalent bond with more liquidity. Lower demand means a lower price for the illiquid bond
1.4 There are two types of income an investor can earn on a bond:
1. Interest income from coupons. Coupon payments, when taxed, are taxed at the individual
2. Capital gains or losses from price changes. Capital gains, in 2013, were taxed at a lower rate
1.5 The bond issued by Houston is a municipal bond, and its coupons are not subject to federal,
Problems and Applications
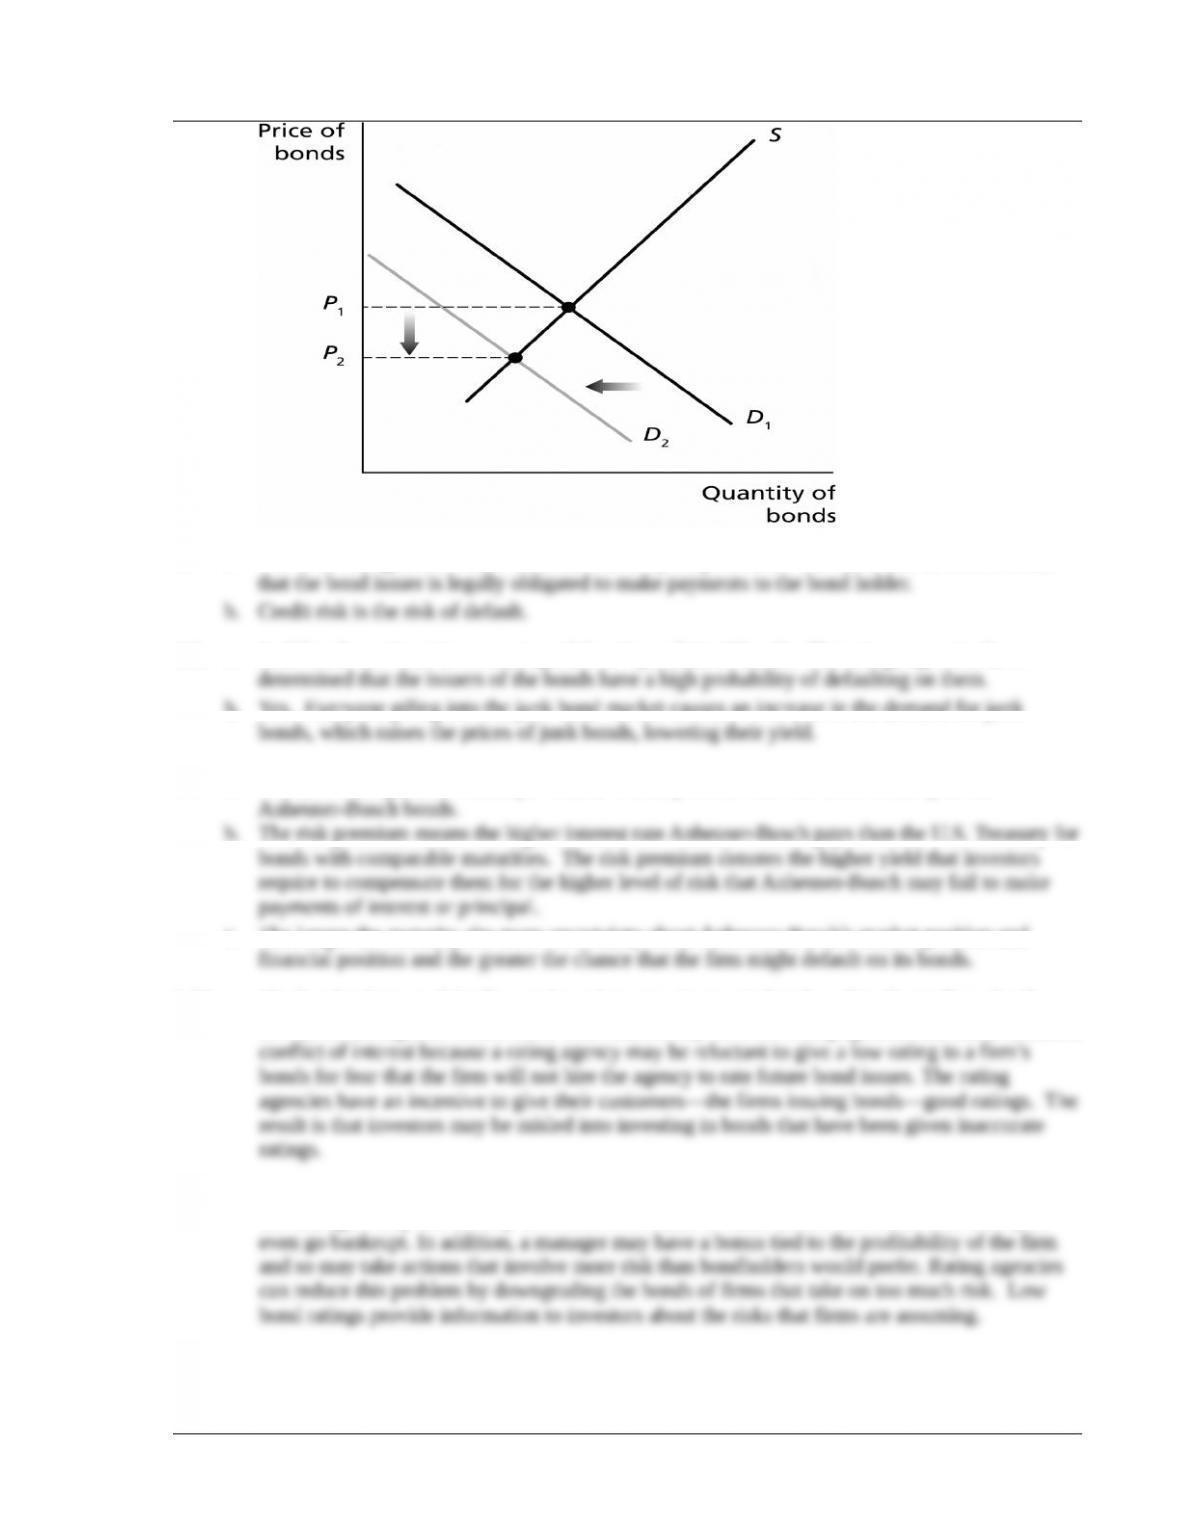
1.6 When a company’s rating is lowered and investors in financial markets agree with the change in
© 2014 Pearson Education, Inc.
Chapter 5 The Risk Structure and Term Structure of Interest Rates 54
1.7 a The term “obligations” refers to bonds issued by corporations. The name comes from the fact
1.8. a. Junk bonds are “non-investment grade” or “speculative” bonds. The ratings agencies have
b. Yes. Everyone piling into the junk bond market causes an increase in the demand for junk
1.9 a. The term “comparable Treasurys” means Treasury bonds with the same maturity as the
b. The risk premium means the higher interest rate Anheuser-Busch pays than the U.S. Treasury for
c. The longer the maturity, the more uncertainty about Anheuser–Busch’s market position and
1.10 The bond ratings model relies on the rating agencies to rate bonds and to charge firms for the
service of having their bonds rated. This relationship between rating agencies and firms creates a
1.11 Managers of firms may have more incentive to take risk than bondholders would desire because
the managers may not directly have their own funds at stake should their firms lose money or
© 2014 Pearson Education, Inc.
Chapter 5 The Risk Structure and Term Structure of Interest Rates 55
1.12 Taxing the coupon reduces the after-tax coupon the bond purchaser receives. A lower after-tax
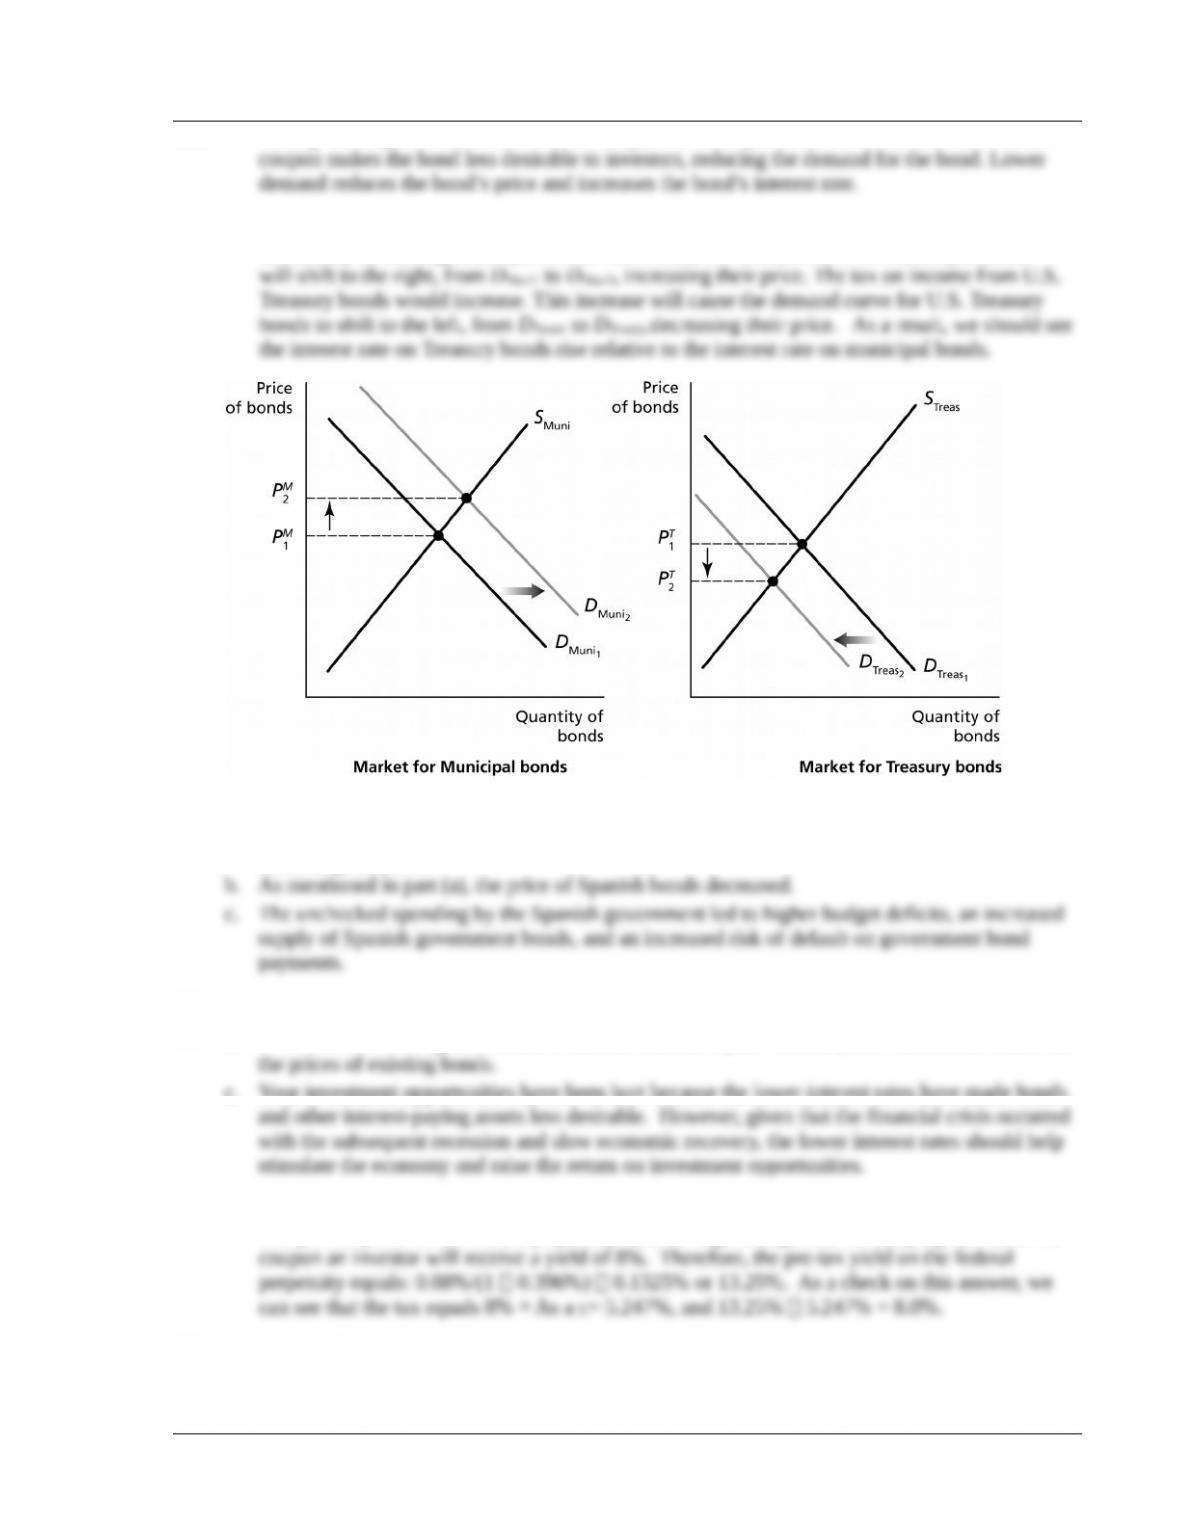
1.13 The rise in the top marginal tax rate on the federal personal income tax would increase the
desirability of holding municipal bonds. As a result, the demand curve for municipal bonds
1.14 a. The demand for Spanish bonds was decreasing, which decreased the price of Spanish bonds,
increasing the yield.
1.15 a. Many investors responded by seeking higher yields in junk bonds.
b. Your portfolio of long-term bonds would have been helped. The drop in interest rates increased
c. Your investment opportunities have been hurt because the lower interest rates have made bonds
1.16 The coupon on the state bond will not be subject to tax, so its pre-tax yield will also be 8%.
The pre-tax yield on the federal perpetuity must be high enough that after paying the tax on the
5.2 The Term Structure of Interest Rates
© 2014 Pearson Education, Inc.
Chapter 5 The Risk Structure and Term Structure of Interest Rates 56
Learning objective: Explain why bonds with different maturities can have different interest rates.
Review Questions
2.1 The term structure of interest rates is the relationship among the interest rates on bonds that are
2.2 The three key facts about the term structure are:
1. Interest rates on long-term bonds are usually higher than interest rates on short-term bonds.
2.3 The three theories of the term structure are:
1. Expectations theory: Assumes that investors have the same investment objective of receiving
the highest expected return on their bond investments and that, for a given holding period,
2. Segmented market theory: Assumes that investors have different investment objectives and
3. Liquidity premium theory: Assumes that investors view bonds of different maturities as
Problems and Applications
2.4 Consider what a $1,000 investment in each option would equal after three years:
Option (a): ($1,000)(1.08)(1.11)(1.07) $1,282.72
2.5 Option (a); $1,000(1.06)4 $1,262.48
2.6 2-year: (1% 2%)/2 1.5%
© 2014 Pearson Education, Inc.
Chapter 5 The Risk Structure and Term Structure of Interest Rates 57
2.7 Expectations theory indicates that an investor should expect to receive the same return from
buying a 30-year bond or 30 one-year bonds during that 30-year period. In this case, if the
2.8 The yield to maturity equals ($1,000 – $1,010)/$1,010 = 0.01% or 1%. Expected inflation
2.9 A carry trade (interest carry trade) refers to borrowing at a low short-term interest rate and using
the borrowed funds to invest at a higher long-term interest rate. With the expectations theory, the
2.10 If the expectations theory is correct, then the Treasury’s borrowing cost would be the same
whatever mix of bills, notes, and bonds they issue. Although the Treasury would appear to gain
from paying the lower interest rate on Treasury bills, the fact that the interest rates on notes and
2.11 First, we need to calculate the interest rate expected on the one-year Treasury bill in one year:
i1t+1
e
Then, we can answer the problem by calculating the interest rate that investors are expecting on
the one-year Treasury bill in two years:
i1t+2
e
Chapter 5 The Risk Structure and Term Structure of Interest Rates 58
2.13 The other type of risk with long-term corporate bonds at low interest rates is the risk that interest
2.14 The prices of short-term Treasury securities rose and the prices of long-term Treasury securities
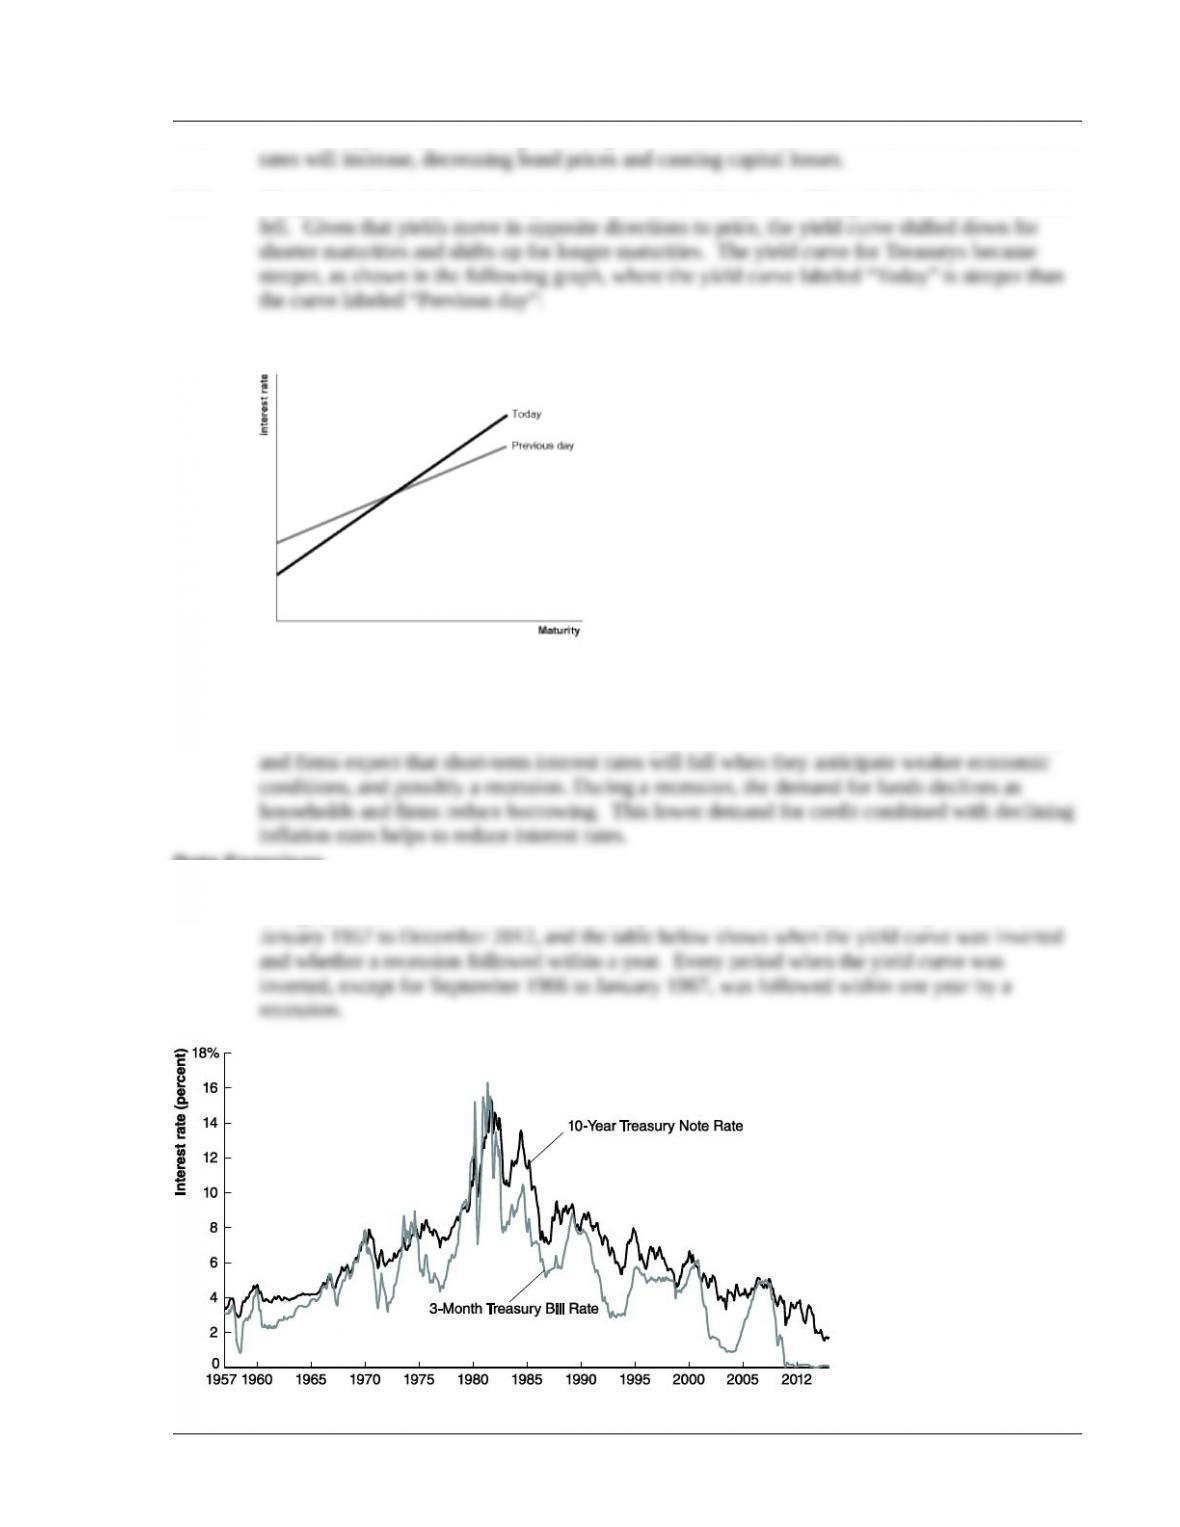
2.15 An inverted yield curve implies weak economic conditions. According to expectations theory, an
inverted yield curve indicates that investors expect short-term interest rates to fall. Households
Data Exercises
D5.1 The yield curve is inverted when 3-month Treasury bill rates exceed 10-year Treasury note rates.
The graph below shows the 3-month Treasury bill rate and the 10-year Treasury note rate from
© 2014 Pearson Education, Inc.
Chapter 5 The Risk Structure and Term Structure of Interest Rates 59
Date Yield Curve Was Inserted Recession within One Year?
D5.2 The yield curve on January 18, 2013 is upward sloping with the 1-month Treasury bill rate equal
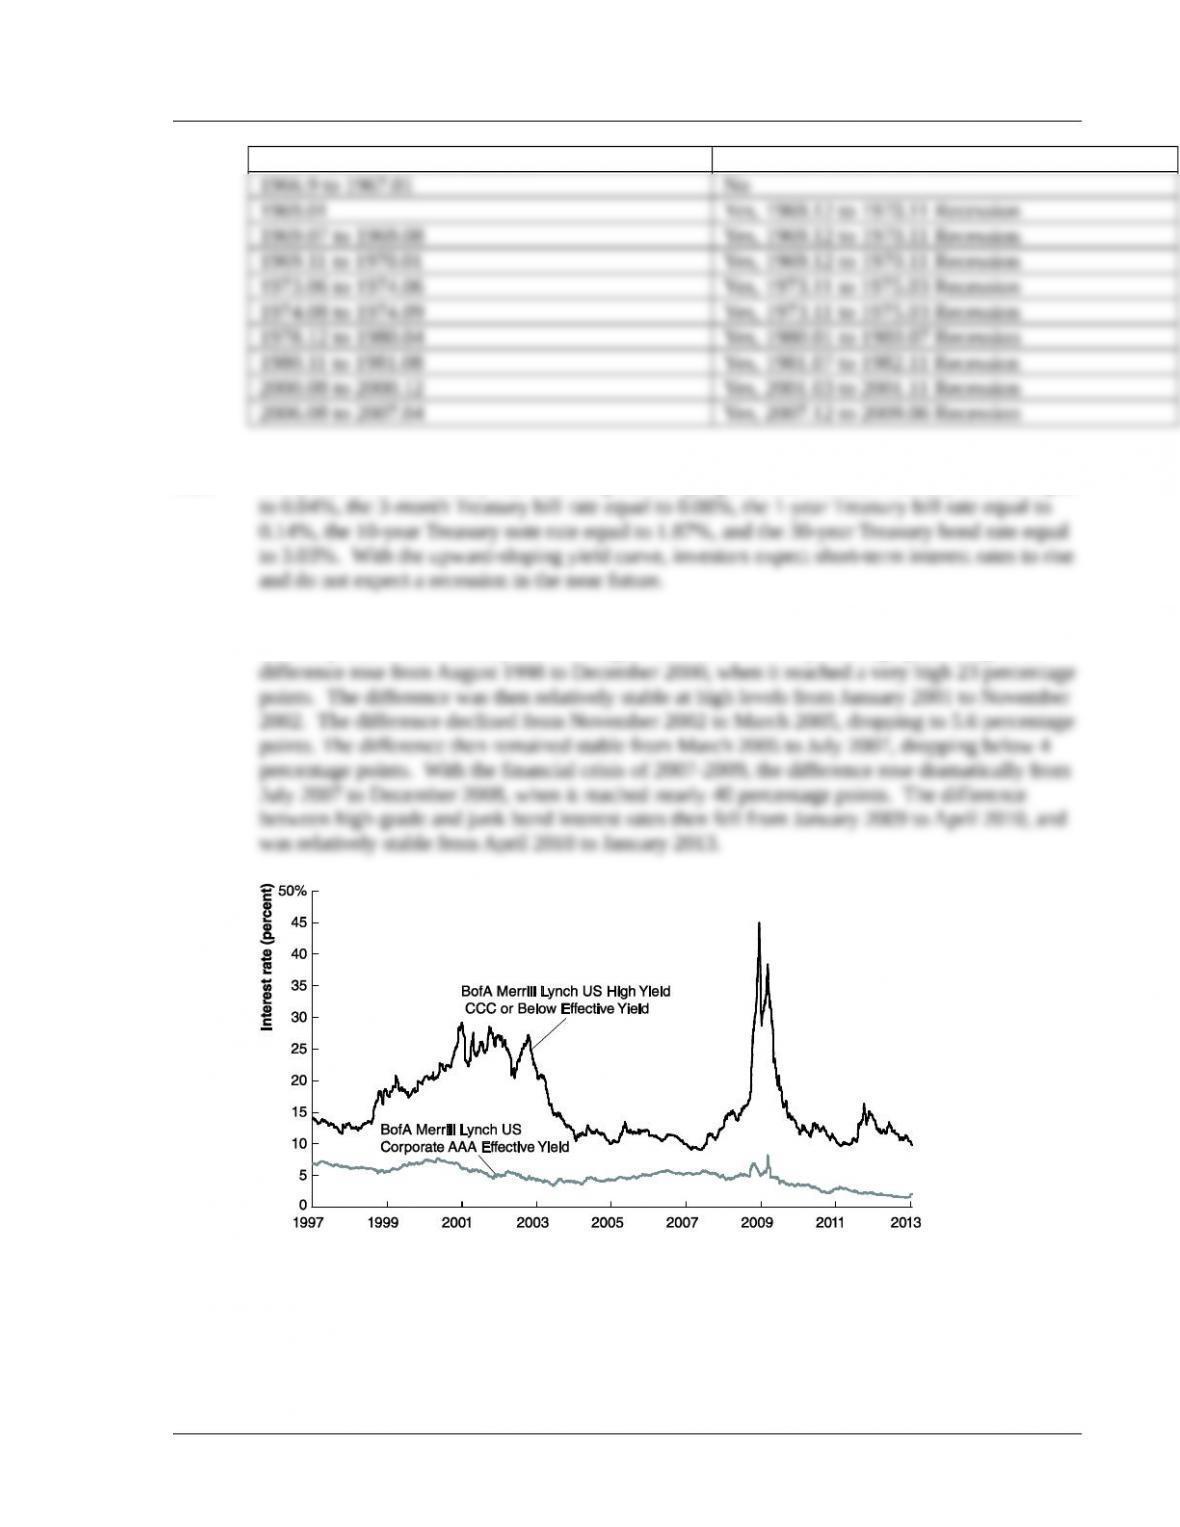
D5.3 The difference between the yields on high-grade corporate bonds and on junk bonds was
relatively stable from January 1997 to August 1998 in the 5 to 7 percentage-point range. The
© 2014 Pearson Education, Inc.