Solutions to the End-of-Chapter Questions, Problems, and Data
Exercises
4.1 How to Build an Investment Portfolio
Learning objective: Discuss the most important factors in building an investment portfolio.
Review Questions
1.1 There are five determinants of asset demand: 1) The amount of wealth a saver has, 2) the expected
rate of return on an asset compared with the expected return on other assets, 3) the comparative risk
1.2 The expected return is the rate of return expected on an asset during a future period. Risk is the
1.3 The higher the risk that an asset has, the lower the demand for the asset, which raises the yield or
1.4 Market risk is the risk that is common to all assets of a certain type because of shared economic
conditions. Idiosyncratic risk is the risk that pertains to a particular asset, such as an individual
Problems and Applications
1.5 a. “Bet the house on hot performers” is the opposite of diversifying. The phrase means placing
1.6 A black swan event is an event that happens very rarely that has a large impact on society. Black
1.7 a. The shorter the period of time before someone intends to use funds, the more the investor has
4.2 Market Interest Rates and the Demand and Supply for Bonds
Learning objective: Use a demand and supply model to determine market interest rates for bonds.
© 2014 Pearson Education, Inc.
Chapter 4 Determining Interest Rates 37
Review Questions
2.1 The demand curve for bonds will shift to the left when any of following occurs:
1. Wealth decreases.
2. The expected returns on bonds relative to other assets decreases.
The supply curve for bonds will shift to the right when any of the following occurs:
1. The expected profitability of physical capital investments increases.
2.2 The bond supply curve slopes up because as the price of bonds increases, their interest rates will fall,
and holders of existing bonds will be more willing to sell them. Also, firms will find it less
Problems and Applications
2.4 a. False: The quantity demanded of bonds falls when the price of bonds increases because the interest
rate falls, which makes the bonds less desirable to investors.
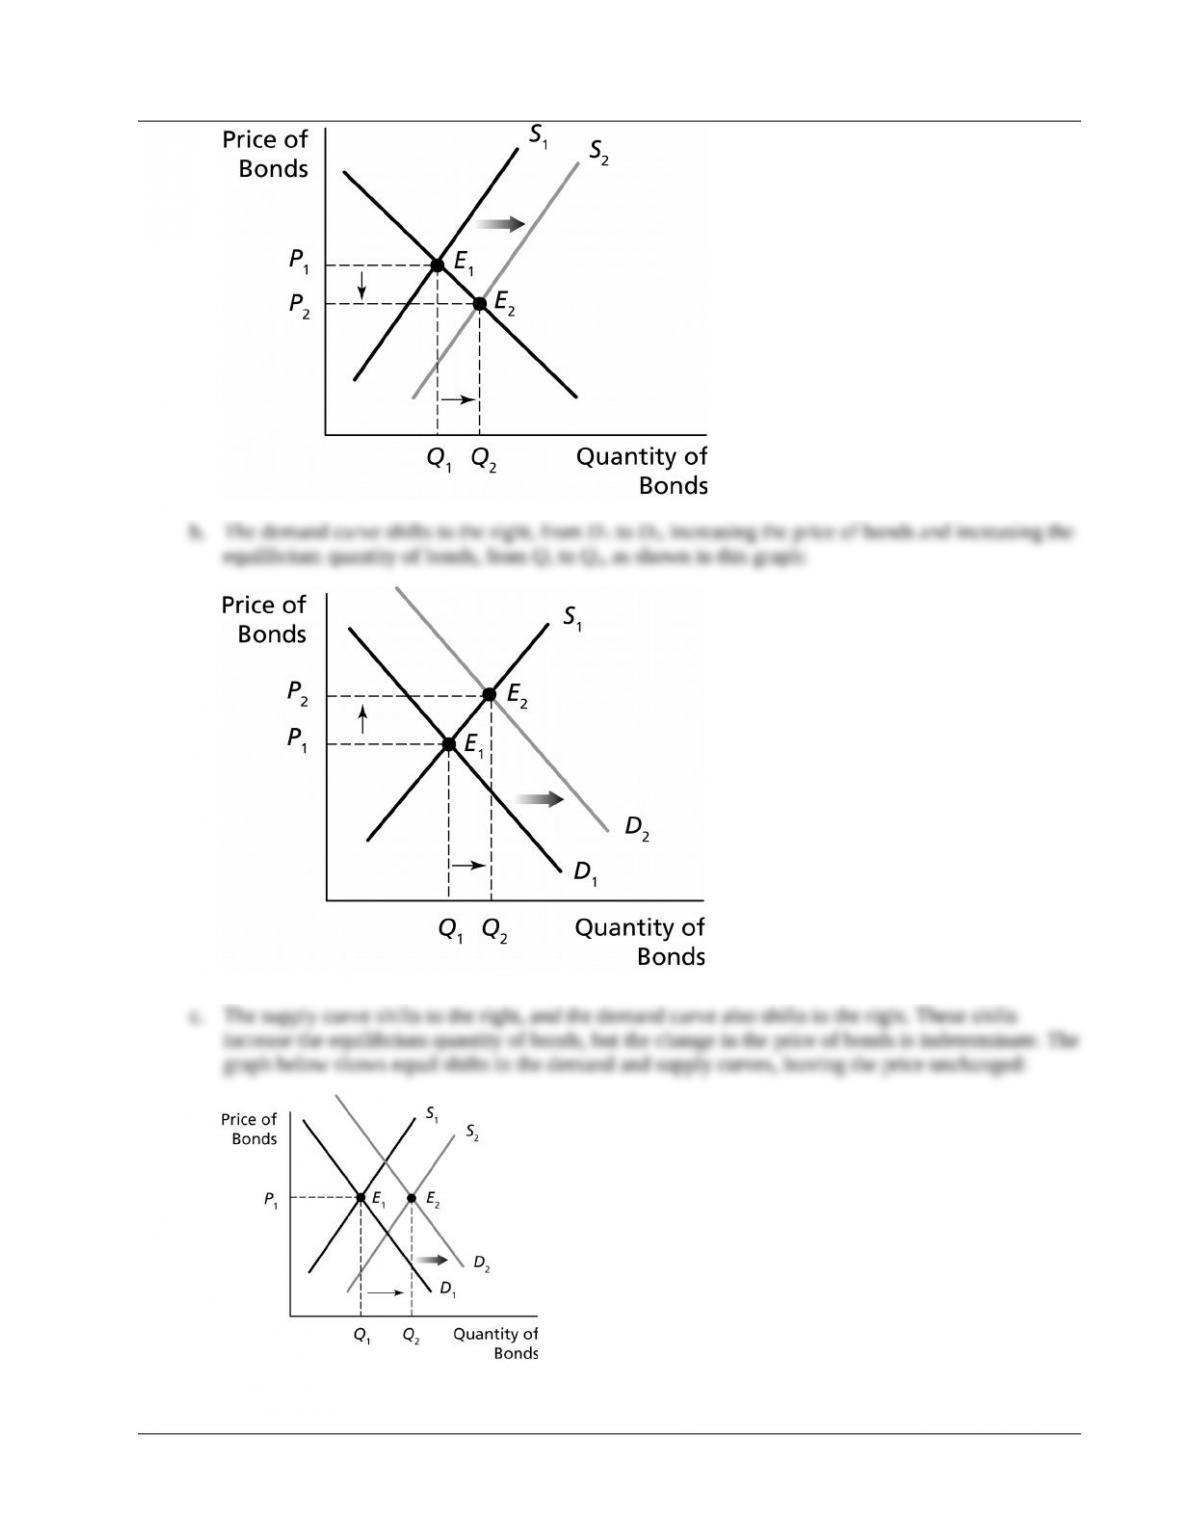
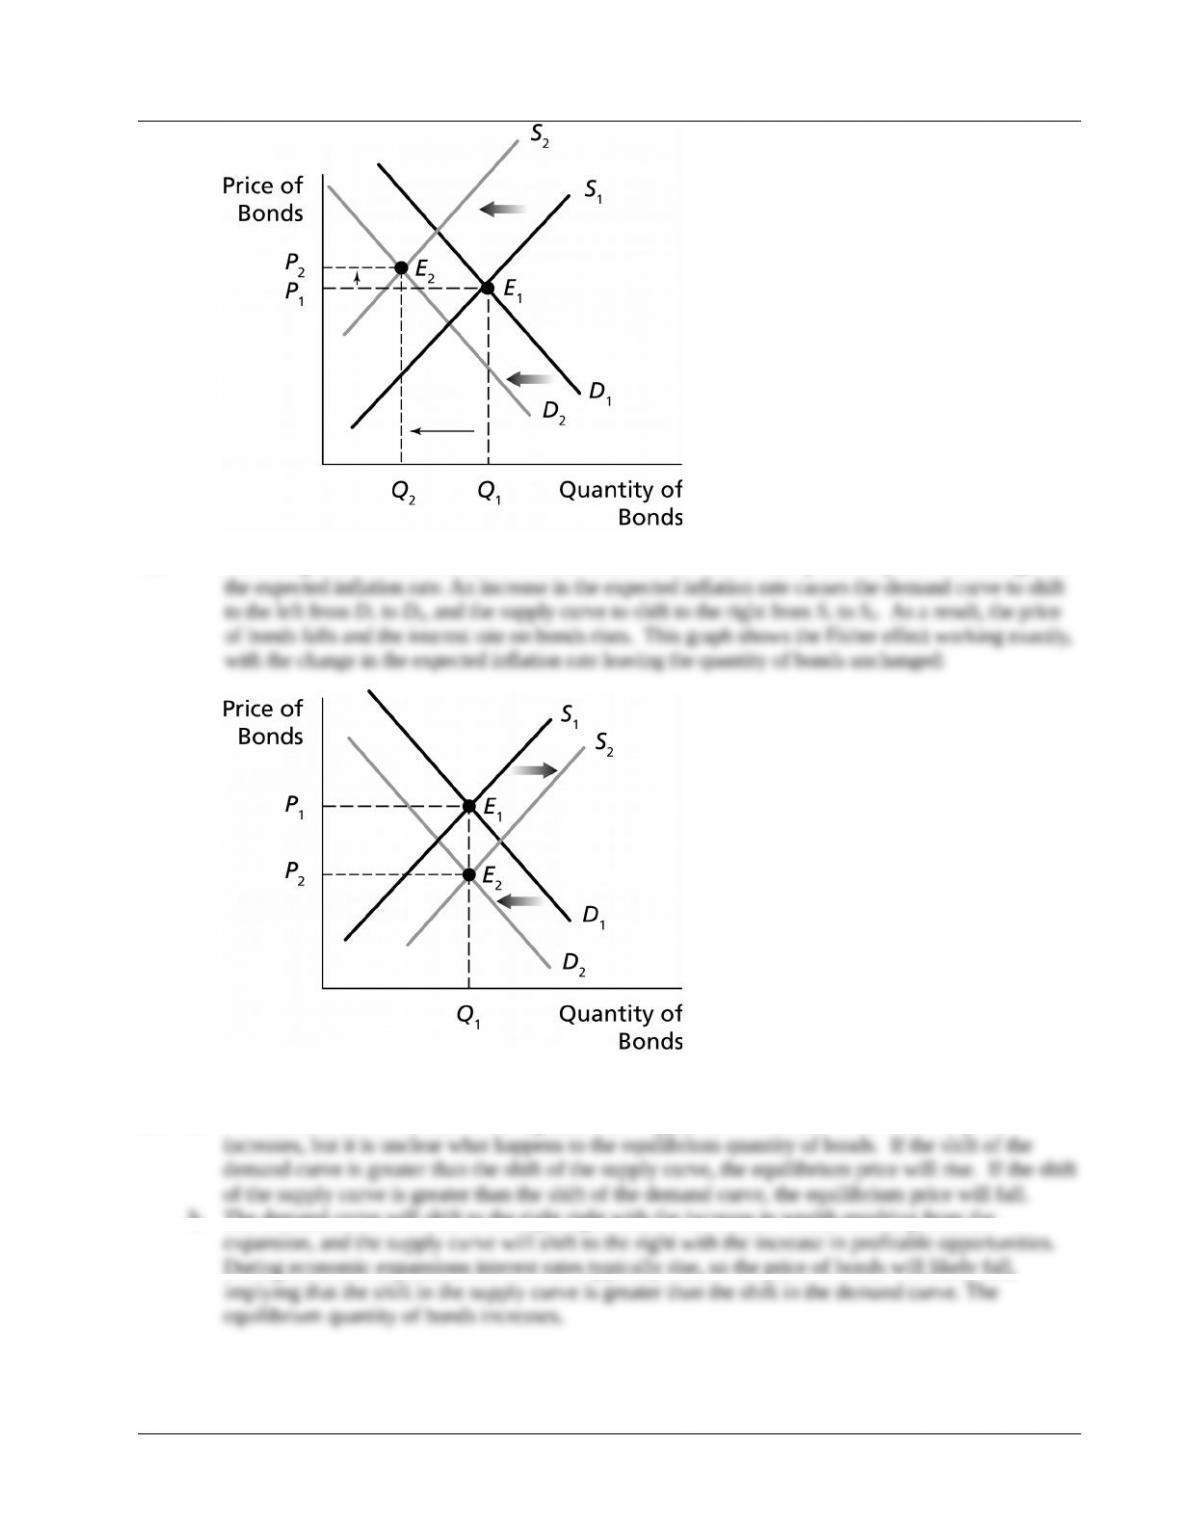
2.5 a. The expected inflation rate will increase, so the demand curve will shift to the left, and the supply
curve will shift to the right.
b. The expected profitability of physical capital investment has increased, so the supply curve shifts to
© 2014 Pearson Education, Inc.
Chapter 4 Determining Interest Rates 38
© 2014 Pearson Education, Inc.
Chapter 4 Determining Interest Rates 39
2.7 The profitable business opportunities would shift the supply curve to the right from S1 to S2. The
2.8 a. Siegel and Schwartz did not mean that the nominal interest rate on 10-year Treasury notes was
b. Federal Reserve monetary policy in response to the financial crisis of 2007 – 2009 had pushed other
4.3 The Bond Market Model and Changes in Interest Rates
Learning objective: Use the bond market model to explain changes in interest rates.
Review Questions
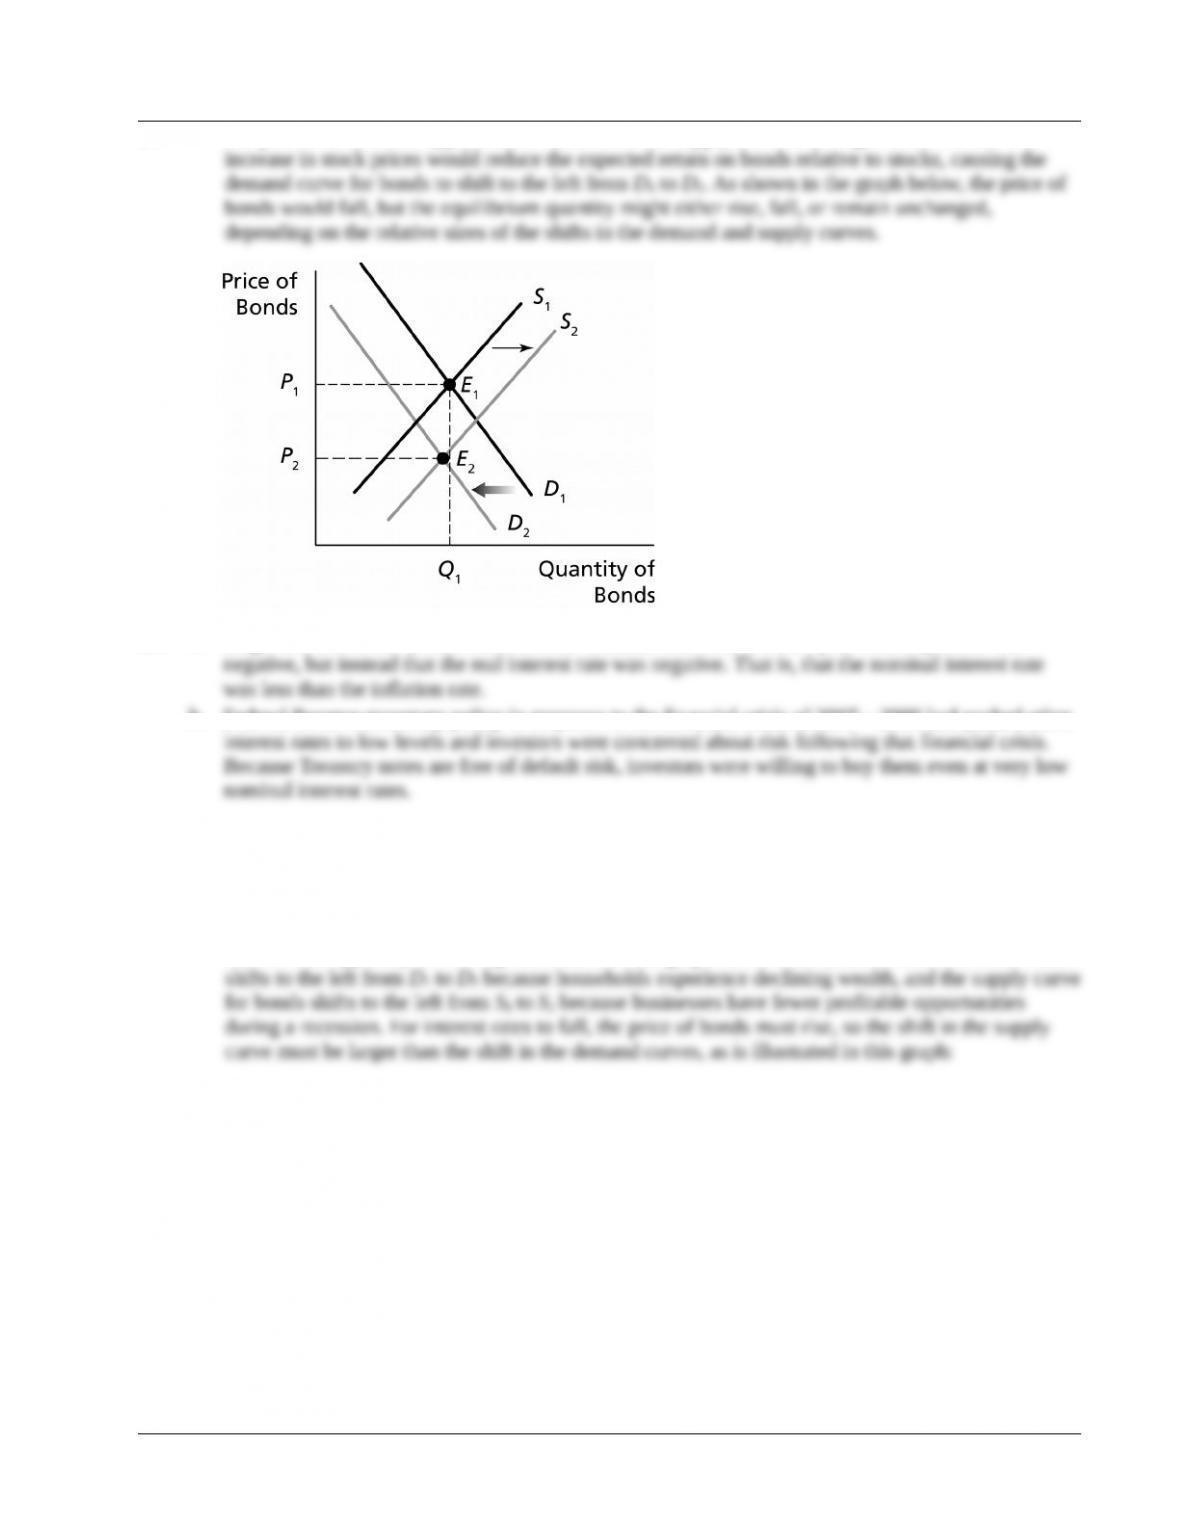
3.1 Interest rates typically fall during recessions. As the graph below shows, the demand curve for bonds
© 2014 Pearson Education, Inc.
Chapter 4 Determining Interest Rates 40
3.2 According to the Fisher effect, the nominal interest rate rises or falls point for point with changes in
Problems and Applications
3.3 a. The demand curve will shift to the right, and the supply curve will shift to the left. The price
b. The demand curve will shift to the right right with the increase in wealth resulting from the
During economic expansions interest rates typically rise, so the price of bonds will likely fall,
© 2014 Pearson Education, Inc.
Chapter 4 Determining Interest Rates 41
c. The supply curve shifts to the left, and the demand curve shifts to the right. The price of bonds rises,
d. The supply curve shifts to the right, forcing the price of bonds down and the quantity of bonds up.
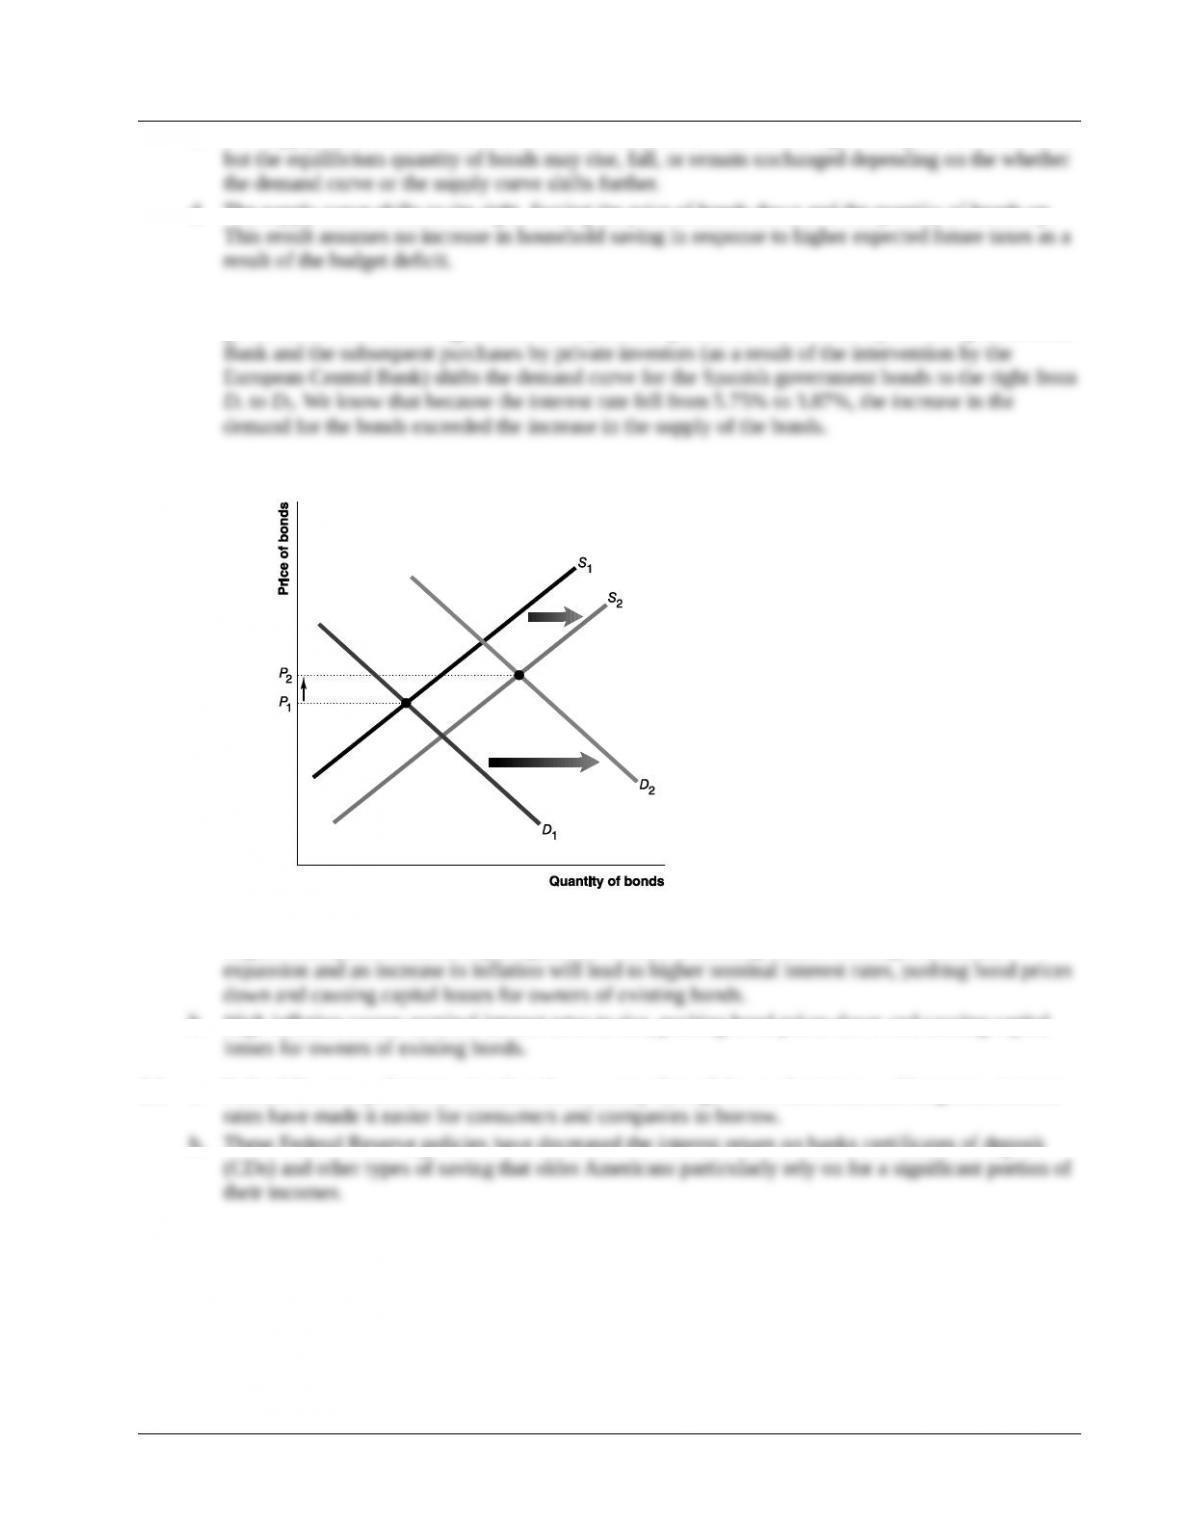
3.4 In the following graph, the large government budget deficit shifts the supply curve for Spanish
government bonds to the right from S1 to S2, and the purchases of the bonds by the European Central
3.5 a. Low growth and low inflation can lead to lower nominal interest rates and higher bond prices.
Higher bond prices result in capital gains for owners of existing bonds. A stronger economic
b. High inflation causes nominal interest rates to rise, pushing bond prices down and causing capital
3.6 a. Federal Reserve policies to stimulate the economy through lower short-term and long-term interest
b. These Federal Reserve policies have decreased the interest return on banks certificates of deposit
4.4 The Loanable Funds Model and the International Capital Market
Learning objective: Use the loanable funds model to analyze the international capital market.
Review Questions
4.1 a. Bond Market: The good is the bond.
© 2014 Pearson Education, Inc.

Chapter 4 Determining Interest Rates 42
b. Bond Market: The buyer is the bond holder (the saver or investor).
c. Bond Market: The seller is the borrower (a government or a corporation).
d. Bond Market: The price is the price of the bond.
4.2 The demand curve is downward sloping because the higher the interest rate, the smaller the quantity
4.3 The bond market approach is most useful when considering how the factors affecting the demand
Problems and Applications
4.4 a. As shown in the graph below, the demand curve for loanable funds shifts to the right, from
L1
D
to
L2
D
, raising the world real interest rate from rw1 to rw2.
b. The supply curve for loanable funds would also shift to the right, from
L1
S
to
L2
S
The world
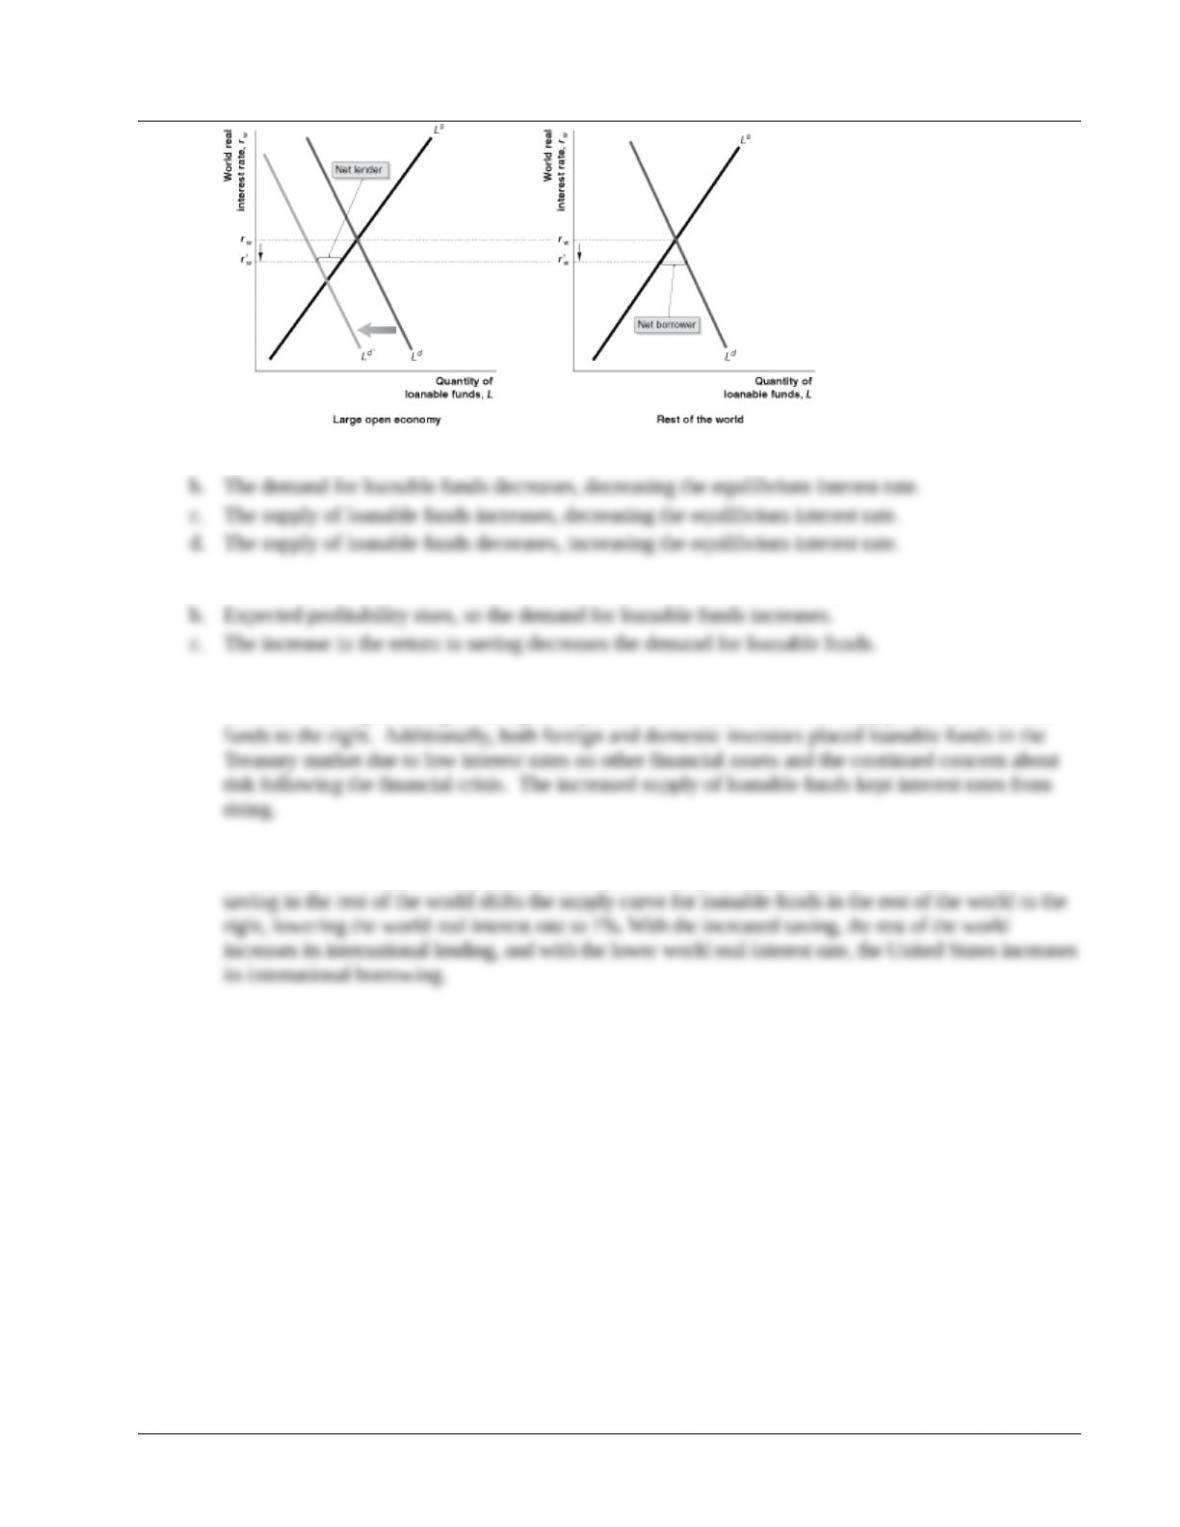
4.5 As shown in the graph below, the demand curve for loanable funds in the large open economy shifts
to the left, from Ld to Ld’, which lowers the world real interest rate somewhat (but not as much as if
© 2014 Pearson Education, Inc.
Chapter 4 Determining Interest Rates 43
4.6 a. The demand for loanable funds increases, increasing the equilibrium interest rate.
4.7 a. After–tax expected profitability falls, so the demand for loanable funds decreases.
4.8 The large budget deficit shifted the demand curve for loanable funds to the right, but increased
household saving resulting from higher expected future taxes shifted the supply curve for loanable
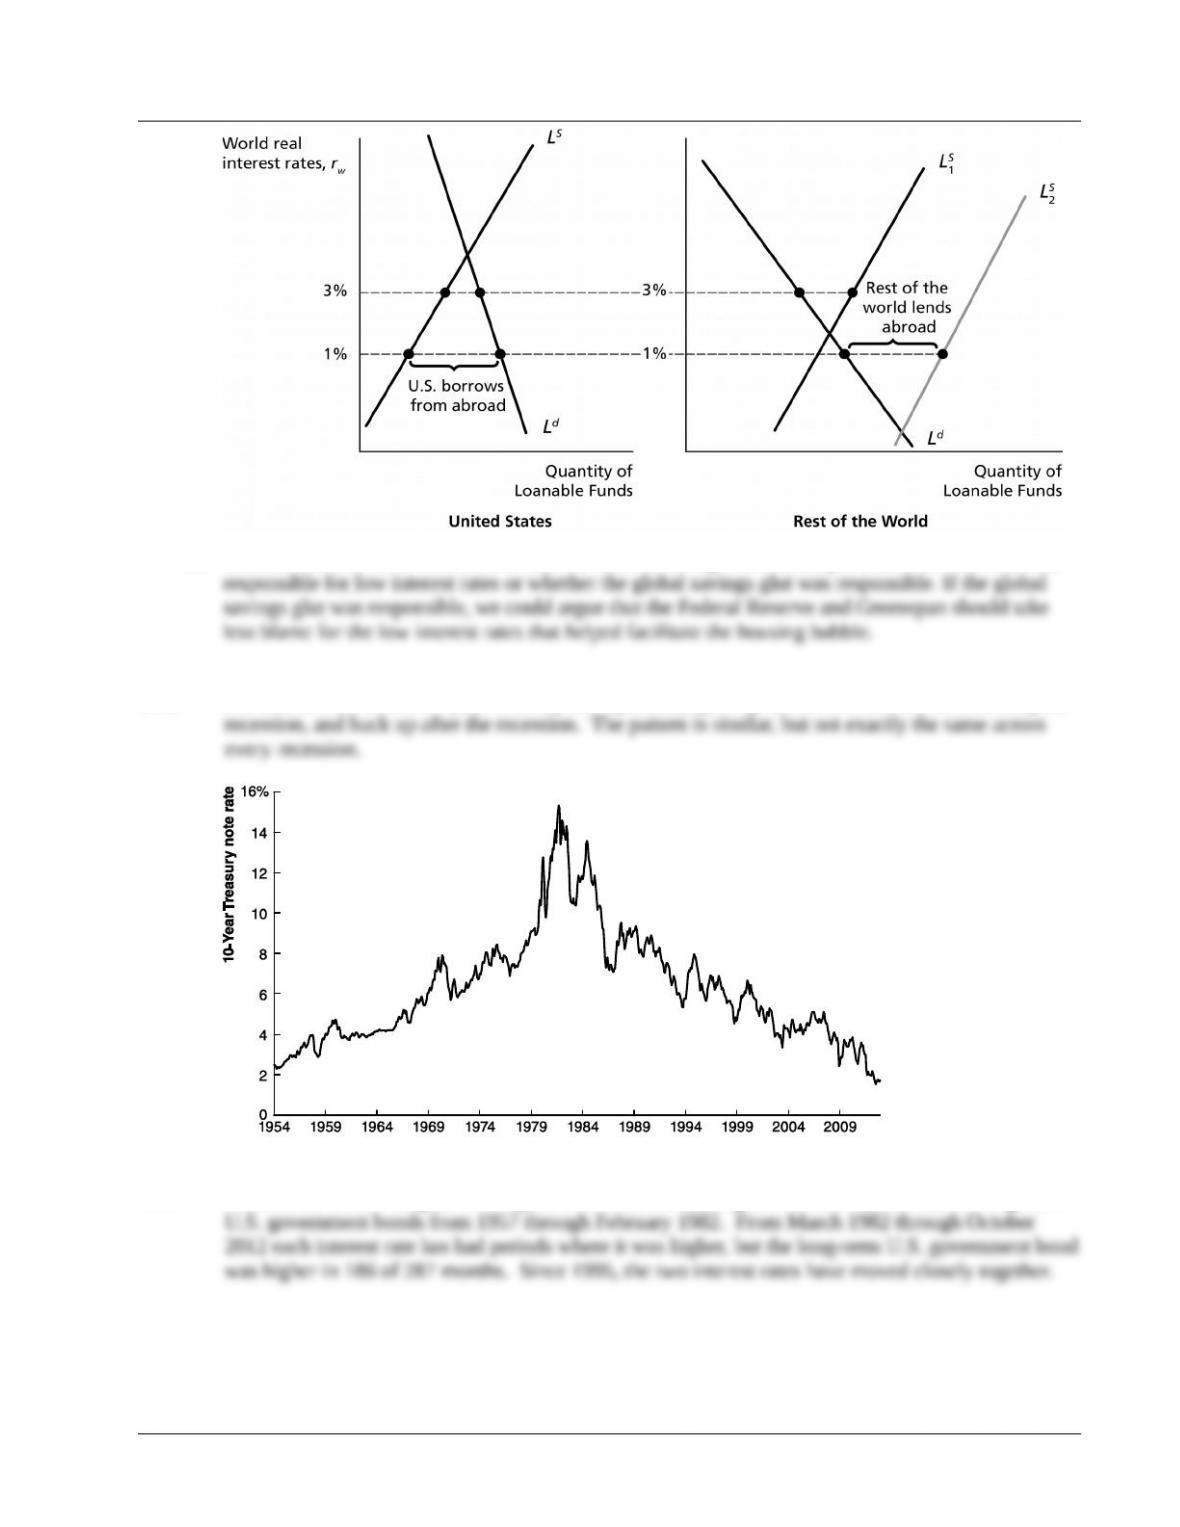
4.9 a. In the graph that follow, begin with the world real interest rate equal to 3% and the rest of the world
as a net international lender and the United States as a net international borrower. An increase in
© 2014 Pearson Education, Inc.
Chapter 4 Determining Interest Rates 44
b. There is a debate over whether the Federal Reserve during Alan Greenspan’s term as chairman was
Data Exercises
D4.1 The interest rate on the 10-year Treasury note generally goes up before a recession, down during the
D4.2 The interest rate on long-term UK government bonds was higher than the interest rate on long-term
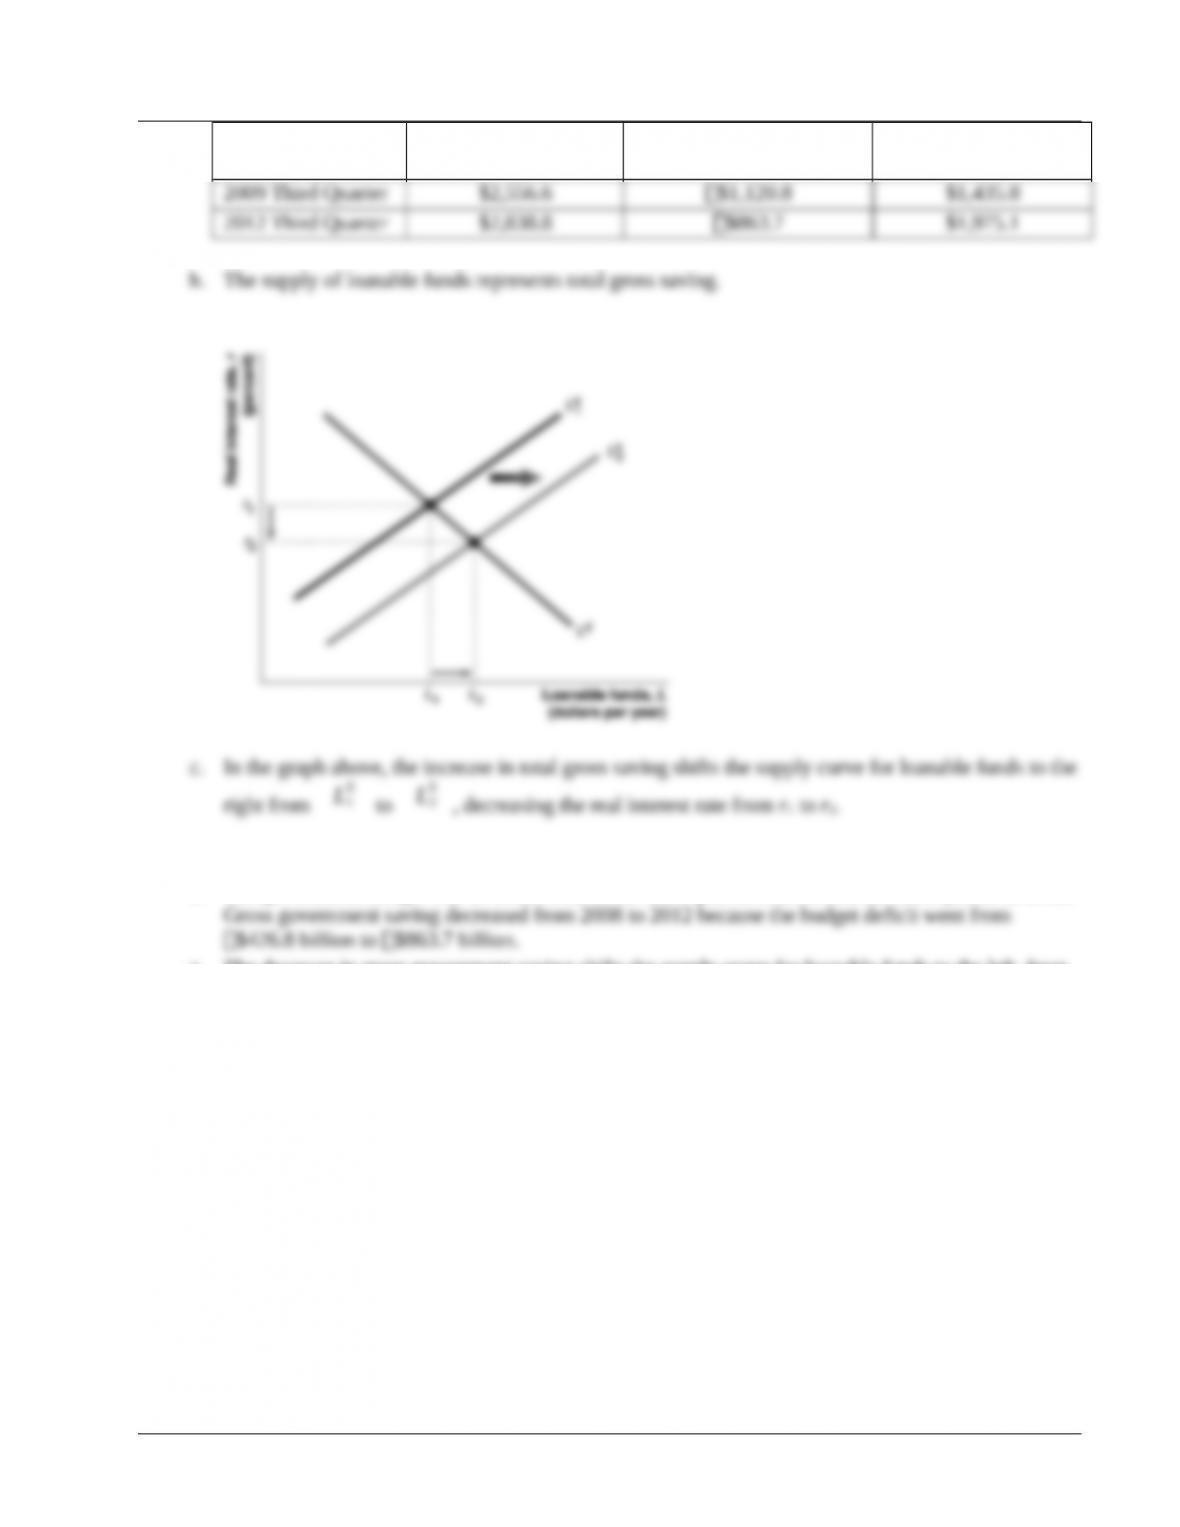
D4.3 a. Total gross savings in the economy increased from $1,435.8 billion in the third quarter of 2009 to
$1,975.1 billion in the third quarter of 2012.
© 2014 Pearson Education, Inc.
Chapter 4 Determining Interest Rates 45
Date
Gross Private Saving
(Billions of Dollars)
Gross Government Saving
(Billions of Dollars)
Total Gross Savings
(Billions of Dollars)
D4.4 a. Gross government saving represents a budget surplus or, when negative, a budget deficit.
b. The government budget was in deficit both in the third quarter of 2008 and the third quarter in 2012.
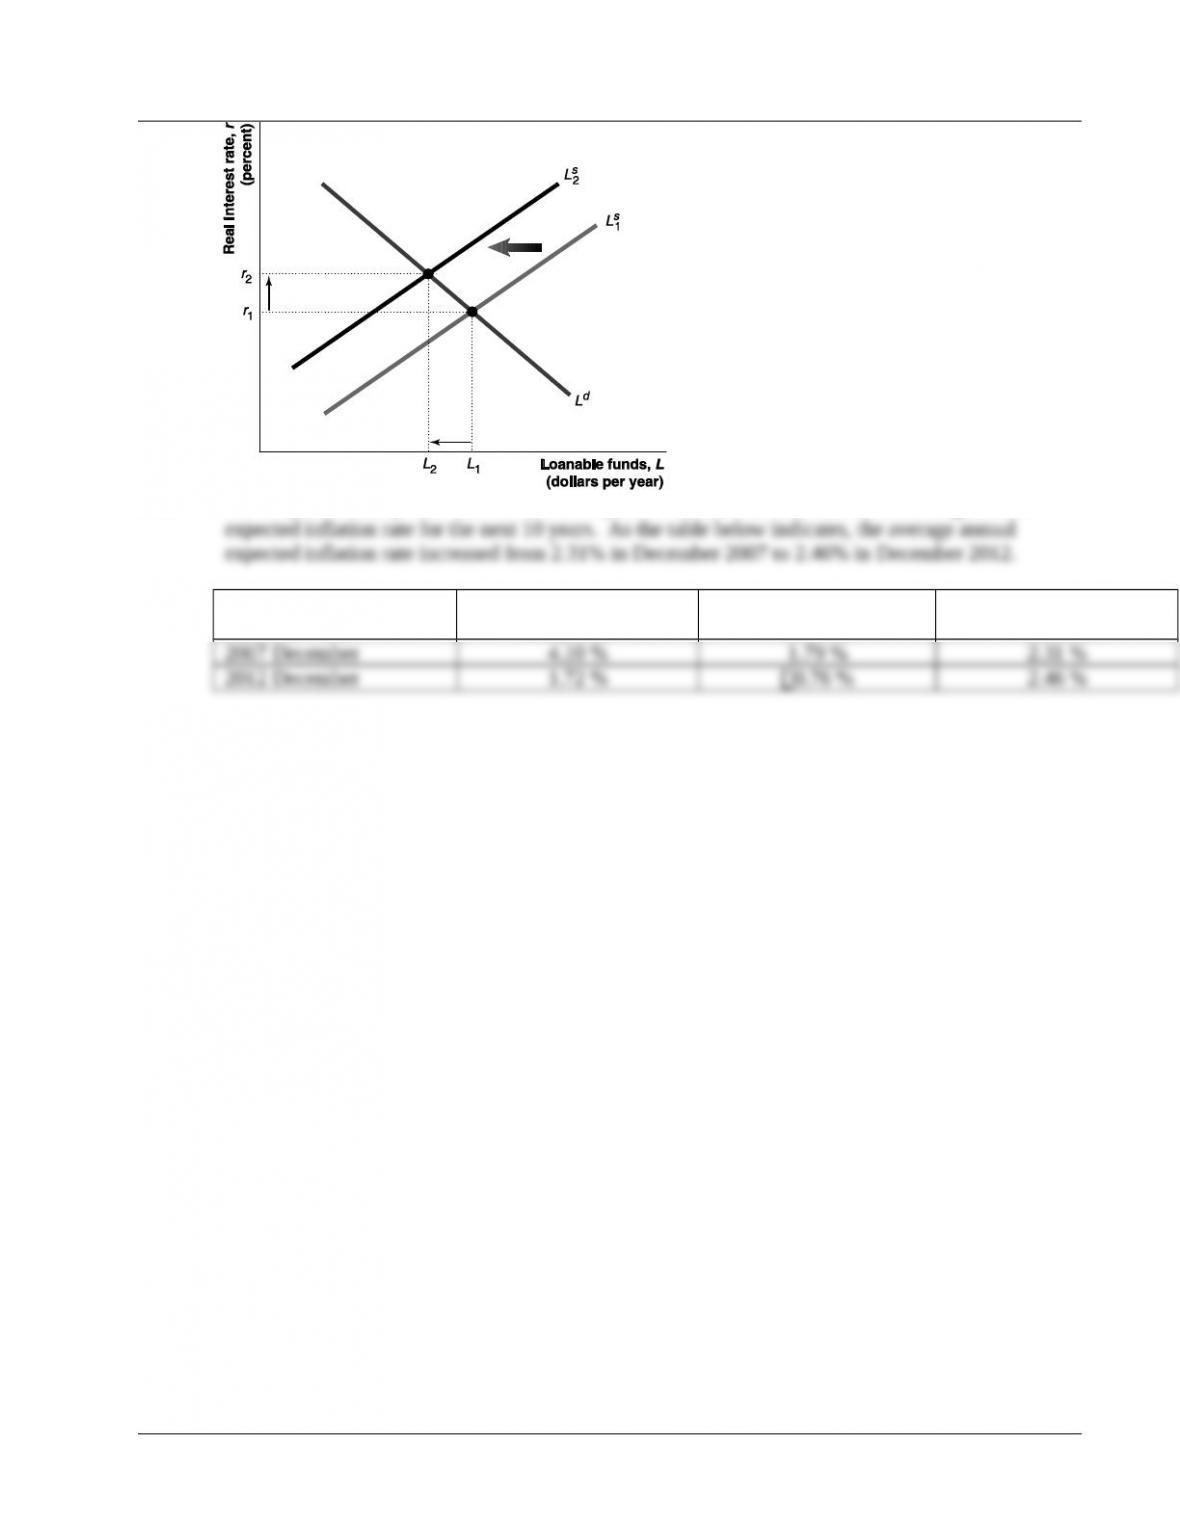
c. The decrease in gross government saving shifts the supply curve for loanable funds to the left, from
L1
S
to
L2
S
, increasing the real interest rate from r1 to r2. With the decrease in the equilibrium
quantity of loanable funds from L1 to L2, the level of investment will decrease. See the graph that
follows.
© 2014 Pearson Education, Inc.
Chapter 4 Determining Interest Rates 46
D4.5 The 10-year Treasury note rate minus the 10-year TIPS rate is an estimate of the average annual
Date
10-Year
Treasury Note Rate
10-Year
TIPS Rate
Expected
Inflation Rate
© 2014 Pearson Education, Inc.