17.4 The Effects of Monetary Policy
Learning objective: Use the aggregate demand and aggregate supply model to show the effects of
monetary policy.
Review Questions
4.1 Business cycles vary both in length and in severity. For example, the recession of 2001 in the
4.2 Attempts to fine-tune the economy may be ineffective given the potentially long lags in
formulating and implementing stabilization policies and the potentially long lag before the policies
4.3 To counteract a negative demand shock, the Fed can conduct expansionary monetary policy by
4.4 Hysteresis in macroeconomics refers to the idea that when high rates of unemployment persist
workers lose their skills or are viewed by employers as lacking current skills, and some of the
Problems and Applications
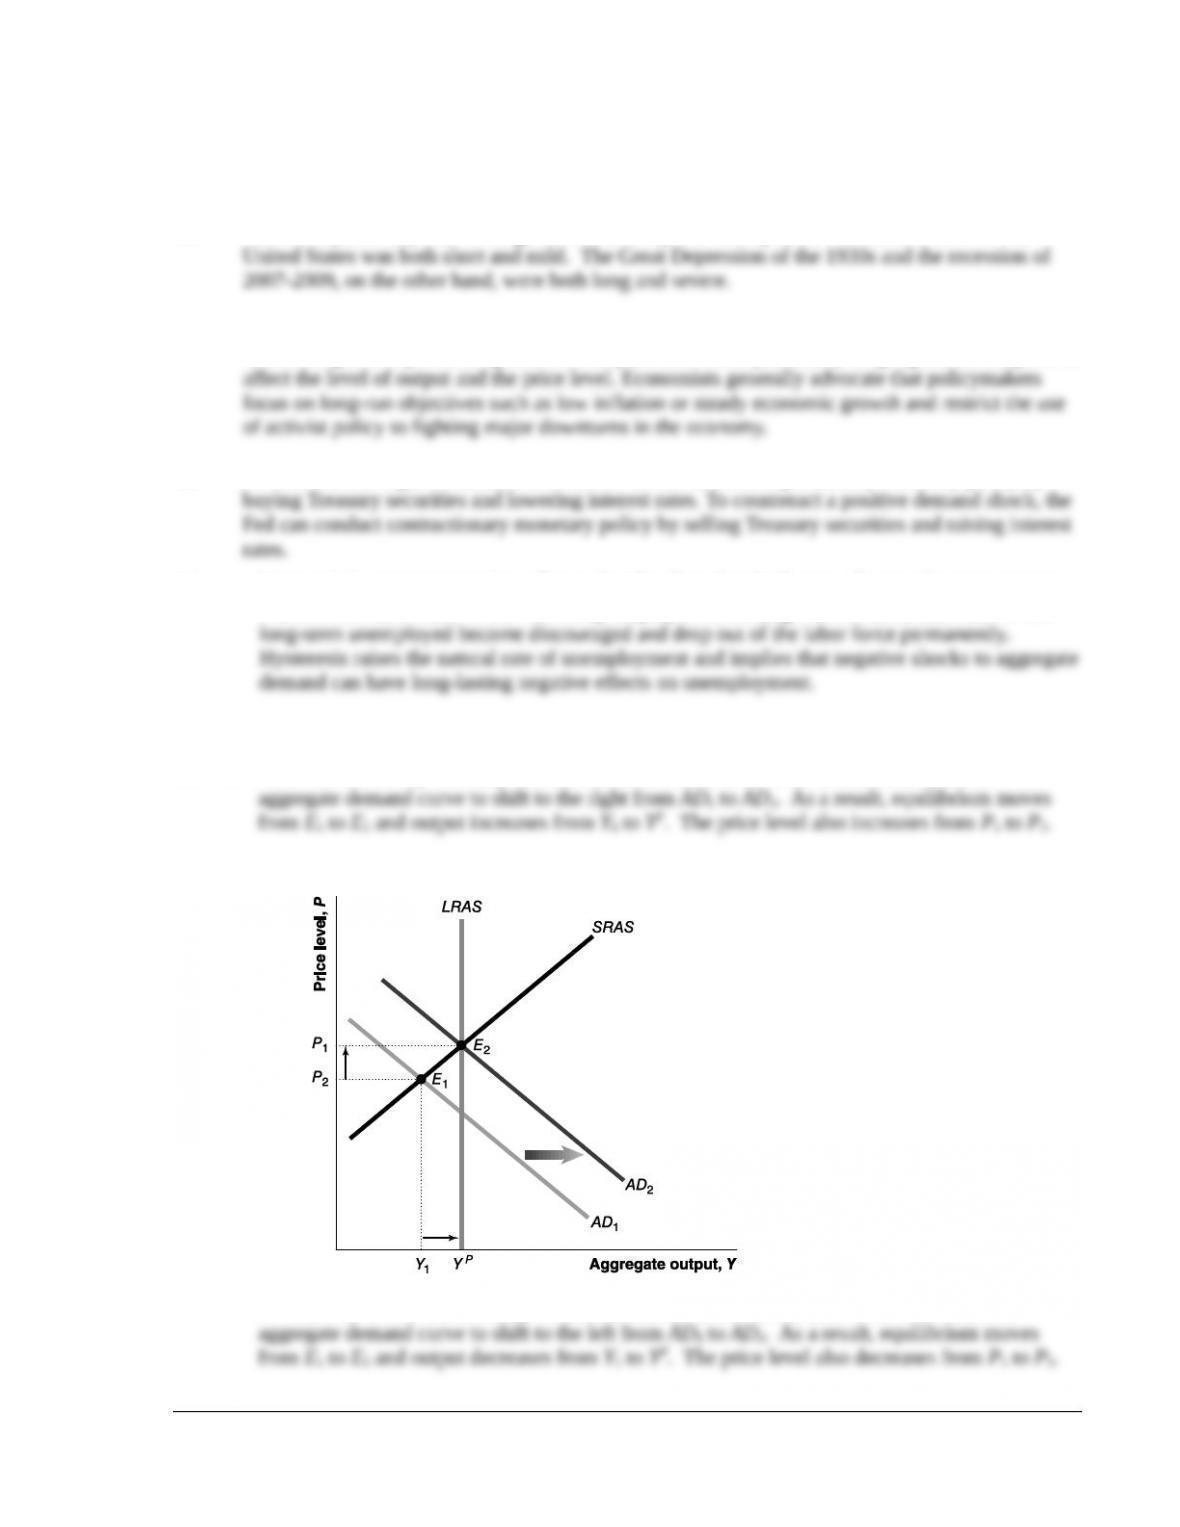
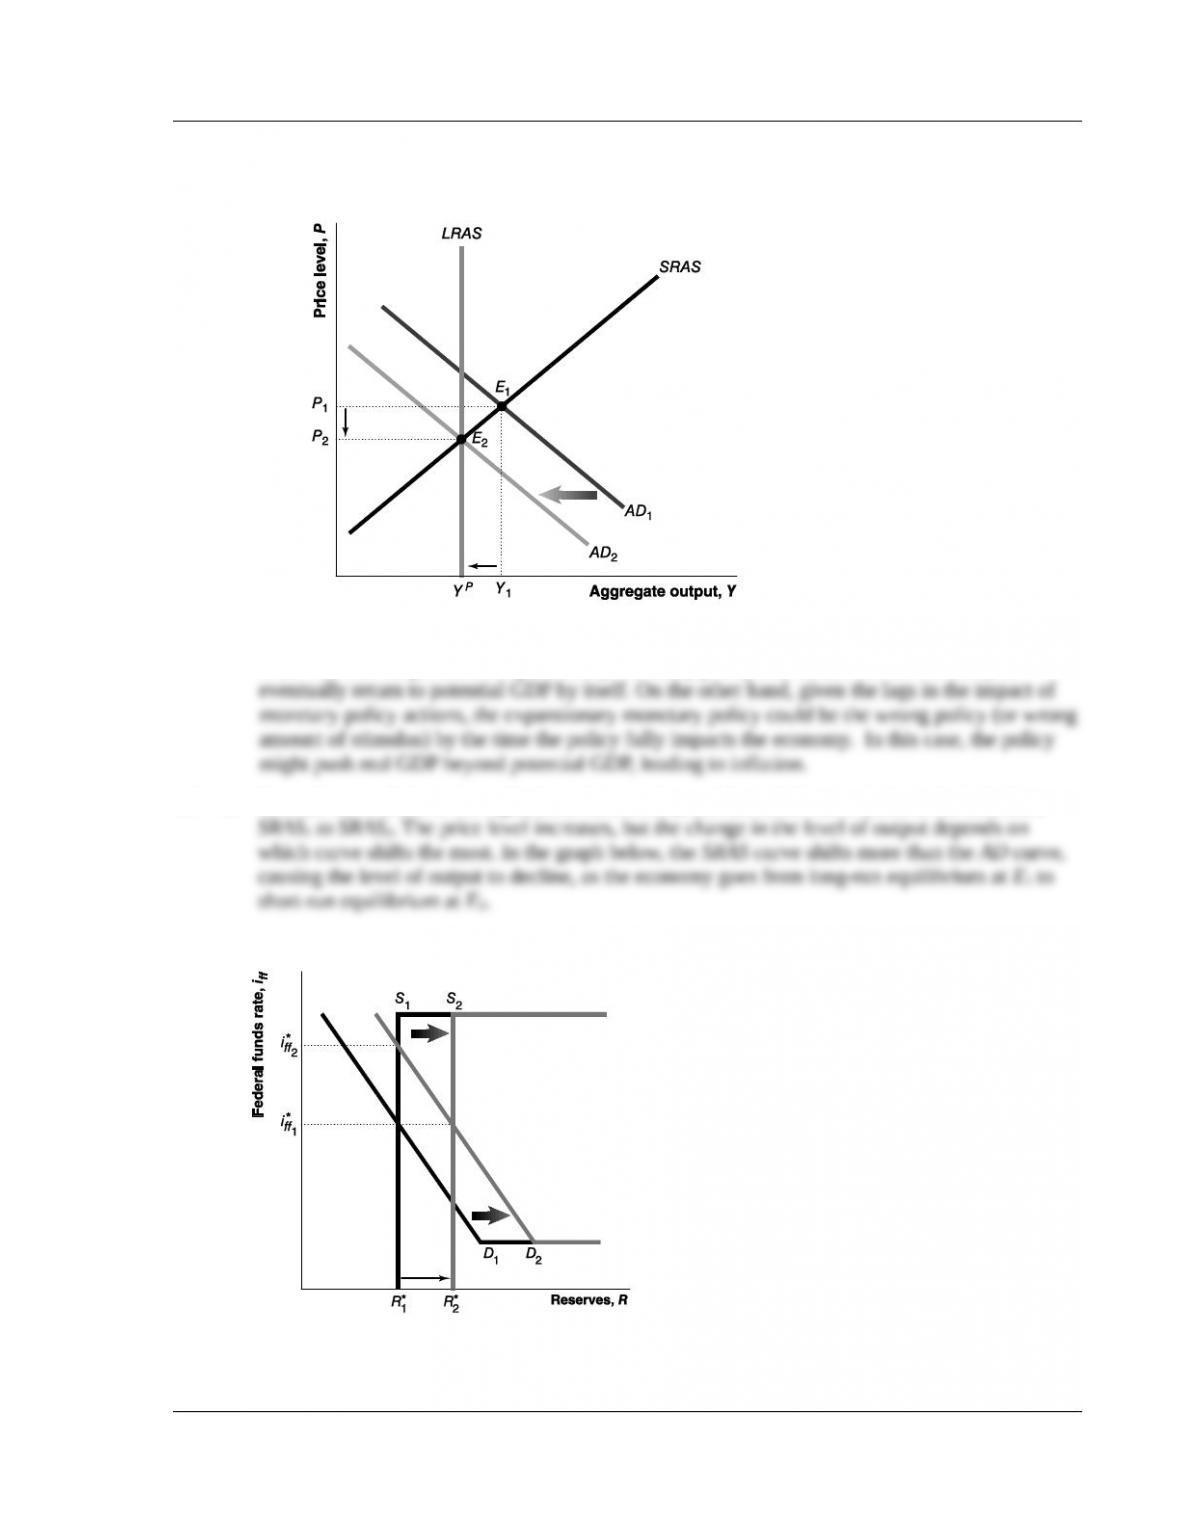
4.5 a. The Fed would buy Treasury securities, which would lower interest rates and cause the
b. The Fed would sell Treasury securities, which would raise interest rates and cause the
© 2014 Pearson Education, Inc
Chapter 17 Monetary Theory I 220
4.6 Expansionary monetary policy might more quickly return the economy to full employment than
if the Fed did not pursue an expansionary monetary policy and waited for the economy to
4.7 a. The AD curve shifts to the right, from AD1 to AD2, and the SRAS curve shifts to the left, from
b. With output below potential GDP, over time, households and firms will learn that the price level has
© 2014 Pearson Education, Inc
Chapter 17 Monetary Theory I 221
4.8 To the extent that negative shocks to aggregate demand lead to extended periods of unemployment,
4.9 The unprecedented housing bust reduced household wealth and ultimately led to the financial crisis
and the credit crunch. Both effects continued to negatively affect the economy several years after the
4.10 Cowen’s position is more consistent with that of Robert Gordon who saw the problem of high
4.11 a. By a “low-employment trap,” Gordon means a situation where low employment will not be
b. With hysteresis, the low employment does not represent an excess supply of labor. The unemployed
4.12 By asserting that high unemployment was largely a cyclical problem, instead of a separate, structural
4.13 a. By “situations like ours,” Romer means continued high unemployment and slow economic
b. Yes, if the high unemployment is due to changes in the economy that increase structural
Data Exercise
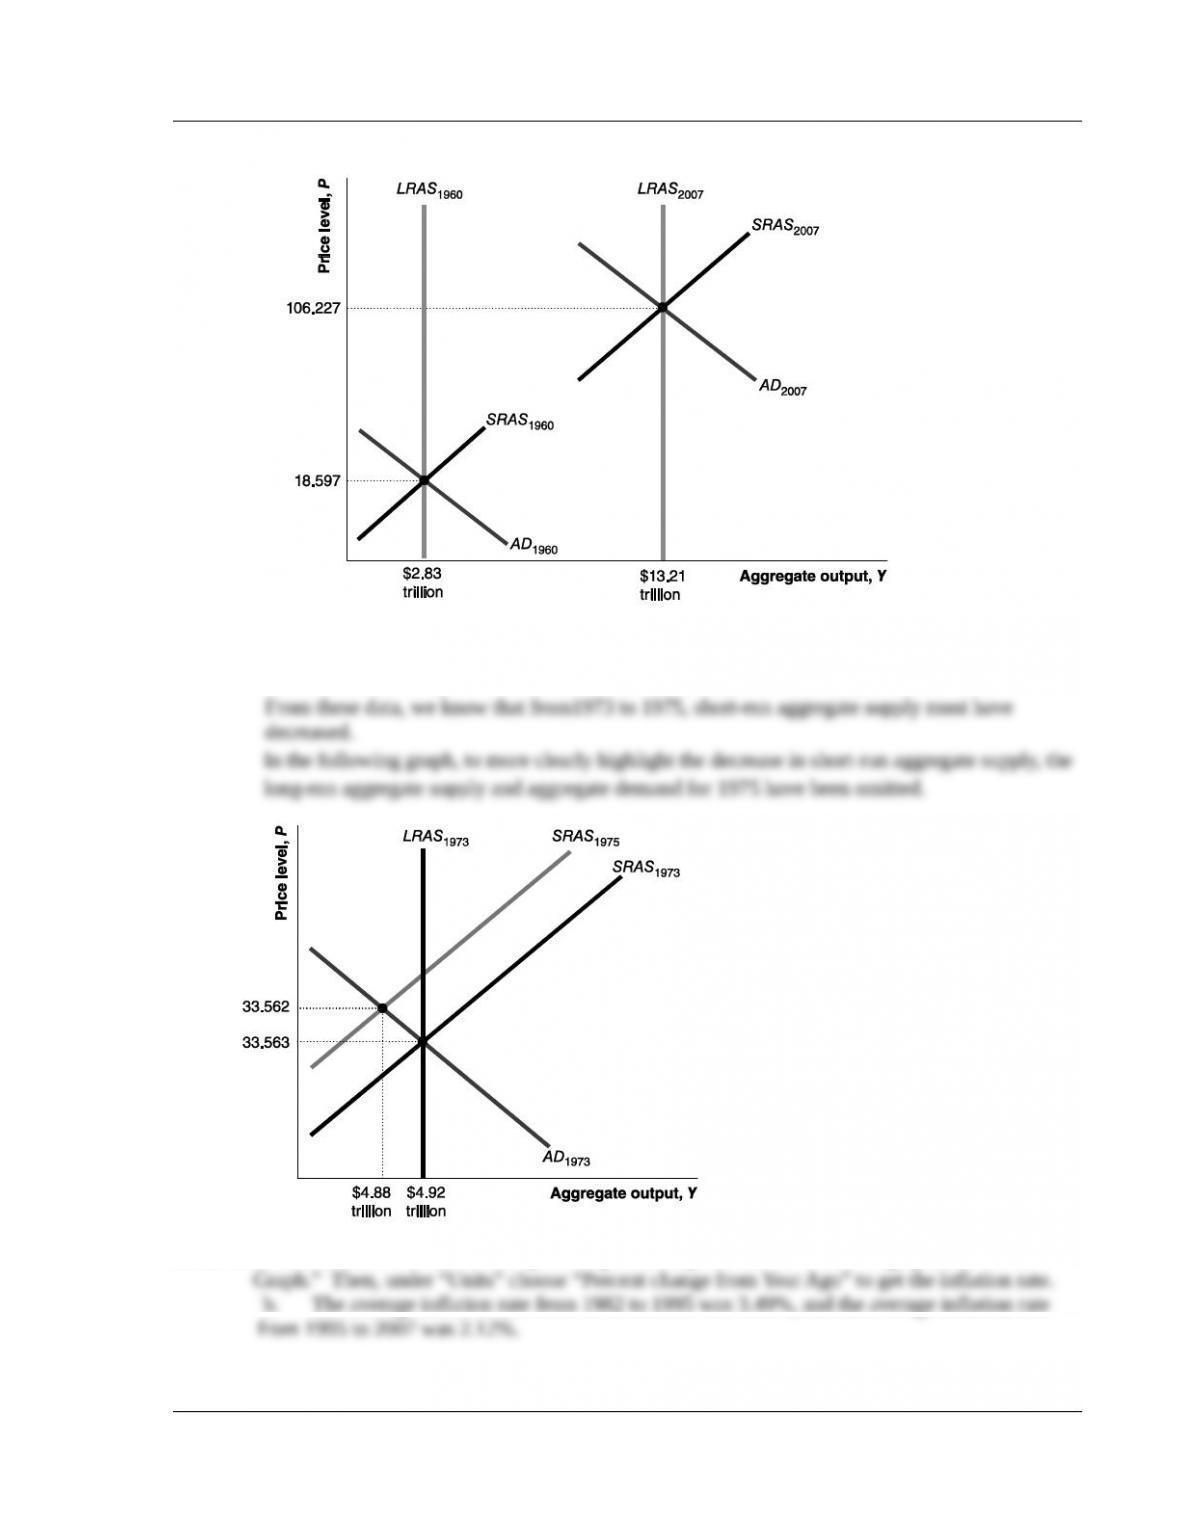
D17.1 a. In 1960, real GDP equaled $2.83 trillion (chained 2005 dollars), and the GDP price deflator
equaled 18.597.
© 2014 Pearson Education, Inc
Chapter 17 Monetary Theory I 222
b. In 1973, real GDP equaled $4.92 trillion, and the GDP price deflator equaled 28.112.
In 1975, real GDP equaled $4.88 trillion and the GDP price deflator equaled 33.562.
D17.2 a. Download the Personal Consumption Expenditure price index. Under the graph, click “Edit
b. The average inflation rate from 1982 to 1995 was 3.49%, and the average inflation rate
© 2014 Pearson Education, Inc
Chapter 17 Monetary Theory I 223
c. A positive supply shock decreases the inflation rate, so these calculations of the inflation
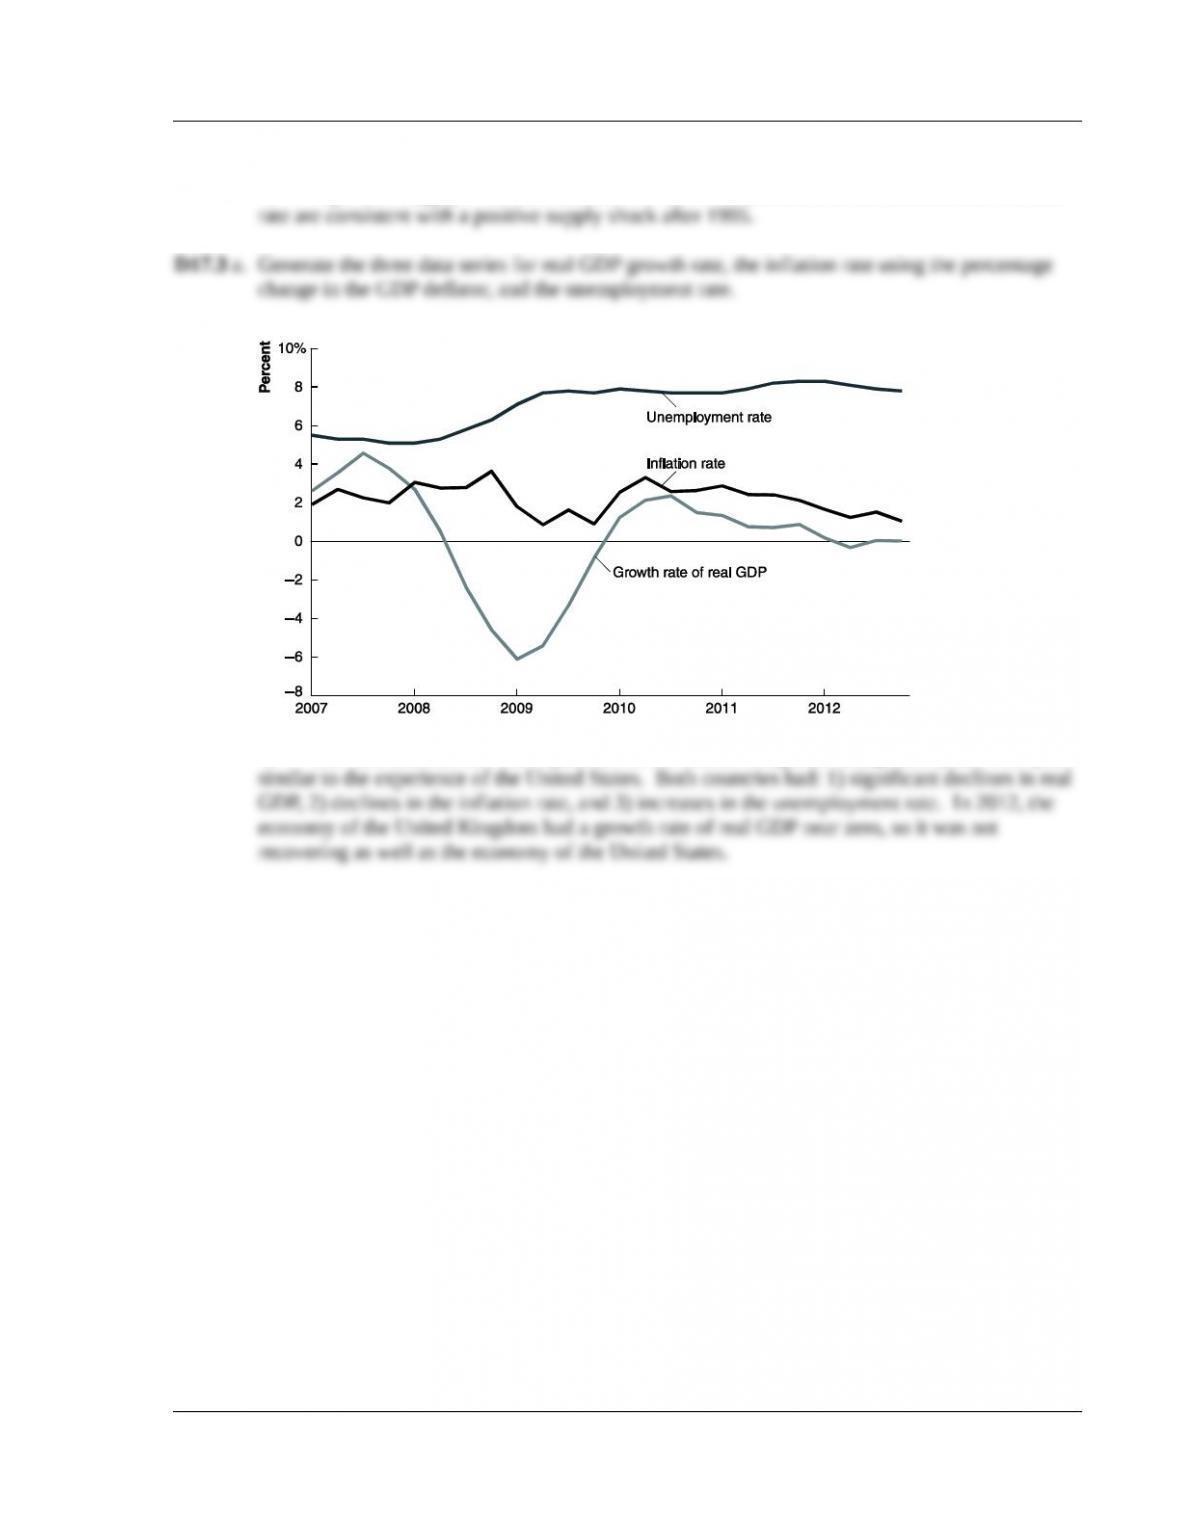
b. The data indicate that the experience of the United Kingdom during these years was quite
© 2014 Pearson Education, Inc