Solutions to the End-of-Chapter Questions, Problems, and Data
Exercises
17.1 The Aggregate Demand Curve
Learning objective: Explain how the aggregate demand curve is derived.
Review Questions
1.1 Aggregate expenditure consists of: 1) Spending by households on goods and services, C; 2)
planned spending by firms on capital goods, such as factories, office buildings, and machine
1.2 The AD curve is downward sloping because an increase in the price level decreases real money
1.3 Households and firms demand money to facilitate buying and selling, which economists call the
1.4 a. Investment spending by firms on plant and equipment would decrease because the cost to
b. Consumption spending by households would decrease because the cost to households of
c. Net exports would decrease because a higher interest rate would increase the foreign
Problems and Applications
1.5 a. The Fed’s sale of Treasury securities would decrease the nominal money supply, which would
b. The federal government spending on highways would directly increase aggregate
c. The cut in the corporate profits tax would increase the after-tax rate of return on
d. An increase in the foreign exchange value of the dollar would increase the foreign
e. Firms becoming pessimistic about the future profitability of spending on factories and
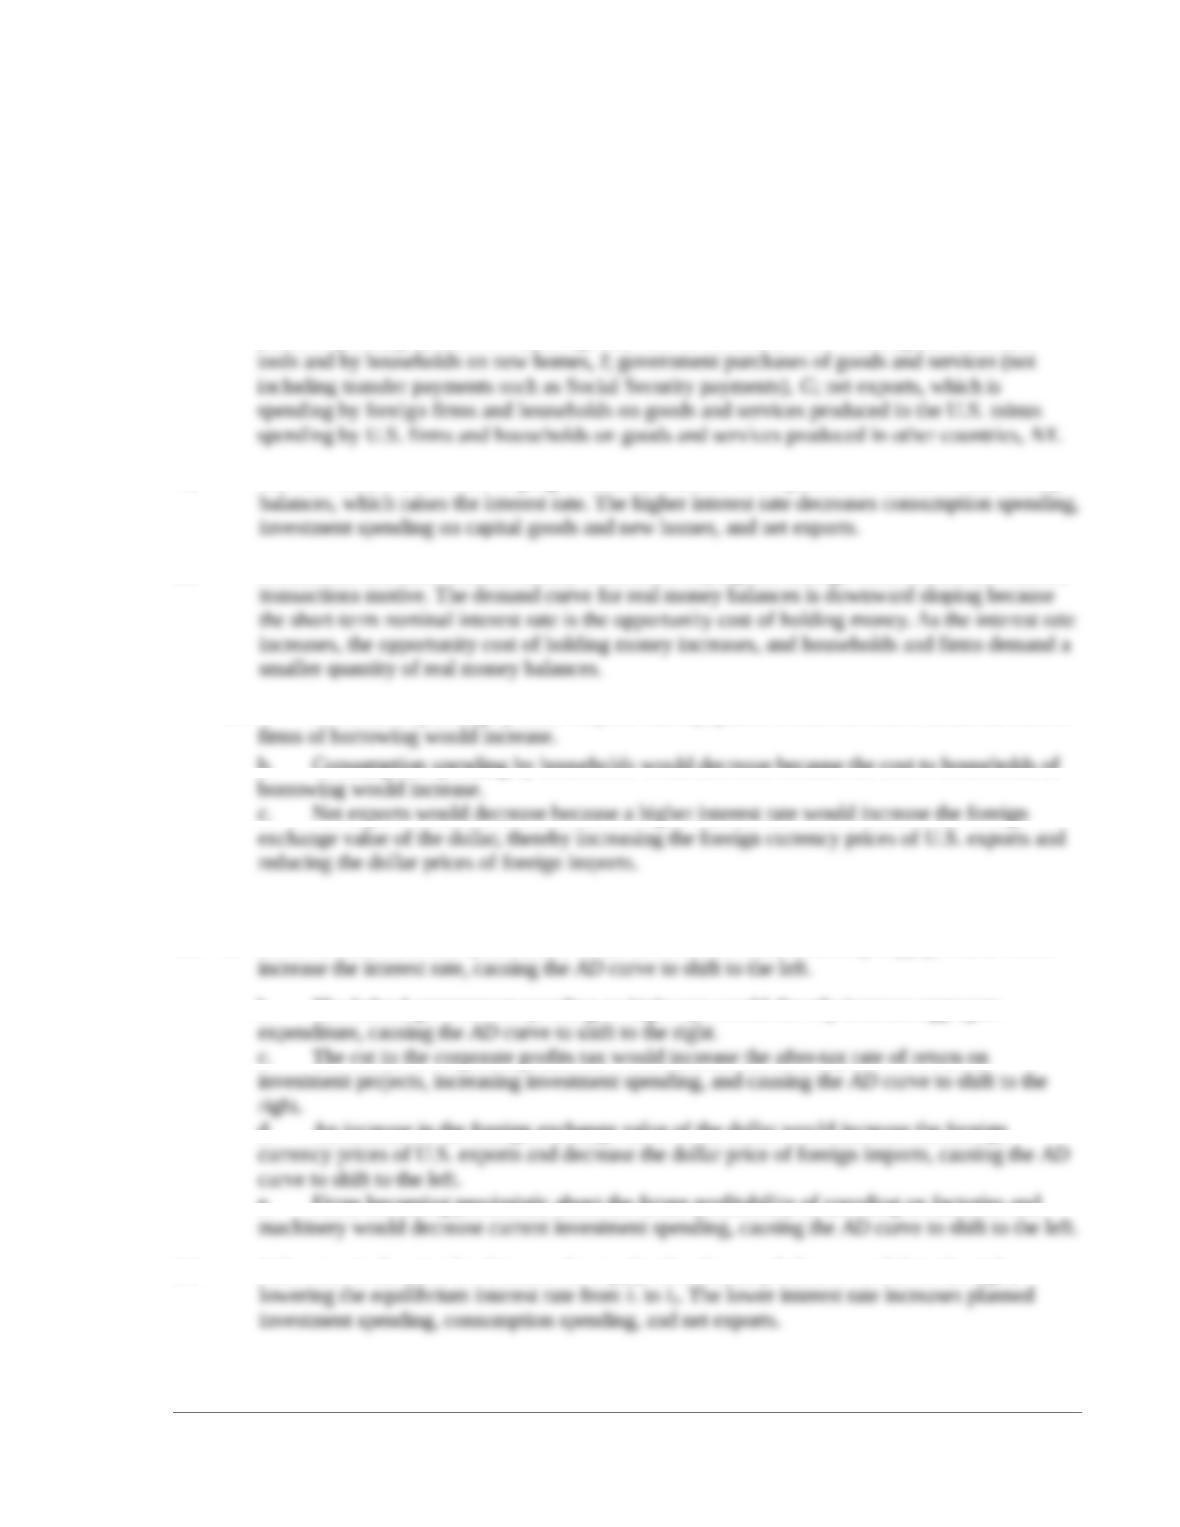
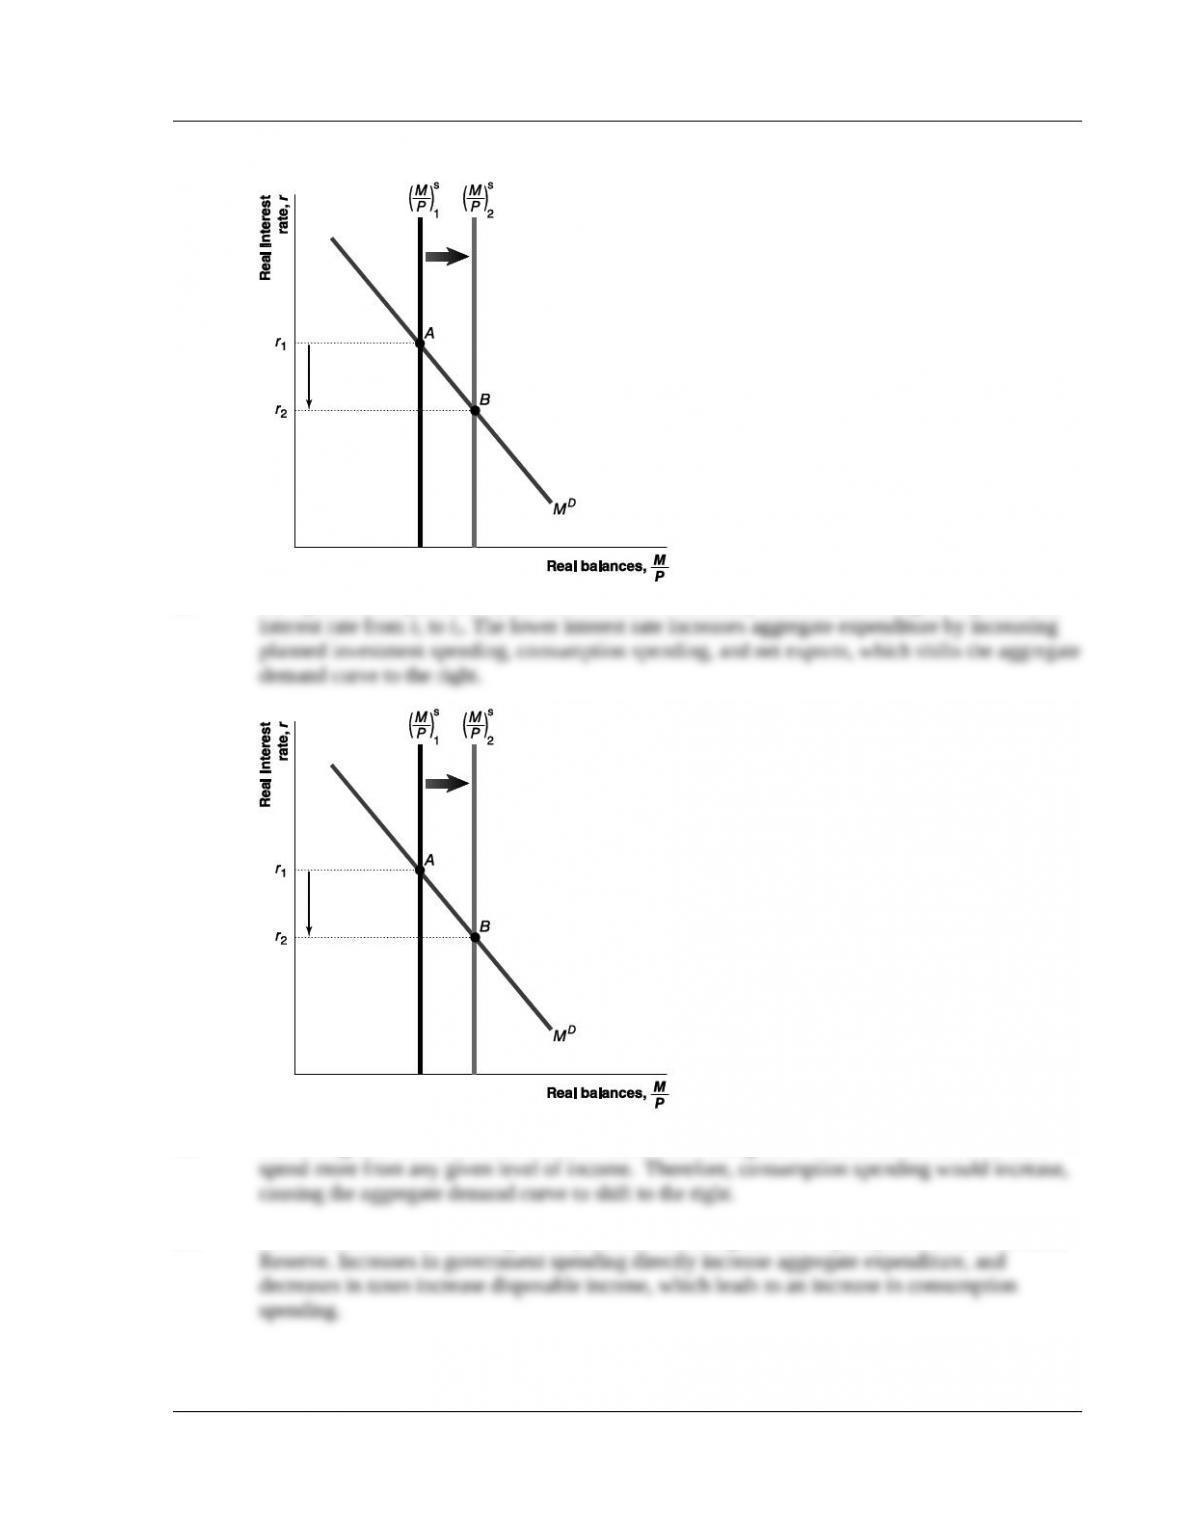
1.6 A decrease in the price level causes the supply of real money balances to shift to the right,
© 2014 Pearson Education, Inc
Chapter 17 Monetary Theory I 220
1.7 The open market purchase by the Fed increases real money balances, lowering the equilibrium
1.8 The saving rate would decrease because households with greater wealth tend to save less and
1.9 Christina Romer was referring to the president and Congress and to policymakers at the Federal
17.2 The Aggregate Supply Curve
© 2014 Pearson Education, Inc
Chapter 17 Monetary Theory I 221
Learning objective: Explain how the aggregate supply curve is derived.
Review Questions
2.2 There is an asymmetry—firms have more information on their prices than on the general price
2.3 Price stickiness means that prices adjust slowly in the short run in response to changes in
2.4 Changes in labor costs, other input costs, and the expected price level shift the short-run
Problems and Applications
2.5 In the short run, for a particular expected price level, Pe, an increase in the actual price level, P,
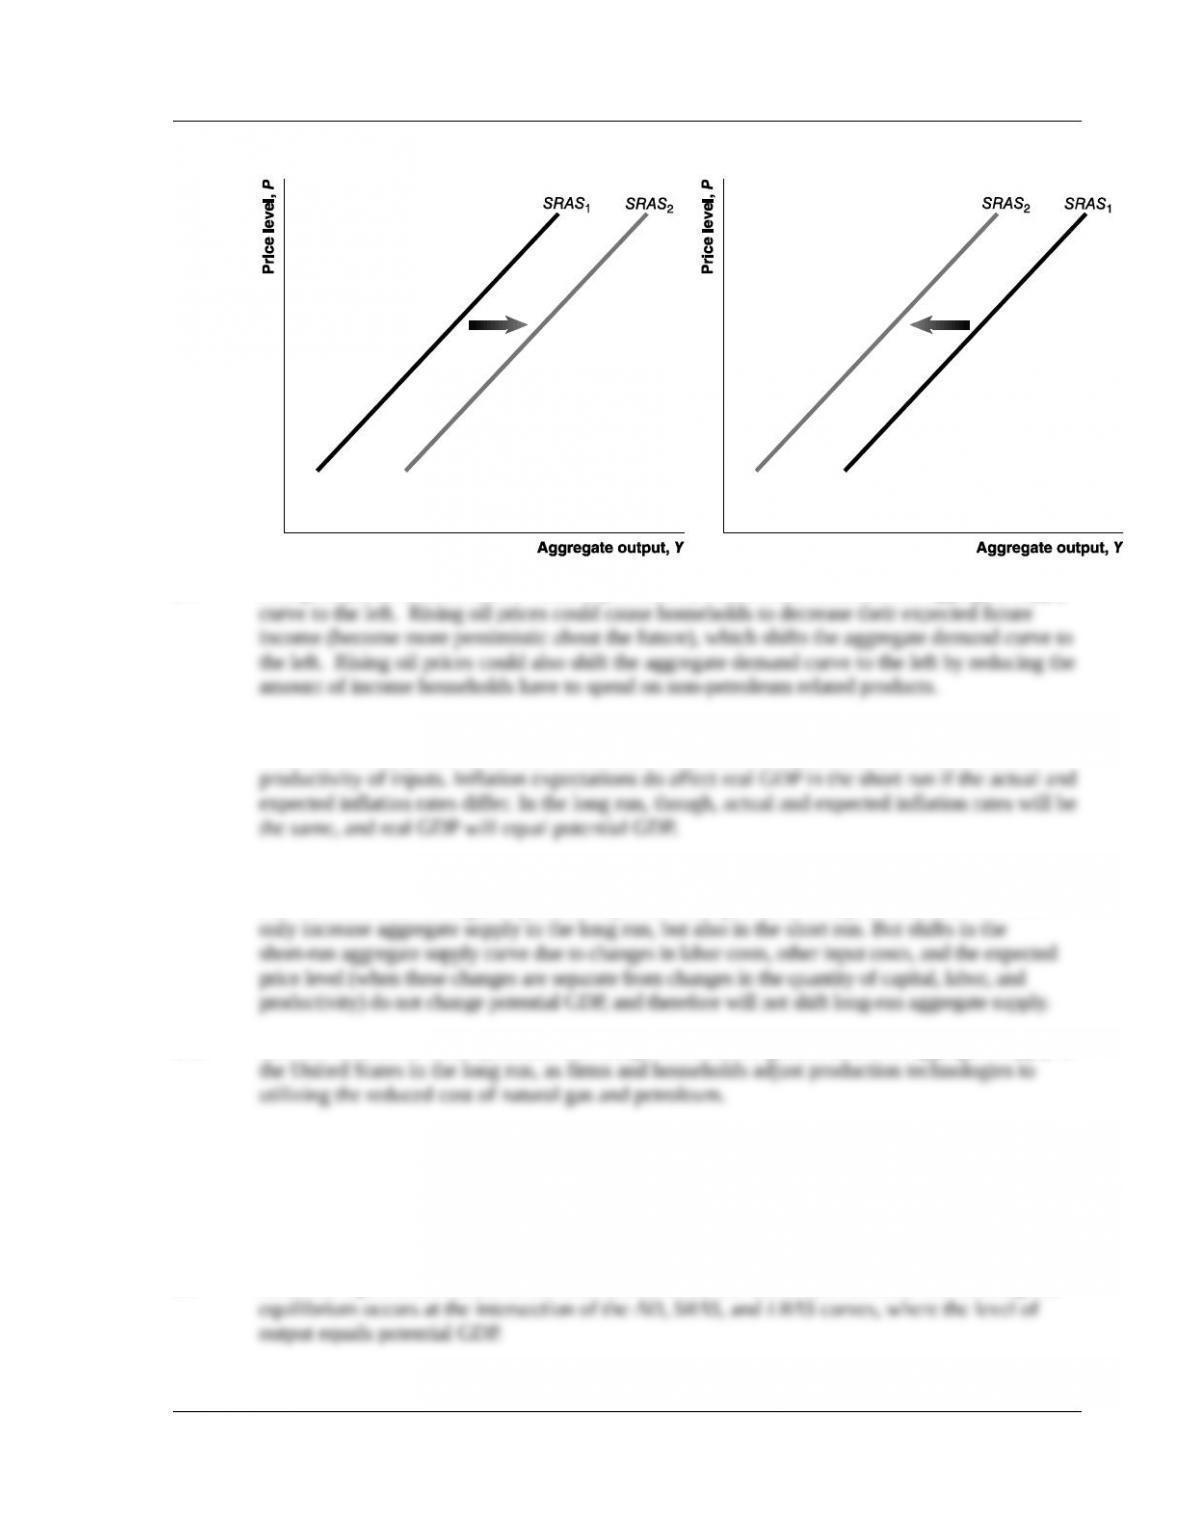
increases the value of the second term in the aggregate supply equation, thereby raising the
2.6 a. A decrease in the expect price level reduces Pe in the short-run aggregate supply curve
e. Severe winter storms will reduce the ability of firms to produce output at any given price
level, shifting the SRAS curve to the left.
© 2014 Pearson Education, Inc
Chapter 17 Monetary Theory I 222
2.7 Rising oil prices increase firms’ costs of production, which shifts the short-run aggregate supply
2.8 You should disagree because inflation expectations are not a determinant of potential GDP.
Potential GDP depends on the size of the labor force and the capital stock, as well as on the
2.9 If the long-run aggregate supply curve shifts, the short-run aggregate supply curve will also shift,
but not vice versa. Changes in productivity and in the quantities of capital and labor will not
2.10 The cost reductions from hydraulic fracturing would have a greater effect on aggregate supply in
17.3 Equilibrium in the Aggregate Demand and Aggregate Supply Model
Learning objective: Demonstrate macroeconomic equilibrium using the aggregate demand and
aggregate supply model.
Review Questions
3.1 Short-run equilibrium occurs at the intersection of the AD curve and the SRAS curve. Long-run
© 2014 Pearson Education, Inc
Chapter 17 Monetary Theory I 223
3.2 The short-run aggregate supply curve will shift to the left. With output above potential GDP, wages
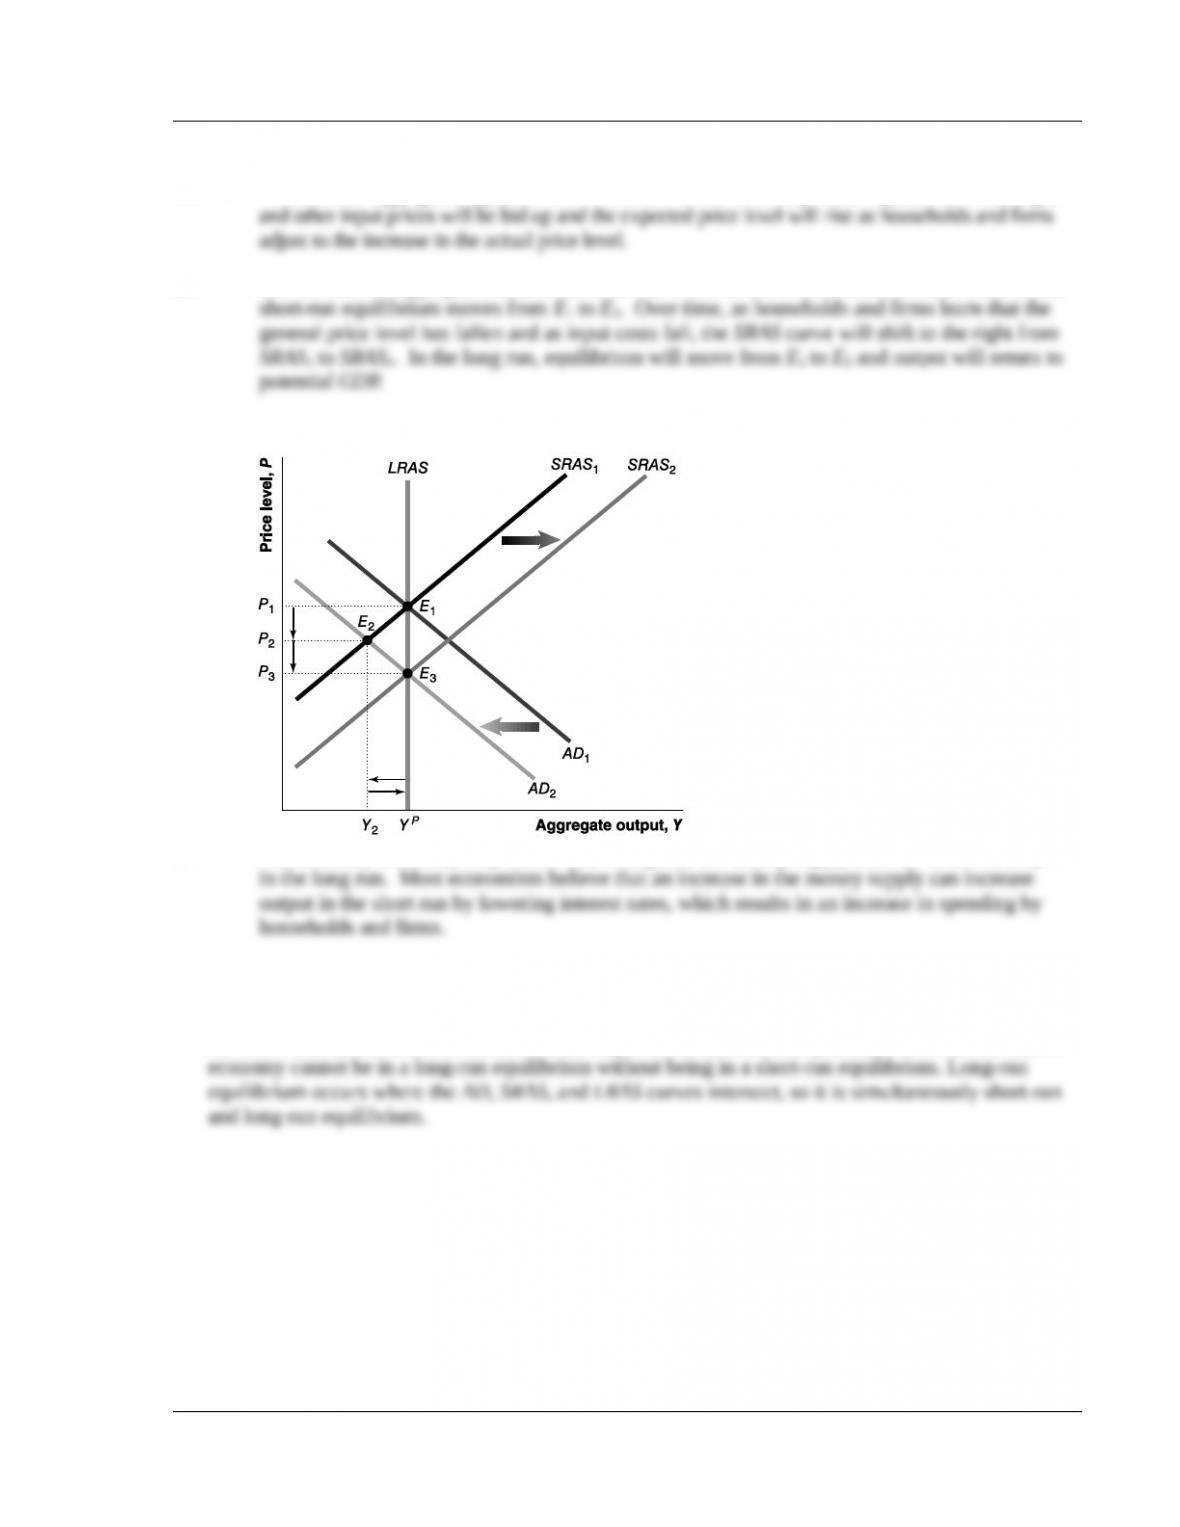
3.3 The decrease in aggregate demand shifts the AD curve to the left from AD1 to AD2. As a result,
3.4 No, monetary neutrality only means that changes in the money supply have no effect on output
Problems and Applications
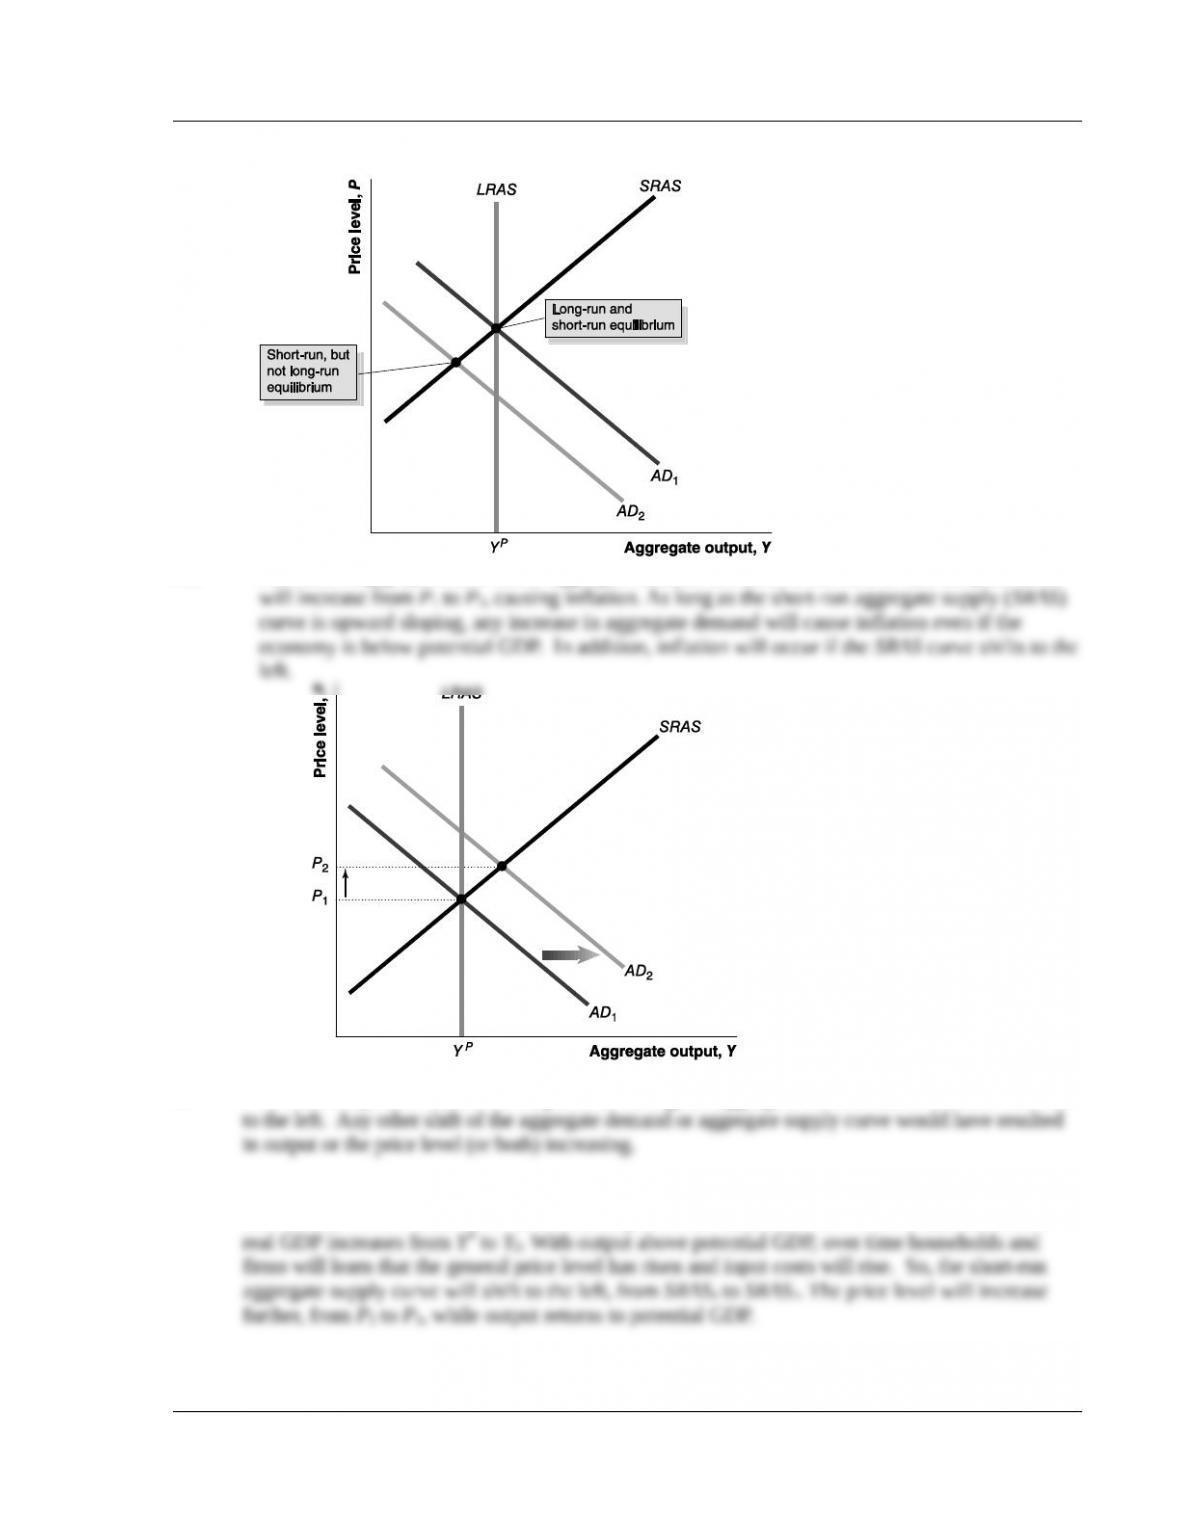
3.5 The economy will be in a short-run equilibrium without being in a long-run equilibrium when the
AD curve and the SRAS curve intersect at an output level different than potential GDP. However, the
© 2014 Pearson Education, Inc
Chapter 17 Monetary Theory I 224
3.6 The following graph shows that if aggregate demand increases from AD1 to AD2 the price level
3.7 With both the price level and the output level falling, the aggregate demand curve must have shifted
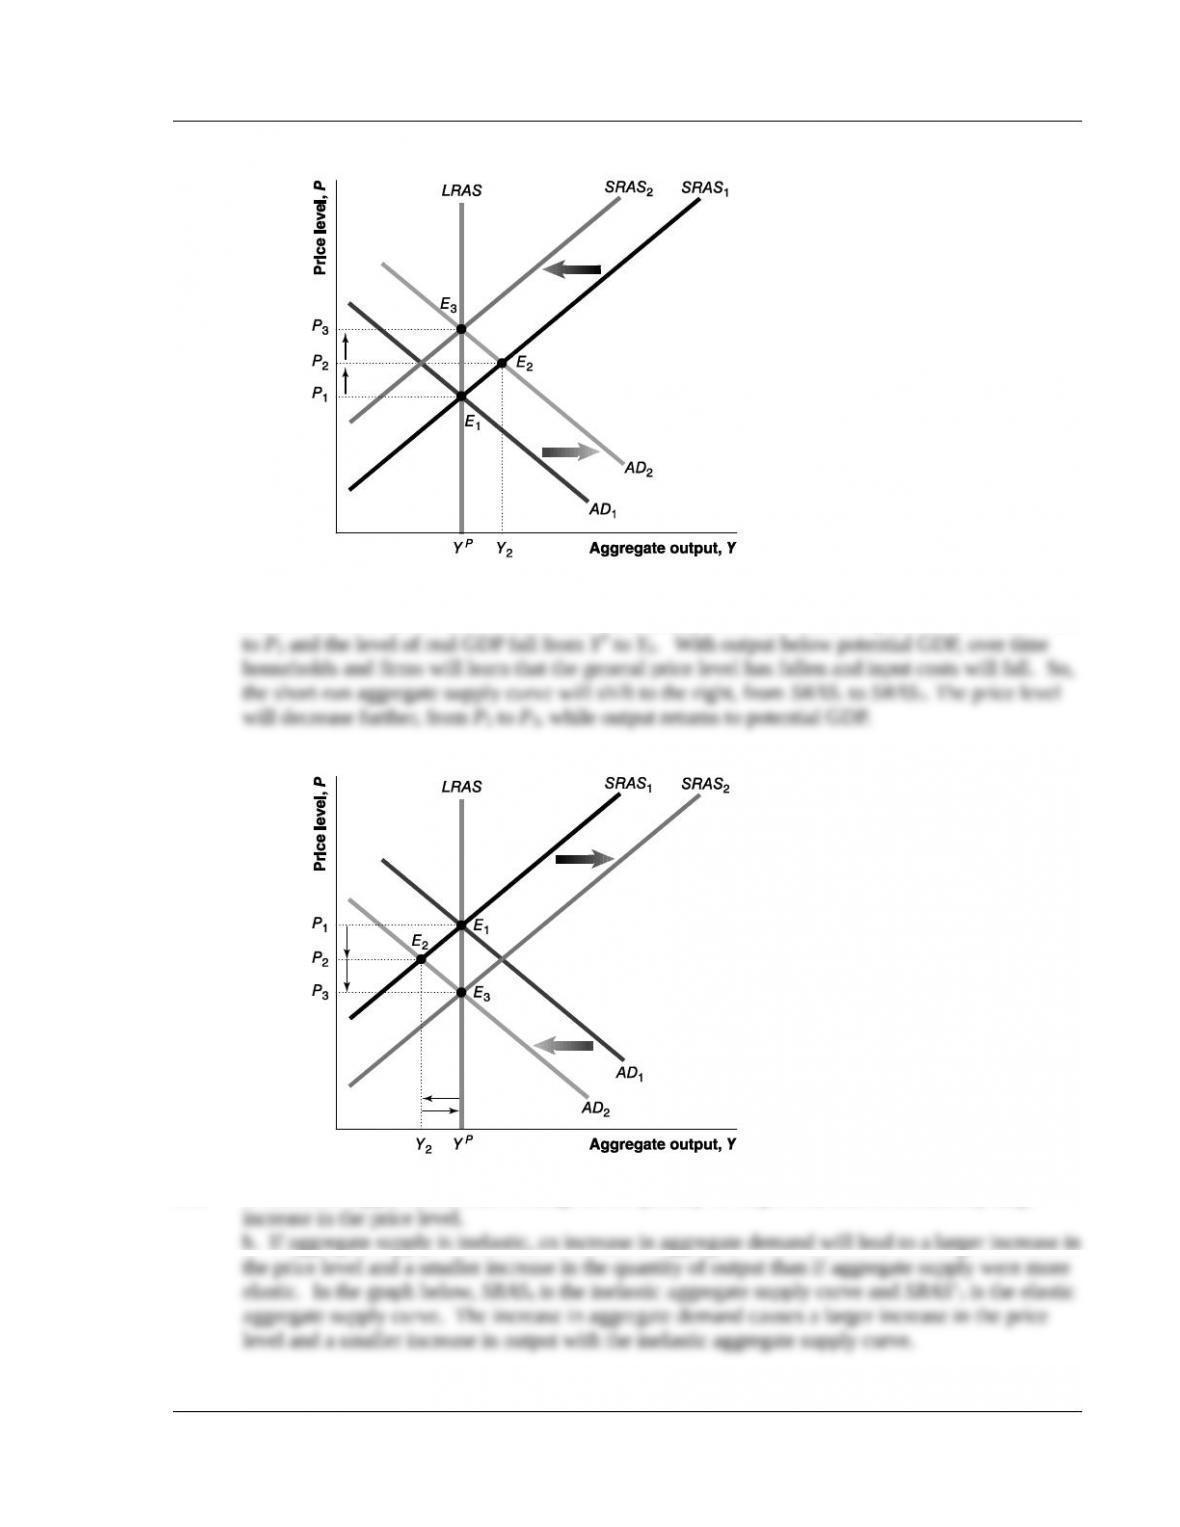
3.8 The increase in government purchases causes the aggregate demand curve to shift to the right from
AD1 to AD2. As a result, in the short run, the price level increases from P1 to P2 and the level of
© 2014 Pearson Education, Inc
Chapter 17 Monetary Theory I 225
3.9 The decline in income in Europe decreases U.S. net exports, which causes the aggregate demand
curve to shift to the left from AD1 to AD2. As a result, in the short run, the price level falls from P1
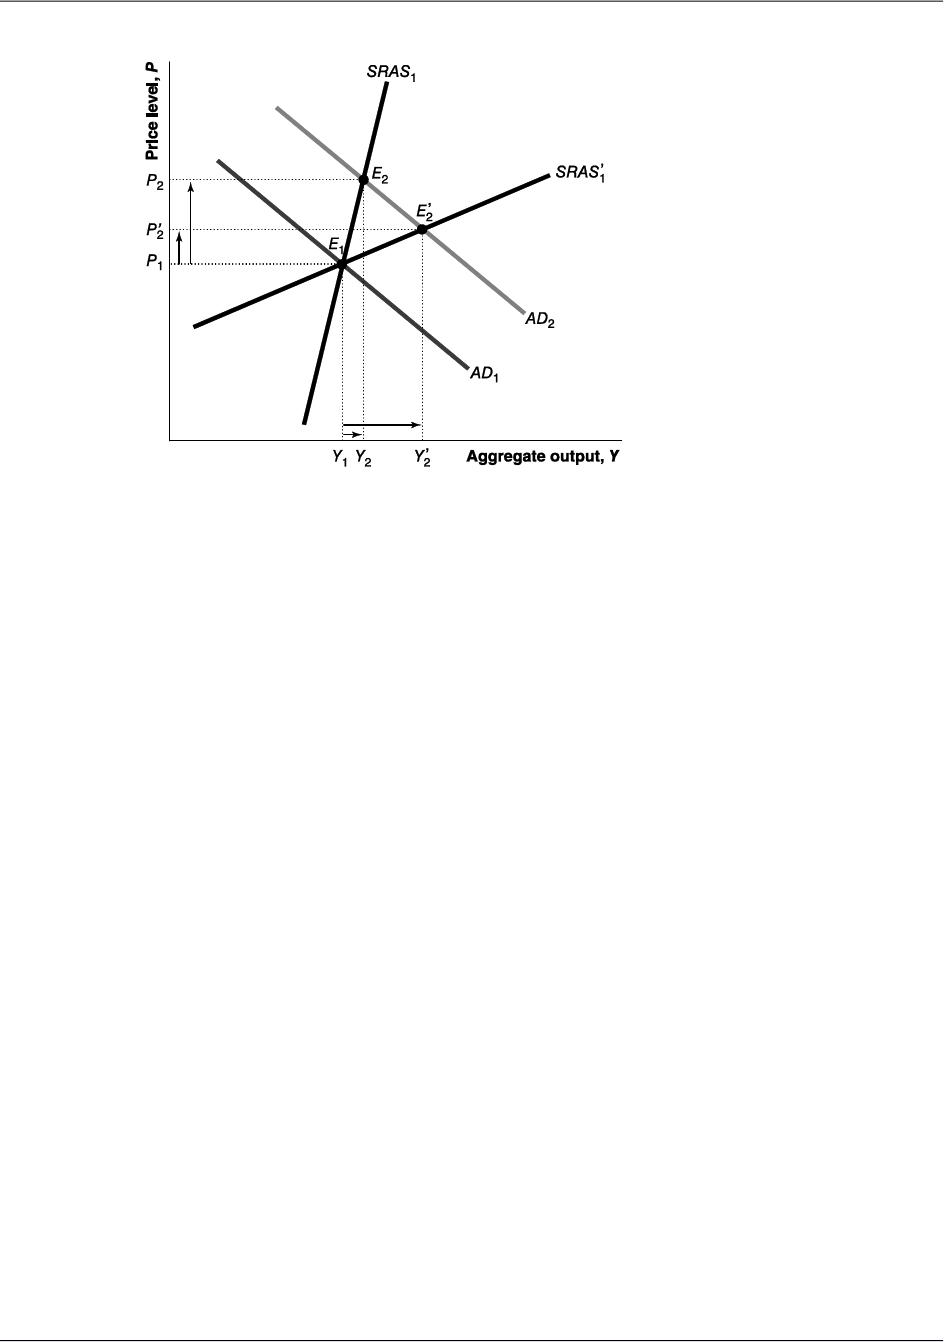
3.10 a. Inelastic supply means that a change in the quantity of output will lead to a relatively large
b. If aggregate supply is inelastic, an increase in aggregate demand will lead to a larger increase in
© 2014 Pearson Education, Inc
Chapter 17 Monetary Theory I 226
© 2014 Pearson Education, Inc