
Additional Issues for Classroom Discussion
1. Should the Government Try to Prevent Recessions?
Ask your class if they think the government should try to prevent recessions. Most people do, but some
2. Should Government Policy Prevent the Seasonal Cycle?
Most of the data that economists look at has been adjusted to remove seasonal influences. For example,
3. Do Recessions Have Any Positive Economic Effects?
Recessions cause hardships to many people who lose their jobs or whose incomes decline. The entire
economy slows down, making it harder for people to change jobs or for college and high-school graduates
to find jobs. Many small businesses fail, and people who had planned to open businesses wait until times
are better.
1. Figure 8.7 illustrates both the recurrence and persistence of the business cycle. The business cycle is
recurrent, as there are repeated episodes of contractions and expansions over time. The business
2. Comovement means that many economic variables move together in a predictable way over the
business cycle. The business cycle facts presented in the chapter illustrate comovement among all
the variables listed in text Summary Table 10 that are either procyclical (moving in the same
direction as aggregate economic activity) or countercyclical (moving in the opposite direction as
aggregate economic activity). Only those variables listed as acyclical do not show comovement.
3. There is some question as to whether or not the business cycle has become less volatile over time.
Originally it was thought that the cycle had been moderated, especially since World War II, but
Romer challenged this notion. Further examination of the data by Balke and Gordon, however,
shows that there has been some moderation of the business cycle.
4. A variable that moves in the same direction as aggregate economic activity is said to be procyclical,
while a variable that moves in the opposite direction is countercyclical. If the peaks and troughs of a
5. If the economy were entering a recession, you’d expect production, investment, average labor
productivity, and the real wage to decline because they are all procyclical, and the unemployment
6. The fact that some economic variables are known to lead the business cycle is used to develop an
index of leading economic indicators. The index is used to forecast economic turning points.
7. The two components of a theory of business cycles are: (1) A description of the types of factors
(called “shocks”) that have major impacts on the economy, such as wars, new inventions, harvest
8. Keynesians and classicals differ sharply in their beliefs about how long it takes the economy to reach
a long-run equilibrium. Classical economists believe that prices adjust rapidly (within a few months)
to restore equilibrium in the face of a shock, while Keynesians believe that prices adjust slowly,
taking perhaps several years.
Because of the time it takes for the economy’s equilibrium to be restored, Keynesians see an
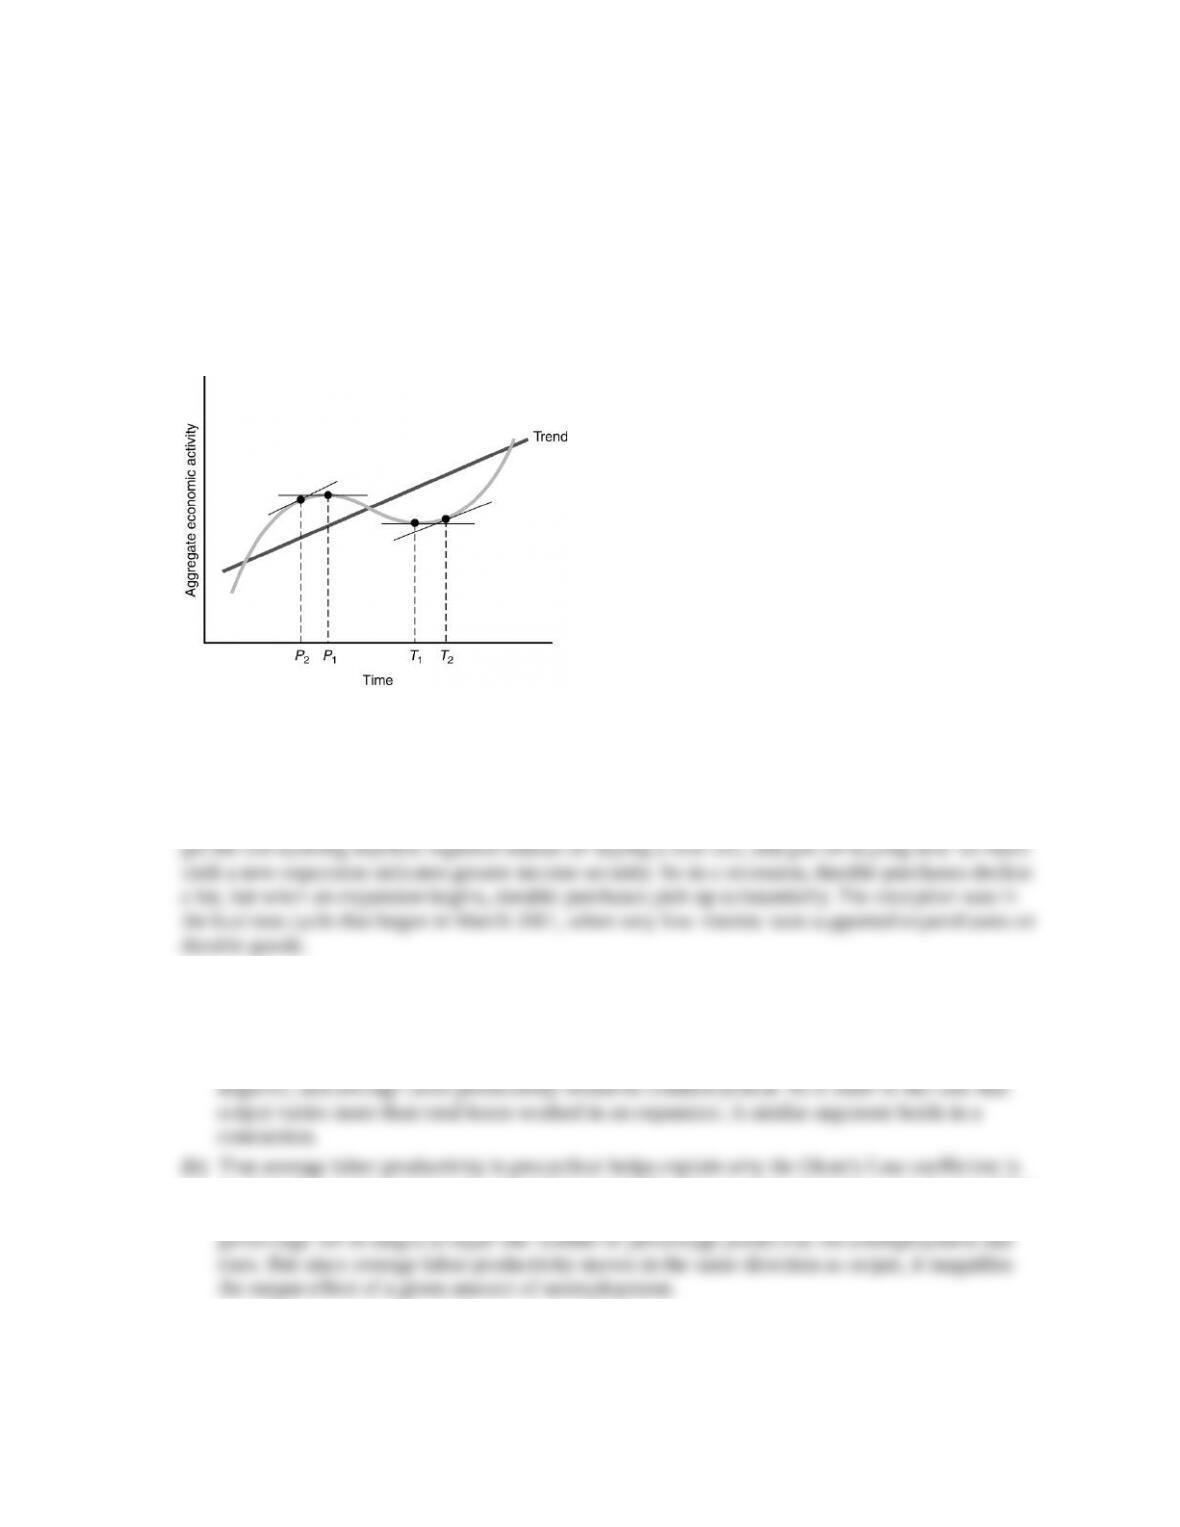
1. Figure 8.8 illustrates the business cycle. The current NBER method picks peaks and troughs in the
level of aggregate economic activity, which are points on the figure where the slope of the line is
zero. These are shown in Figure 8.8 as P1 (at the peak of the cycle) and T1 (at the trough of the
cycle). However, the older method picks peaks and troughs in detrended economic activity. This
means the peaks and troughs occur at points that are the farthest away from the trend line, which
2. Expenditure on durable goods is more sensitive to the business cycle than expenditure on nondurable
goods and services, because people can more easily change the timing of their expenditure on durables.
When economic activity is weak, and people face the danger of losing their jobs, they avoid making
durable goods purchases. Instead, they may drive their cars a little longer before buying new ones,
3. (a) In symbols, let A average labor productivity, Y output, and H total hours worked. By
definition, A Y/H, so in growth terms, A/A Y/Y H/H. Since all three are procyclical,
they all move in the same direction over the business cycle. If total hours worked varied more
than output in an expansion, then H/H would be greater than Y/Y, so that A/A would be
2, not 1. A one-percentage point increase in unemployment is approximately a one percent fall in
employment. Thus, if there were no change in average labor productivity, we might expect the
4. Figure 8.9 illustrates the effects of a demand shock. The economy begins in equilibrium at point A,
where the LRAS, SRAS, and AD curves intersect. The demand shock shifts the aggregate demand
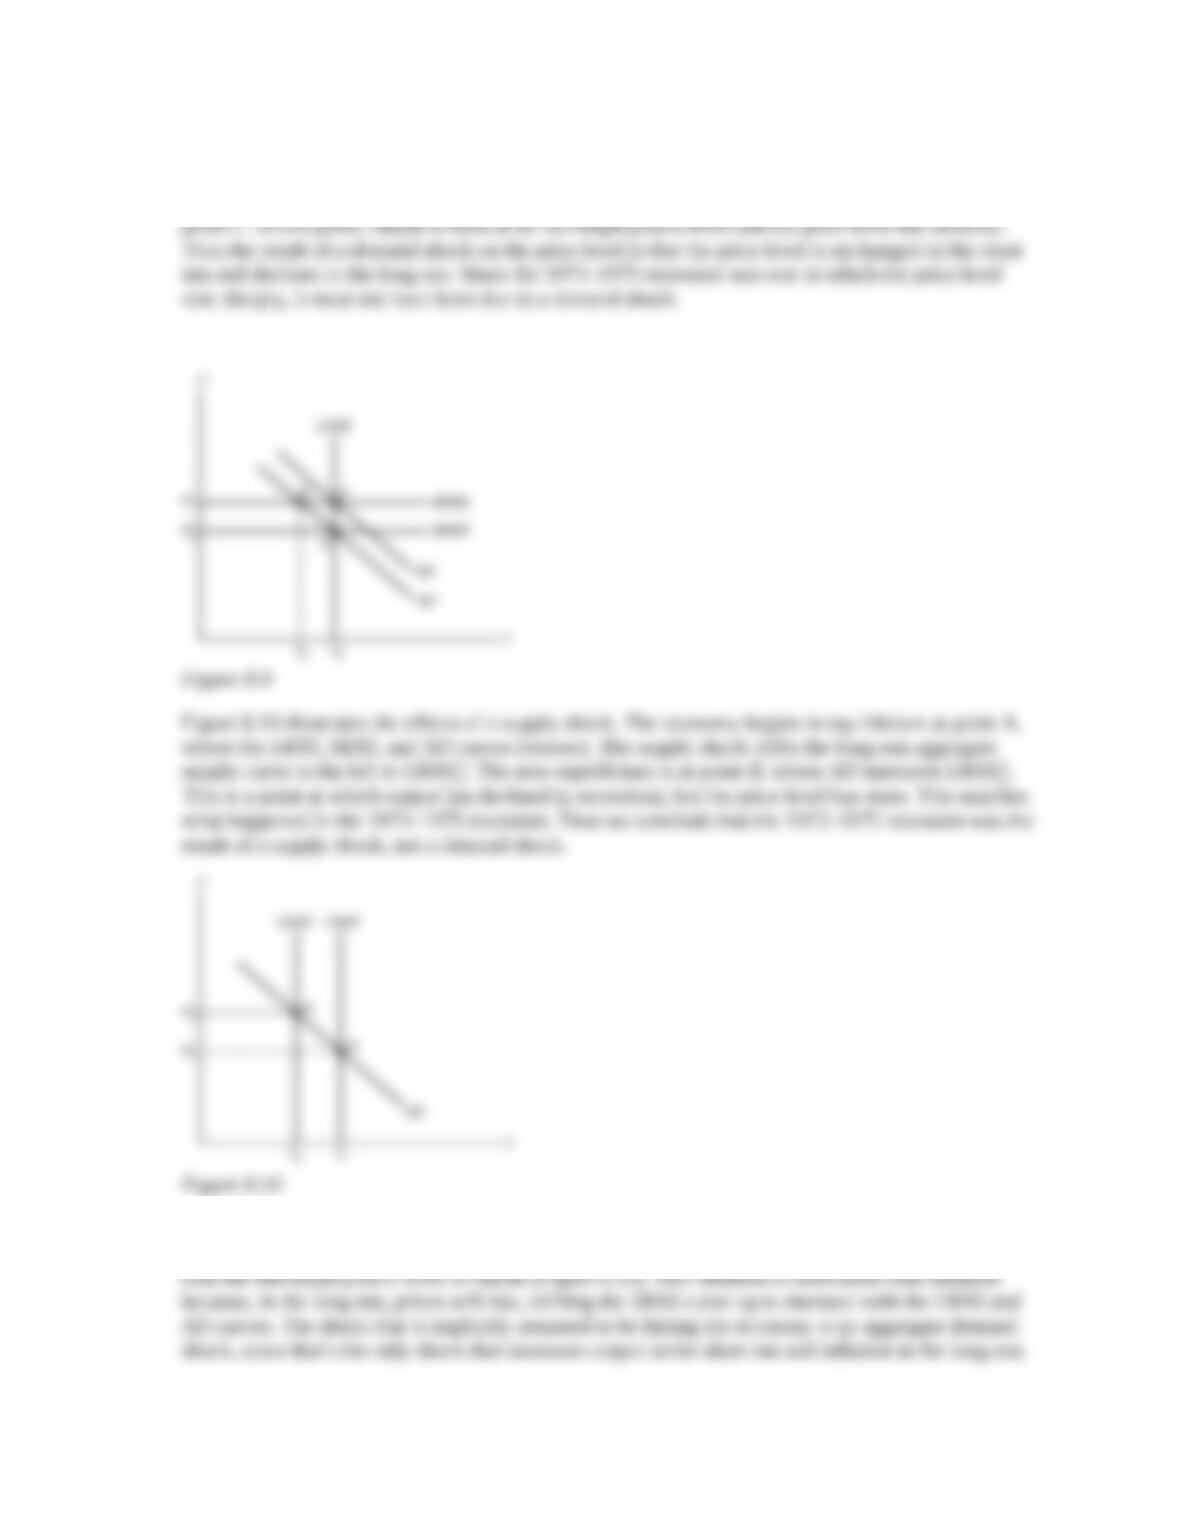
curve to the left to AD. In the short run, the equilibrium is at point B, where AD intersects SRAS.
This is a point at which output has declined (a recession), but the price level is unchanged. Over
time, the short-run aggregate supply curve shifts down to SRAS, restoring long-run equilibrium at
5. Growth that is “too rapid” most likely refers to a situation in which the aggregate demand curve has
shifted to the right and, in the short run, intersects the SRAS curve at a level of output that’s greater

3. There is some question as to whether or not the business cycle has become less volatile over time.
Originally it was thought that the cycle had been moderated, especially since World War II, but
Romer challenged this notion. Further examination of the data by Balke and Gordon, however,
shows that there has been some moderation of the business cycle.
4. A variable that moves in the same direction as aggregate economic activity is said to be procyclical,
while a variable that moves in the opposite direction is countercyclical. If the peaks and troughs of a
5. If the economy were entering a recession, you’d expect production, investment, average labor
productivity, and the real wage to decline because they are all procyclical, and the unemployment
6. The fact that some economic variables are known to lead the business cycle is used to develop an
index of leading economic indicators. The index is used to forecast economic turning points.
7. The two components of a theory of business cycles are: (1) A description of the types of factors
(called “shocks”) that have major impacts on the economy, such as wars, new inventions, harvest
8. Keynesians and classicals differ sharply in their beliefs about how long it takes the economy to reach
a long-run equilibrium. Classical economists believe that prices adjust rapidly (within a few months)
to restore equilibrium in the face of a shock, while Keynesians believe that prices adjust slowly,
taking perhaps several years.
Because of the time it takes for the economy’s equilibrium to be restored, Keynesians see an
1. Figure 8.8 illustrates the business cycle. The current NBER method picks peaks and troughs in the
level of aggregate economic activity, which are points on the figure where the slope of the line is
zero. These are shown in Figure 8.8 as P1 (at the peak of the cycle) and T1 (at the trough of the
cycle). However, the older method picks peaks and troughs in detrended economic activity. This
means the peaks and troughs occur at points that are the farthest away from the trend line, which
2. Expenditure on durable goods is more sensitive to the business cycle than expenditure on nondurable
goods and services, because people can more easily change the timing of their expenditure on durables.
When economic activity is weak, and people face the danger of losing their jobs, they avoid making
durable goods purchases. Instead, they may drive their cars a little longer before buying new ones,
3. (a) In symbols, let A average labor productivity, Y output, and H total hours worked. By
definition, A Y/H, so in growth terms, A/A Y/Y H/H. Since all three are procyclical,
they all move in the same direction over the business cycle. If total hours worked varied more
than output in an expansion, then H/H would be greater than Y/Y, so that A/A would be
2, not 1. A one-percentage point increase in unemployment is approximately a one percent fall in
employment. Thus, if there were no change in average labor productivity, we might expect the
4. Figure 8.9 illustrates the effects of a demand shock. The economy begins in equilibrium at point A,
where the LRAS, SRAS, and AD curves intersect. The demand shock shifts the aggregate demand
curve to the left to AD. In the short run, the equilibrium is at point B, where AD intersects SRAS.
This is a point at which output has declined (a recession), but the price level is unchanged. Over
time, the short-run aggregate supply curve shifts down to SRAS, restoring long-run equilibrium at
5. Growth that is “too rapid” most likely refers to a situation in which the aggregate demand curve has
shifted to the right and, in the short run, intersects the SRAS curve at a level of output that’s greater