1. Decompose into growth rate form: the growth accounting equation
Y/Y A/A aK K/K aN N/N(6.2)
2. The a terms are the elasticities of output with respect to the inputs (capital and labor)
3. Interpretation
a. A rise of 10% in A raises output by 10%
4. Both aK and aN are less than 1 due to diminishing marginal productivity
B. Growth accounting
1. Four steps in breaking output growth into its causes (productivity growth, capital input
growth, labor input growth)
2. Growth accounting and the productivity slowdown
a. Denison’s results for 1929–1982 (text Table 6.3)
(1) Entire period output growth 2.92%; due to labor 1.34%; due to capital 0.56%; due to
productivity 1.02%
(2) Pre-1948 capital growth was much slower than post-1948
3. Application: the post-1973 slowdown in productivity growth
What caused the decline in productivity?
a. Measurement—inadequate accounting for quality improvements
b. The legal and human environment—regulations for pollution control and worker safety,
crime, and declines in educational quality
1990 meant slower growth
4. Application: the recent surge in U.S. productivity growth
a. Labor productivity growth increased sharply in the second half of the 1990s
b. Labor productivity and TFP grew steadily from 1982 to 2008 (text Fig. 6.1)
c. Labor productivity growth has generally exceeded TFP growth since 1995 (Fig. 6.2)
d. The gap between labor productivity growth and TFP growth can be seen in the equation
K
Y N A K N
a
Y N A K N
D D D D D
æ ö
– = + –
ç ÷
è ø
(6.3)
(1) Equation (6.3) suggests that labor productivity growth (the left-side term) exceeds
TFP growth (the first right-side term) when capital growth exceeds labor growth
e. The increase in labor productivity can be traced to the ICT (information and
communications technologies) revolution
(1) But other countries also had an ICT revolution, and their labor productivity did not
rise as much as in the United States
(2) European labor productivity did not rise as much as in the U.S. because of
government regulations
f. Why is there such a lag between ICT investment and increases in productivity?
(1) Because productivity improvements require not just technological advances, but also
investment in intangible capital—research and development, reorganization of firms,
and worker training
g. Is the recent episode unique in U.S. history?
(1) Not really: 1873–1890—steam power, trains, telegraph; 1917–1927—electrification
in factories; 1948–1973—transistor
II. Long-Run Growth: The Solow Model (Sec. 6.2)
A. Two basic questions about growth
1. What’s the relationship between the long-run standard of living and the saving rate,
population growth rate, and rate of technical progress?
2. How does economic growth change over time? Will it speed up, slow down, or stabilize?
B. Setup of the Solow model
1. Basic assumptions and variables
a. Population and work force grow at same rate n
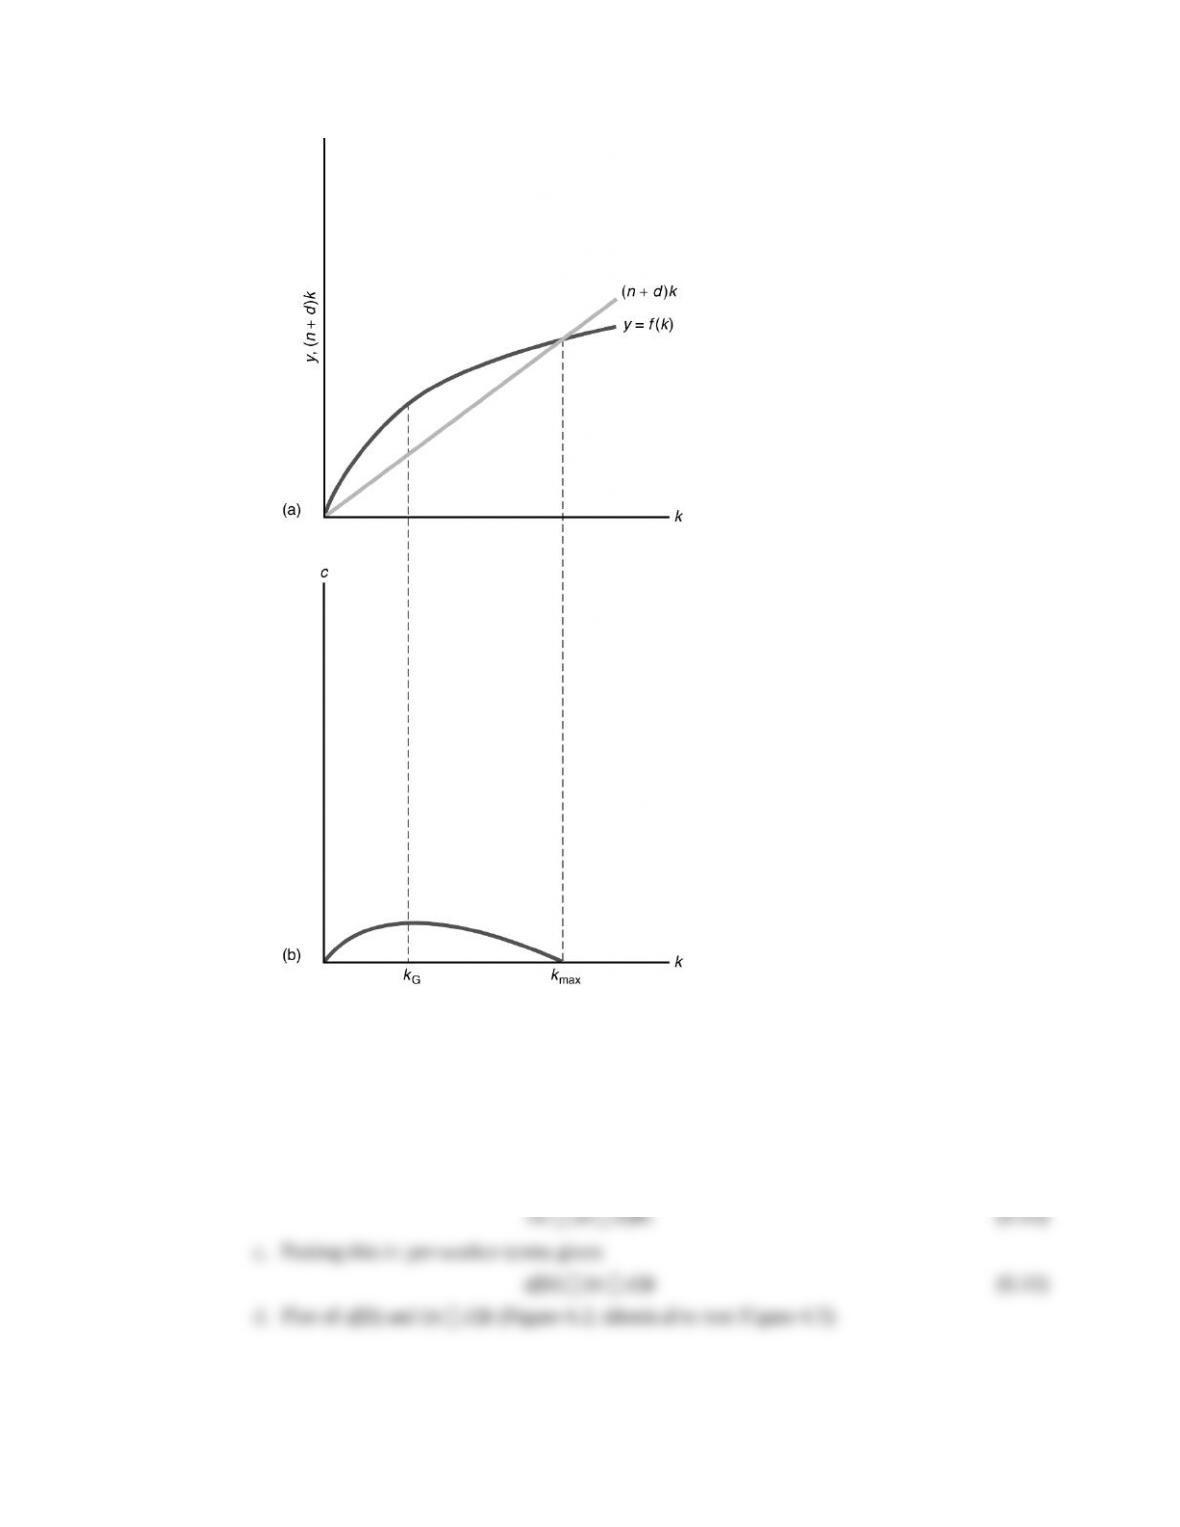
2. The per-worker production function
a. yt f(kt) (6.5)
3. Steady states
a. Steady state: yt, ct, and kt are constant over time
b. Gross investment must
(1) Replace worn out capital, dKt
(2) Expand so the capital stock grows as the economy grows, nKt
4. Reaching the steady state
a. Suppose saving is proportional to current income:
St sYt, (6.9)
where s is the saving rate, which is between 0 and 1
b. Equating saving to investment gives
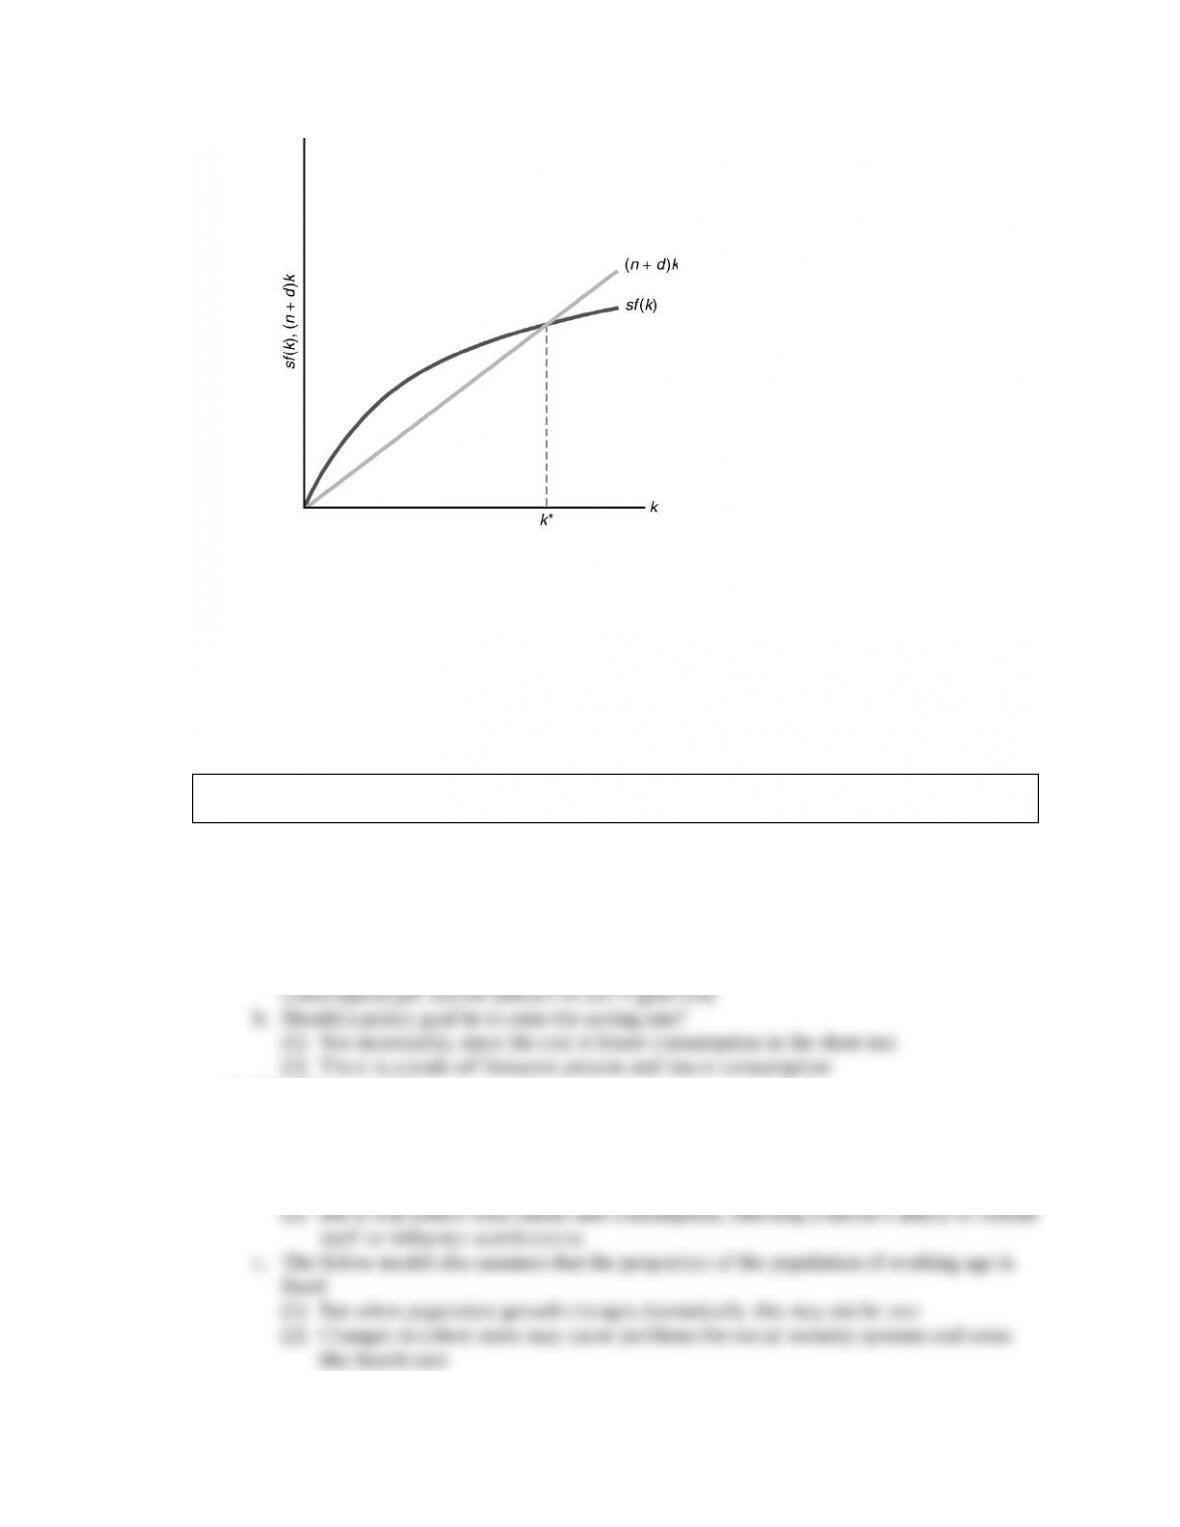
1. The saving rate
a. Higher saving rate means higher capital-labor ratio, higher output per worker, and higher
2. Population growth
a. Higher population growth means a lower capital-labor ratio, lower output per worker,
and lower consumption per worker (shown in text Figure 6.7)
b. Should a policy goal be to reduce population growth?
(1) Doing so will raise consumption per worker
3. Productivity growth
a. The key factor in economic growth is productivity improvement
b. Productivity improvement raises output per worker for a given level of the capital-labor
ratio (text Fig. 6.8)
c. In equilibrium, productivity improvement increases the capital-labor ratio, output per
4. Application: The growth of China
a. China is an economic juggernaut
(1) Population 1.4 billion people
(2) Real GDP per capita is low but growing (Table 6.4)
(3) Starting with low level of GDP, but growing rapidly (Fig. 6.10)
1. Constant MPK
a. Human capital
(1) Knowledge, skills, and training of individuals
(2) Human capital tends to increase in same proportion as physical capital

1992, pp. 1–12. For an excellent and more detailed overview of endogenous growth theory, see
the symposium in the Journal of Economic Perspectives, Winter 1994.
1. Suppose saving is a constant fraction of output: S sAK
2. Since investment net investment depreciation, I K dK
3. Setting investment equal to saving implies:
K dK sAK (6.13)
4. Rearrange (6.13):
K/K sA d(6.14)
5. Since output is proportional to capital, Y/Y K/K, so
Y/Y sA d (6.15)
6. Thus the saving rate affects the long-run growth rate (not true in Solow model)
Theoretical Application
1. Endogenous growth theory attempts to explain, rather than assume, the economy’s
growth rate
2. The growth rate depends on many things, such as the saving rate, that can be affected by
government policies
Policy Application
For a good recent review of how government policy can contribute to economic growth, see
Satyajit Chatterjee, “Making More Out of Less: The Recipe for Long-Term Economic Growth,”
1. If the private market is efficient, the government shouldn’t try to change the saving rate
a. The private market’s saving rate represents its trade-off of present for future
2. How can saving be increased?
a. One way is to raise the real interest rate to encourage saving; but the response of saving
to changes in the real interest rate seems to be small
b. Another way is to increase government saving
1. Improving infrastructure
a. Infrastructure: highways, bridges, utilities, dams, and airports
b. Empirical studies suggest a link between infrastructure and productivity
c. U.S. infrastructure spending has declined in the last two decades
2. Building human capital
a. There’s a strong connection between productivity and human capital

3. Encouraging research and development
a. Support scientific research
b. Fund government research facilities
c. Provide grants to researchers
4. Both aK and aN are less than 1 due to diminishing marginal productivity
B. Growth accounting
1. Four steps in breaking output growth into its causes (productivity growth, capital input
growth, labor input growth)
2. Growth accounting and the productivity slowdown
a. Denison’s results for 1929–1982 (text Table 6.3)
(1) Entire period output growth 2.92%; due to labor 1.34%; due to capital 0.56%; due to
productivity 1.02%
(2) Pre-1948 capital growth was much slower than post-1948
3. Application: the post-1973 slowdown in productivity growth
What caused the decline in productivity?
a. Measurement—inadequate accounting for quality improvements
b. The legal and human environment—regulations for pollution control and worker safety,
crime, and declines in educational quality
1990 meant slower growth
4. Application: the recent surge in U.S. productivity growth
a. Labor productivity growth increased sharply in the second half of the 1990s
b. Labor productivity and TFP grew steadily from 1982 to 2008 (text Fig. 6.1)
c. Labor productivity growth has generally exceeded TFP growth since 1995 (Fig. 6.2)
d. The gap between labor productivity growth and TFP growth can be seen in the equation
K
Y N A K N
a
Y N A K N
D D D D D
æ ö
– = + –
ç ÷
è ø
(6.3)
(1) Equation (6.3) suggests that labor productivity growth (the left-side term) exceeds
TFP growth (the first right-side term) when capital growth exceeds labor growth
e. The increase in labor productivity can be traced to the ICT (information and
communications technologies) revolution
(1) But other countries also had an ICT revolution, and their labor productivity did not
rise as much as in the United States
(2) European labor productivity did not rise as much as in the U.S. because of
government regulations
f. Why is there such a lag between ICT investment and increases in productivity?
(1) Because productivity improvements require not just technological advances, but also
investment in intangible capital—research and development, reorganization of firms,
and worker training
g. Is the recent episode unique in U.S. history?
(1) Not really: 1873–1890—steam power, trains, telegraph; 1917–1927—electrification
in factories; 1948–1973—transistor
II. Long-Run Growth: The Solow Model (Sec. 6.2)
A. Two basic questions about growth
1. What’s the relationship between the long-run standard of living and the saving rate,
population growth rate, and rate of technical progress?
2. How does economic growth change over time? Will it speed up, slow down, or stabilize?
B. Setup of the Solow model
1. Basic assumptions and variables
a. Population and work force grow at same rate n
2. The per-worker production function
a. yt f(kt) (6.5)
3. Steady states
a. Steady state: yt, ct, and kt are constant over time
b. Gross investment must
(1) Replace worn out capital, dKt
(2) Expand so the capital stock grows as the economy grows, nKt
4. Reaching the steady state
a. Suppose saving is proportional to current income:
St sYt, (6.9)
where s is the saving rate, which is between 0 and 1
b. Equating saving to investment gives
1. The saving rate
a. Higher saving rate means higher capital-labor ratio, higher output per worker, and higher
2. Population growth
a. Higher population growth means a lower capital-labor ratio, lower output per worker,
and lower consumption per worker (shown in text Figure 6.7)
b. Should a policy goal be to reduce population growth?
(1) Doing so will raise consumption per worker
3. Productivity growth
a. The key factor in economic growth is productivity improvement
b. Productivity improvement raises output per worker for a given level of the capital-labor
ratio (text Fig. 6.8)
c. In equilibrium, productivity improvement increases the capital-labor ratio, output per
4. Application: The growth of China
a. China is an economic juggernaut
(1) Population 1.4 billion people
(2) Real GDP per capita is low but growing (Table 6.4)
(3) Starting with low level of GDP, but growing rapidly (Fig. 6.10)
1. Constant MPK
a. Human capital
(1) Knowledge, skills, and training of individuals
(2) Human capital tends to increase in same proportion as physical capital
1992, pp. 1–12. For an excellent and more detailed overview of endogenous growth theory, see
the symposium in the Journal of Economic Perspectives, Winter 1994.
1. Suppose saving is a constant fraction of output: S sAK
2. Since investment net investment depreciation, I K dK
3. Setting investment equal to saving implies:
K dK sAK (6.13)
4. Rearrange (6.13):
K/K sA d(6.14)
5. Since output is proportional to capital, Y/Y K/K, so
Y/Y sA d (6.15)
6. Thus the saving rate affects the long-run growth rate (not true in Solow model)
Theoretical Application
1. Endogenous growth theory attempts to explain, rather than assume, the economy’s
growth rate
2. The growth rate depends on many things, such as the saving rate, that can be affected by
government policies
Policy Application
For a good recent review of how government policy can contribute to economic growth, see
Satyajit Chatterjee, “Making More Out of Less: The Recipe for Long-Term Economic Growth,”
1. If the private market is efficient, the government shouldn’t try to change the saving rate
a. The private market’s saving rate represents its trade-off of present for future
2. How can saving be increased?
a. One way is to raise the real interest rate to encourage saving; but the response of saving
to changes in the real interest rate seems to be small
b. Another way is to increase government saving
1. Improving infrastructure
a. Infrastructure: highways, bridges, utilities, dams, and airports
b. Empirical studies suggest a link between infrastructure and productivity
c. U.S. infrastructure spending has declined in the last two decades
2. Building human capital
a. There’s a strong connection between productivity and human capital
3. Encouraging research and development
a. Support scientific research
b. Fund government research facilities
c. Provide grants to researchers