Unlock document.
This document is partially blurred.
Unlock all pages and 1 million more documents.
Get Access
1. The record of a country’s international transactions
2. Text Table 5.1 shows recent U.S. data
3. Any transaction that involves a flow of money into the United States is a credit () item
(enters with a plus sign); for example, exports
4. Any transaction involving a flow of money out of the United States is a debit () item
(enters with a minus sign); for example, imports
5. In touch with data and research: the balance of payments accounts
Data released quarterly in Survey of Current Business
1. Net exports of goods and services
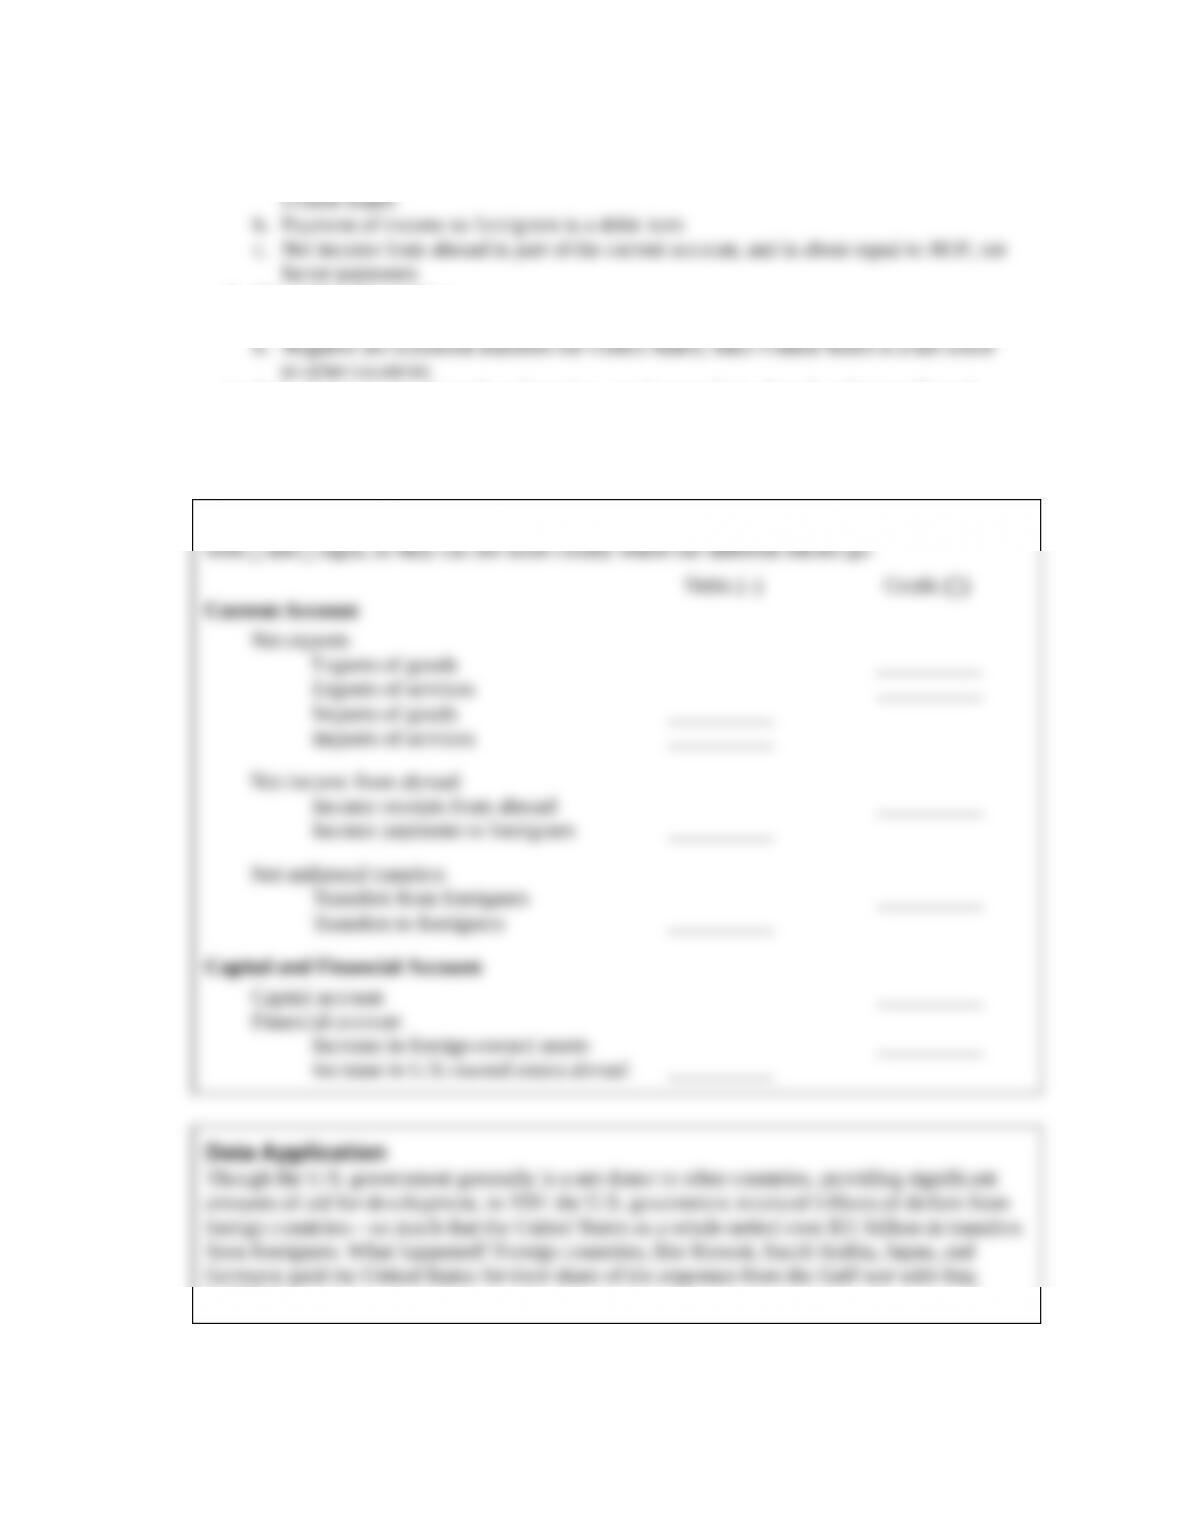
2. Net income from abroad
a. Income received from abroad is a credit item, since it causes funds to flow into the
3. Net unilateral transfers
a. Payments made from one country to another
4. Sum of net exports of goods and services, net income from abroad, and net unilateral
transfers is the current account balance
a. Positive current account balance implies current account surplus
b. Negative current account balance implies current account deficit
Students may be helped if you draw the basic balance of payments chart without numbers, but
in 1991.
C. The capital and financial account
1. The capital and financial account records trades in existing assets, either real (for example,
houses) or financial (for example, stocks and bonds)
2. The capital account records the net flow of unilateral transfers of assets into the country
3. Most transactions appear in the financial account part of the capital and financial account
a. When home country sells assets to foreign country, that is a capital inflow for the home
4. The official settlements balance
a. Transactions in official reserve assets are conducted by central banks of countries
b. Official reserve assets are assets (foreign government securities, bank deposits, and
SDRs of the IMF, gold) used in making international payments
c. Central banks buy (or sell) official reserve assets with (or to obtain) their own currencies
1. Current account balance (CA) capital and financial account balance (KFA) 0 (5.1)
2. CA KFA 0 by accounting; every transaction involves offsetting effects
3. Examples given of offsetting transactions (text Table 5.2)
Analytical Problem 2 gives students practice with offsetting transactions in the balance of
4. In practice, measurement problems, recorded as a statistical discrepancy, prevent
CA KFA 0 from holding exactly
1. Net foreign assets are a country’s foreign assets minus its foreign liabilities
a. Net foreign assets may change in value (example: change in stock prices)
2. The net increase in foreign assets equals a country’s current account surplus
3. A current account surplus implies a capital and financial account deficit, and thus a net
increase in holdings of foreign assets (a financial outflow)
4. A current account deficit implies a capital and financial account surplus, and thus a net
decline in holdings of foreign assets (a financial inflow)
5. Foreign direct investment: a foreign firm buys or builds capital goods
a. Causes an increase in capital and financial account balance
6. Summary: Equivalent measures of a country’s international trade and lending
Current account surplus capital and financial account deficit net acquisition of foreign
1. The rise in foreign liabilities by the United States since the early 1980s has been very large
(text Figure 5.1)
2. The United States has become the world’s largest international debtor
3. But the net foreign debt of the United States relative to U.S. GDP is relatively small (27%)
compared with other countries (some of whom have net foreign debt of over 100% of GDP)
4. Despite the large net foreign debt, the United States has direct foreign investment
(companies, land) in other countries about equal in size to other countries’ foreign direct
5. Table 5.3 shows size of foreign countries’ holdings of U.S. debt
6. What really matters is not size of net foreign debt, but country’s wealth (physical and
human capital)
1. So national saving has two uses:
a. Increase the capital stock by domestic investment
2. To get goods market equilibrium, national saving and investment must equal their desired
levels:
3. Alternative method:
a. Y Cd Id G NX (5.5)
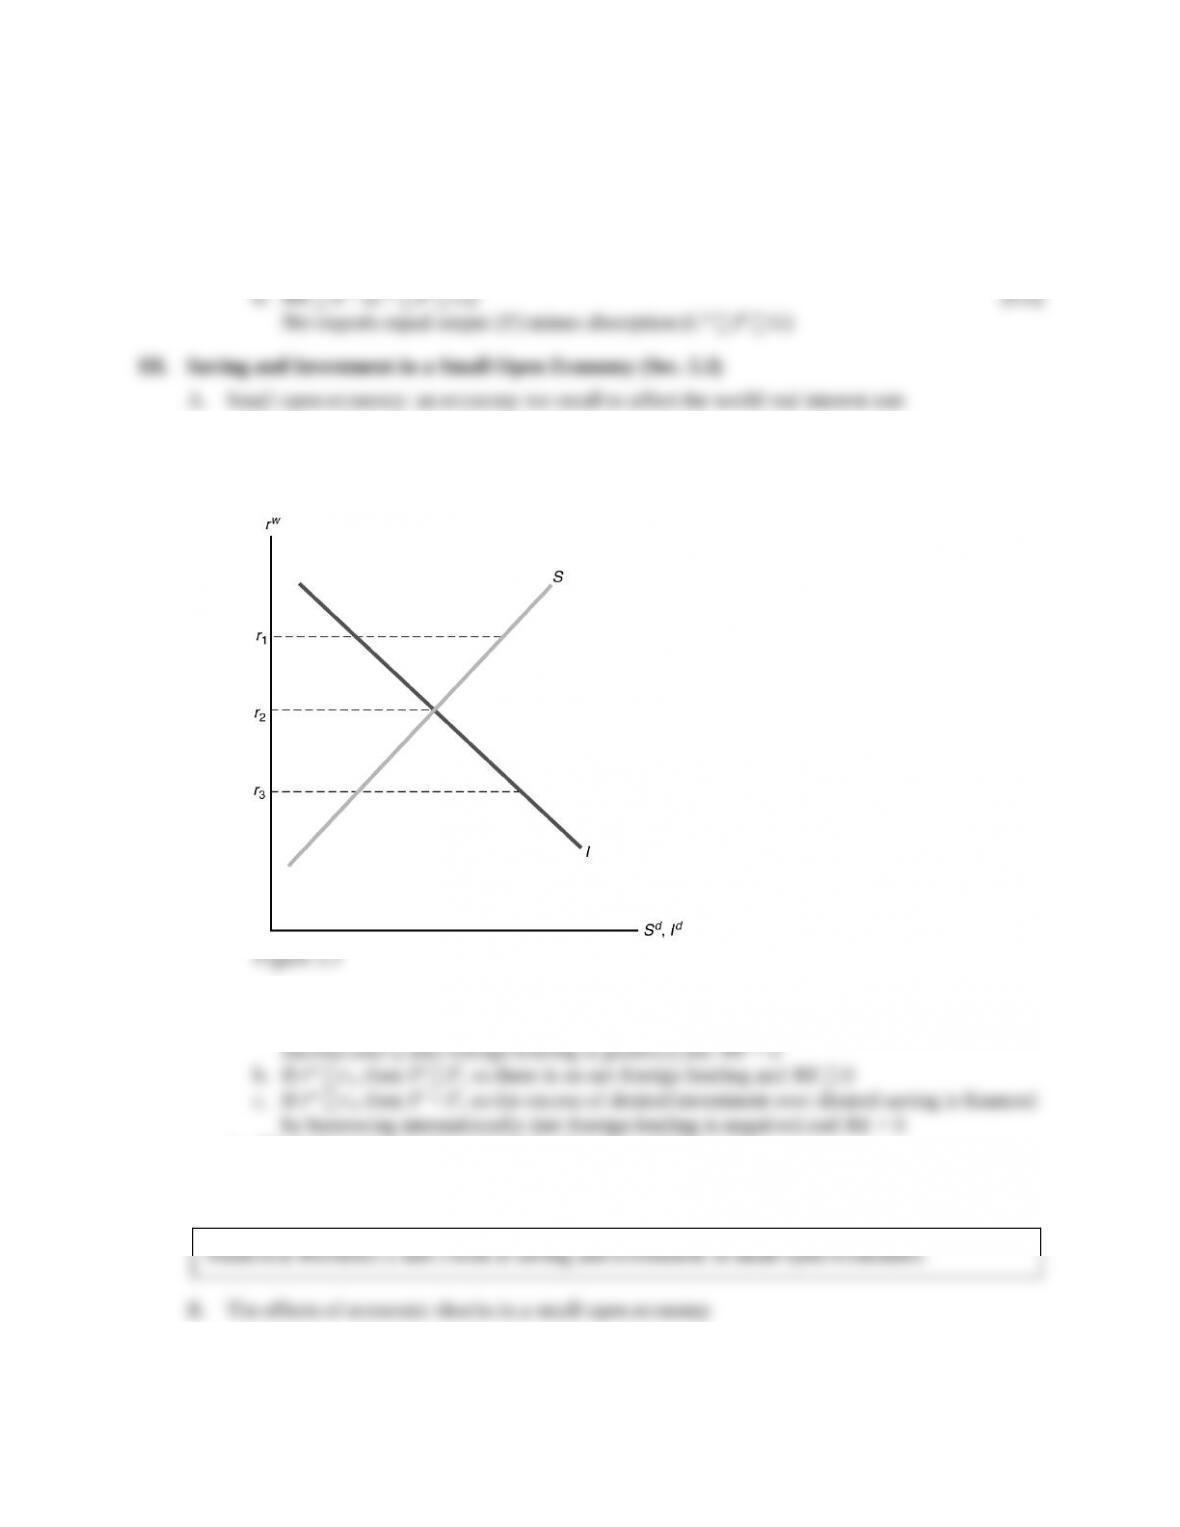
1. World real interest rate (rw): the real interest rate in the international capital market
2. Key assumption: Residents of the small open economy can borrow or lend at the expected
world real interest rate (Figure 5.1; Key diagram 4; like text Figures 5.2 and 5.3)
3. Result: rw may be such that Sd > Id, Sd Id, or Sd < Id
a. If rw r1, then Sd > Id, so the excess of desired saving over desired investment is lent
4. Alternative interpretation: in terms of output and absorption
5. Net exports equals net foreign lending equals the current account balance (assuming net
factor payments and net unilateral transfers are zero)
1. Anything that increases desired national saving (Y rises, future output falls, or G falls)
relative to desired investment (MPKf falls, rises) at a given world interest rate increases
2. A temporary adverse supply shock
Temporary drop in income leads to a drop in saving, so net foreign lending declines; shown
3. An increase in the expected future marginal product of capital
Desired investment rises, so net foreign lending falls; shown in text Figure 5.5
Data Application
Does the international capital market work well? Maurice Obstfeld, in his article, “Capital Mobility
in the World Economy: Theory and Measurement,” in K. Brunner and A. Meltzer, eds., Carnegie-
1. Suppose there are just two economies in the world
a. The home or domestic economy (saving S, investment I)
2. The world real interest rate moves to equilibrate desired international lending by one
country with desired international borrowing by the other (Figure 5.2; Key diagram 5; text
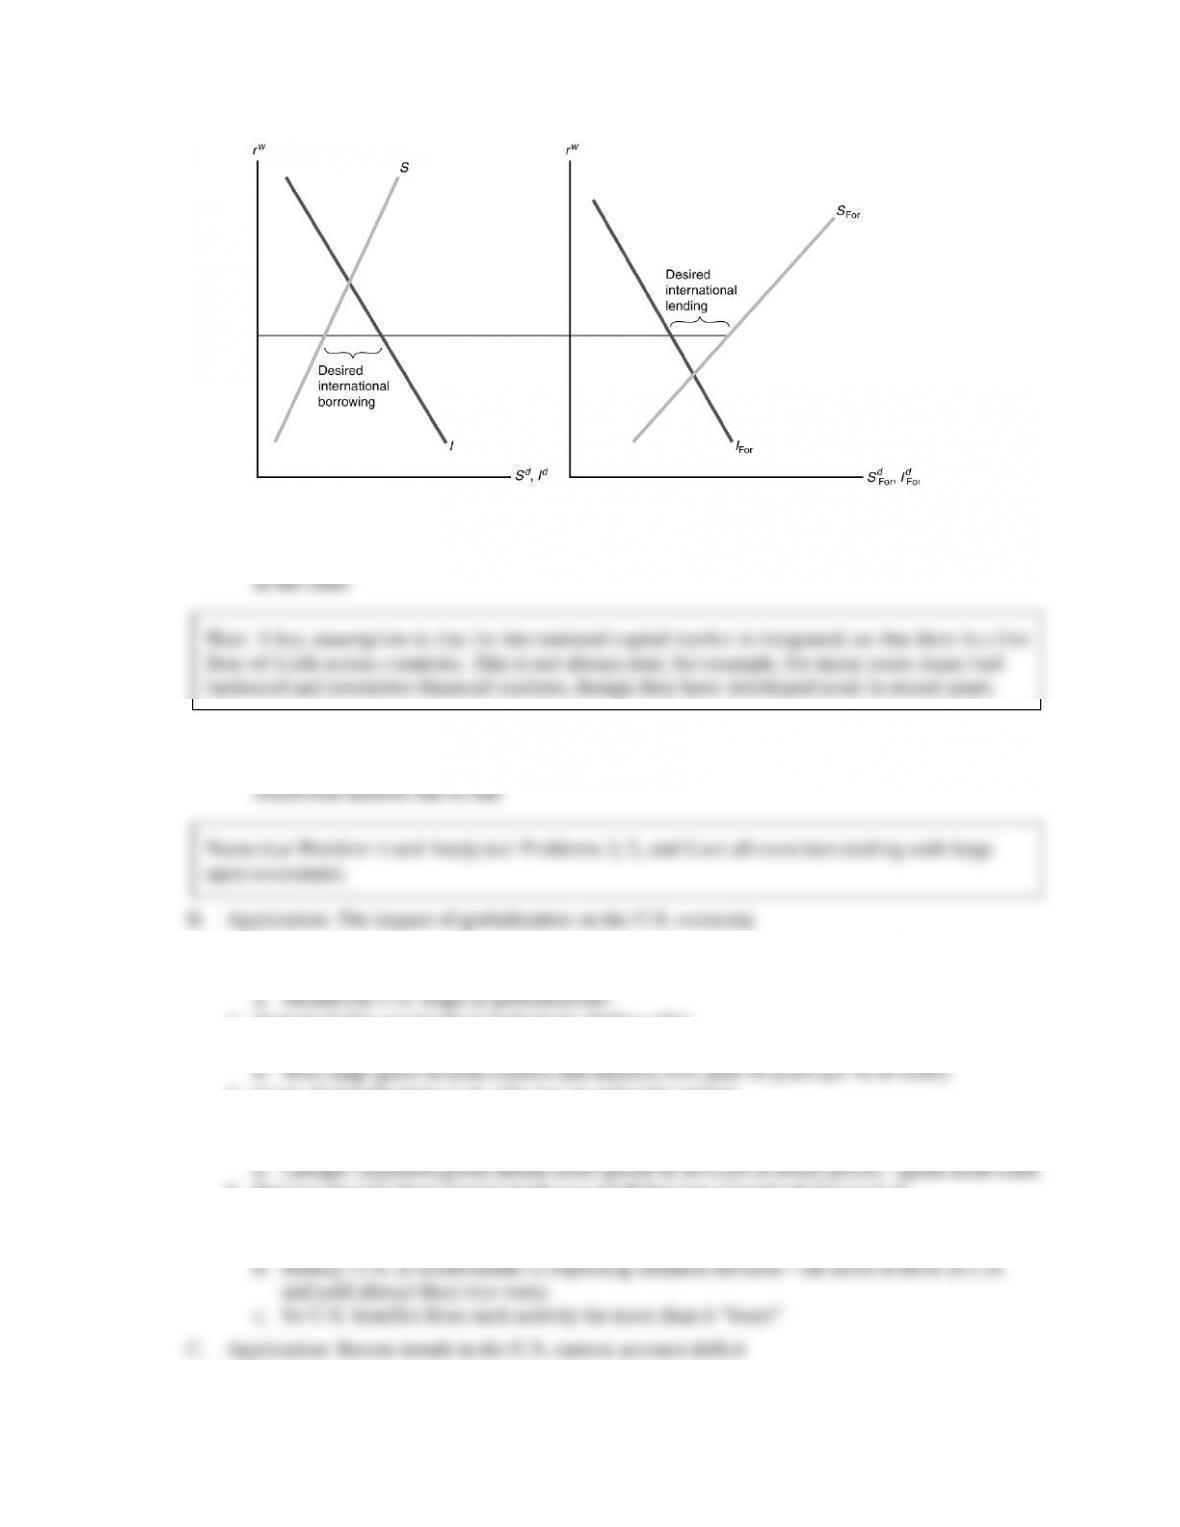
3. Equivalent statement: The equilibrium world real interest rate is determined such that a
current account surplus in one country is equal in magnitude to the current account deficit
4. Changes in the equilibrium world real interest rate: Any factor that increases desired
international lending of a country relative to desired international borrowing causes the
1. World’s economies are increasingly interdependent—more international trade
and investment
2. Historical data on trends in trade from 1929 to 2011
a. Text Figure 5.7
3. Costs of globalization: U.S. jobs lost in particular sectors
4. Benefits of globalization: U.S. jobs gained in particular sectors
a. U.S. exports increase
5. But loss for jobs from foreign trade is a small fraction of total job loss in U.S.
6. Recent years: big changes in business services industry—call centers, etc.
a. Critics: moving jobs abroad
1. U.S. current account deficit is large (text Fig. 5.8)
2. Why did U.S. current account deficit increase from 1991 to 2005?
a. Lower foreign demand
3. Lower foreign demand
a. Slower economic growth in Japan and Europe in early 2000s
4. Better international investment opportunities (text Fig. 5.9)
a. U.S. investors diversifying investments internationally
5. Higher oil prices
a. U.S. imports much more oil than it exports
6. Increased saving by developing countries
a. Many developing nations want to invest in safe places like U.S., rather than borrowing
7. Some people also blame U.S. government deficit—twin deficits argument
a. But in late 1990s, U.S. government ran surpluses, and current account deficit got larger
b. Other countries with current account surpluses also run larger government budget
deficits than U.S.
1. An increase in the government budget deficit raises the current account deficit only if the
increase in the budget deficit reduces desired national saving
2. In a small open economy, if an increase in the government budget deficit reduces desired
national saving, the saving curve shifts left, thus reducing the current account balance
1. A deficit caused by increased government purchases
a. No question here: The deficit definitely reduces national saving
2. A deficit resulting from a tax cut
a. Sd falls only if Cd rises

1. Relationship between the U.S. government budget deficit and U.S. current account deficit
2. Text Figure 5.12 shows data
3. The deficits appear to be twins in the 1980s and early 1990s, moving closely together
4. But at other times (during World Wars I and II, and during 1975) government budget deficits
grew, yet the current account balance increased
5. The evidence is also mixed for foreign countries
Analytical problem 4 looks at the relationship between government budget deficits and the
2. Net income from abroad
a. Income received from abroad is a credit item, since it causes funds to flow into the
3. Net unilateral transfers
a. Payments made from one country to another
4. Sum of net exports of goods and services, net income from abroad, and net unilateral
transfers is the current account balance
a. Positive current account balance implies current account surplus
b. Negative current account balance implies current account deficit
Students may be helped if you draw the basic balance of payments chart without numbers, but
in 1991.
C. The capital and financial account
1. The capital and financial account records trades in existing assets, either real (for example,
houses) or financial (for example, stocks and bonds)
2. The capital account records the net flow of unilateral transfers of assets into the country
3. Most transactions appear in the financial account part of the capital and financial account
a. When home country sells assets to foreign country, that is a capital inflow for the home
4. The official settlements balance
a. Transactions in official reserve assets are conducted by central banks of countries
b. Official reserve assets are assets (foreign government securities, bank deposits, and
SDRs of the IMF, gold) used in making international payments
c. Central banks buy (or sell) official reserve assets with (or to obtain) their own currencies
1. Current account balance (CA) capital and financial account balance (KFA) 0 (5.1)
2. CA KFA 0 by accounting; every transaction involves offsetting effects
3. Examples given of offsetting transactions (text Table 5.2)
Analytical Problem 2 gives students practice with offsetting transactions in the balance of
4. In practice, measurement problems, recorded as a statistical discrepancy, prevent
CA KFA 0 from holding exactly
1. Net foreign assets are a country’s foreign assets minus its foreign liabilities
a. Net foreign assets may change in value (example: change in stock prices)
2. The net increase in foreign assets equals a country’s current account surplus
3. A current account surplus implies a capital and financial account deficit, and thus a net
increase in holdings of foreign assets (a financial outflow)
4. A current account deficit implies a capital and financial account surplus, and thus a net
decline in holdings of foreign assets (a financial inflow)
5. Foreign direct investment: a foreign firm buys or builds capital goods
a. Causes an increase in capital and financial account balance
6. Summary: Equivalent measures of a country’s international trade and lending
Current account surplus capital and financial account deficit net acquisition of foreign
1. The rise in foreign liabilities by the United States since the early 1980s has been very large
(text Figure 5.1)
2. The United States has become the world’s largest international debtor
3. But the net foreign debt of the United States relative to U.S. GDP is relatively small (27%)
compared with other countries (some of whom have net foreign debt of over 100% of GDP)
4. Despite the large net foreign debt, the United States has direct foreign investment
(companies, land) in other countries about equal in size to other countries’ foreign direct
5. Table 5.3 shows size of foreign countries’ holdings of U.S. debt
6. What really matters is not size of net foreign debt, but country’s wealth (physical and
human capital)
1. So national saving has two uses:
a. Increase the capital stock by domestic investment
2. To get goods market equilibrium, national saving and investment must equal their desired
levels:
3. Alternative method:
a. Y Cd Id G NX (5.5)
1. World real interest rate (rw): the real interest rate in the international capital market
2. Key assumption: Residents of the small open economy can borrow or lend at the expected
world real interest rate (Figure 5.1; Key diagram 4; like text Figures 5.2 and 5.3)
3. Result: rw may be such that Sd > Id, Sd Id, or Sd < Id
a. If rw r1, then Sd > Id, so the excess of desired saving over desired investment is lent
4. Alternative interpretation: in terms of output and absorption
5. Net exports equals net foreign lending equals the current account balance (assuming net
factor payments and net unilateral transfers are zero)
1. Anything that increases desired national saving (Y rises, future output falls, or G falls)
relative to desired investment (MPKf falls, rises) at a given world interest rate increases
2. A temporary adverse supply shock
Temporary drop in income leads to a drop in saving, so net foreign lending declines; shown
3. An increase in the expected future marginal product of capital
Desired investment rises, so net foreign lending falls; shown in text Figure 5.5
Data Application
Does the international capital market work well? Maurice Obstfeld, in his article, “Capital Mobility
in the World Economy: Theory and Measurement,” in K. Brunner and A. Meltzer, eds., Carnegie-
1. Suppose there are just two economies in the world
a. The home or domestic economy (saving S, investment I)
2. The world real interest rate moves to equilibrate desired international lending by one
country with desired international borrowing by the other (Figure 5.2; Key diagram 5; text
3. Equivalent statement: The equilibrium world real interest rate is determined such that a
current account surplus in one country is equal in magnitude to the current account deficit
4. Changes in the equilibrium world real interest rate: Any factor that increases desired
international lending of a country relative to desired international borrowing causes the
1. World’s economies are increasingly interdependent—more international trade
and investment
2. Historical data on trends in trade from 1929 to 2011
a. Text Figure 5.7
3. Costs of globalization: U.S. jobs lost in particular sectors
4. Benefits of globalization: U.S. jobs gained in particular sectors
a. U.S. exports increase
5. But loss for jobs from foreign trade is a small fraction of total job loss in U.S.
6. Recent years: big changes in business services industry—call centers, etc.
a. Critics: moving jobs abroad
1. U.S. current account deficit is large (text Fig. 5.8)
2. Why did U.S. current account deficit increase from 1991 to 2005?
a. Lower foreign demand
3. Lower foreign demand
a. Slower economic growth in Japan and Europe in early 2000s
4. Better international investment opportunities (text Fig. 5.9)
a. U.S. investors diversifying investments internationally
5. Higher oil prices
a. U.S. imports much more oil than it exports
6. Increased saving by developing countries
a. Many developing nations want to invest in safe places like U.S., rather than borrowing
7. Some people also blame U.S. government deficit—twin deficits argument
a. But in late 1990s, U.S. government ran surpluses, and current account deficit got larger
b. Other countries with current account surpluses also run larger government budget
deficits than U.S.
1. An increase in the government budget deficit raises the current account deficit only if the
increase in the budget deficit reduces desired national saving
2. In a small open economy, if an increase in the government budget deficit reduces desired
national saving, the saving curve shifts left, thus reducing the current account balance
1. A deficit caused by increased government purchases
a. No question here: The deficit definitely reduces national saving
2. A deficit resulting from a tax cut
a. Sd falls only if Cd rises
1. Relationship between the U.S. government budget deficit and U.S. current account deficit
2. Text Figure 5.12 shows data
3. The deficits appear to be twins in the 1980s and early 1990s, moving closely together
4. But at other times (during World Wars I and II, and during 1975) government budget deficits
grew, yet the current account balance increased
5. The evidence is also mixed for foreign countries
Analytical problem 4 looks at the relationship between government budget deficits and the


