5. Should Social Security Funds Be Invested in the Stock Market?
The Social Security trust fund is projected to decline to zero around the year 2030, thanks to demographic
changes, especially the aging of the population and lower birth rates. A number of solutions are possible,
including reducing Social Security benefits or increasing taxes. Another possibility is to allow the trust
fund to invest in the stock market, so the returns to the fund would be higher than they are now. Currently,
6. How Are You Trading Off the Present for the Future?
The material in the appendix may seem theoretical and abstract, but it’s easy to show students that they’re
really acting in the way the chapter describes. Ask them what tradeoffs they’re making between the present
and the future. The most obvious tradeoff is the fact that they’re in college, acquiring human capital, rather
7. What Borrowing Constraints Do You Face?
Some of your students may have already faced severe borrowing constraints in their lives. Some may note
that they could not obtain credit very easily. Fortunately, many will have been able to borrow enough
money to go to college, thanks to government programs that allow equal opportunity in education. But in
1.Saving is current income minus consumption. For given income, any increase in consumption means
an equal decrease in saving, so consumption and saving are inversely related. The basic motivation
2. When a consumer gets an increase in current income, both current consumption and future
consumption increase. Since current consumption rises, but by less than the increase in current income,
saving increases. When the consumer gets an increase in expected future income, again
both current and future consumption increase. Since current income does not increase, but current
3.The effect on desired saving of an increase in the expected real interest rate is potentially ambiguous.
An increase in the real interest rate has two effects on desired saving: (1) the substitution effect increases
saving, because the amount of future consumption that can be obtained in exchange for giving up a unit
of current consumption rises; and (2) the income effect may increase or reduce saving. The income effect
4.The expected after-tax real interest rate is the after-tax nominal interest rate, (1 t)i, minus the
expected rate of inflation, e, and represents the real return earned by a saver when a portion, t, of
1 t becomes larger, so the expected after-tax real interest rate increases.
5.When government purchases increase temporarily, consumers see that higher taxes will be required in
the future to pay off the deficit. They reduce both current consumption and future consumption, but
current consumption declines by less than the amount of the government purchases. Since national
saving is output minus desired consumption minus government purchases, and government
purchases have increased more than current desired consumption has decreased, national saving
6. The two components of the user cost of capital are the interest cost and the depreciation cost.
The depreciation cost is the value lost as the capital wears out during the period. The interest cost
7. The desired capital stock is the amount of capital that allows the firm to earn the largest possible
profit. The higher the expected future marginal product of capital, the higher the desired capital
8. Gross investment represents the total purchase or construction of new capital goods that takes place
during a period. Net investment is gross investment minus the depreciation on existing capital. Thus
9. Equilibrium in the goods market occurs when the aggregate supply of goods (Y) equals the aggregate
demand for goods (Cd Id G). Since desired national saving (Sd) is Y Cd G, an equivalent
10. The saving curve slopes upward because saving is assumed to increase with an increase in the
expected real interest rate. The investment curve slopes downward because investment is lower the
1. First, a general formulation of the problem is useful. With income of Y1 in the first year and Y2 in the
second year, the consumer saves Y1 C in the first year and Y2 C in the second year, where C is the
consumption amount, which is the same in both years. Saving in the first year earns interest at rate r,
where r is the real interest rate. And the consumer needs to accumulate just enough after two years to
pay for college tuition, in the amount T. So the key equation is (Y1 C)(1 r) (Y2 C) T.
2. (a) This chart shows the MPKf as the increase in output from adding another fabricator:
# Fabricators Output MPKf
0 0 —
1 100 100
2 150 50
3 180 30
4 195 15
5 205 10
6 210 5
(b) uc (r d)pK (0.12 0.20)$100 $32. HHHHC should buy two fabricators, since at two
fabricators, MPKf 50 32 uc. But at three fabricators, MPKf 30 32 uc. You want to
add fabricators only if the future marginal product of capital exceeds the user cost of capital. The
1 0.6. They should buy just one fabricator, since (1 )MPKf 0.6 100 60 32 uc.
They shouldn’t buy two, since then (1 τ)MPKf 0.6 50 30 32 uc.
3. (a) The expected after-tax real interest rate is r i(1 t) e
0.10 (1 0.30) 0.05
4. Since the price of capital declines from 60 to 51, the depreciation rate is 9/60 .15.
(a) uc (r d)pK (.10 .15)60 15 units of output per year.
(b) The desired capital stock is such that MPKf uc, so 165 2K 15, or 2K 150, so K 75.
(c) The tax-adjusted user cost of capital is uc/(1 ), so with .4, the condition for the desired
5. (a) Desired consumption declines as the real interest rate rises because the higher return to saving
encourages higher saving; desired investment declines as the real interest rate rises because the
2 6100 1500 900 9600

3 6000 1400 1000 9400
4 5900 1300 1100 9200
5 5800 1200 1200 9000
6 5700 1100 1300 8800
(c) Equation (4.7) says that Y Cd Id G at equilibrium. Looking at the last column of the table,
with Y 9000, this is true only at r 5%. At this point, Sd Id 1200. Equation (4.8) says that
Sd Id at equilibrium. From the table, this occurs at r 5%.
2 6100 1500 1300 9200
3 6000 1400 1400 9000
4 5900 1300 1500 8800
5 5800 1200 1600 8600
6 5700 1100 1700 8400
6. (a) Sd Y Cd G
Y (3600 2000r 0.1Y) 1200
So 0.9Y 6000 6000r
At full employment, Y 6000. Solving 0.9 6000 6000 6000r, we get r 0.10.
0.9Y 6000 6000r
When Y 6000, r 0.10.
So we can use either Eq. (4.7) or (4.8) to get to the same result.
(c) When G 1440, desired saving becomes Sd Y Cd G Y (3600 2000r 0.1Y) 1440
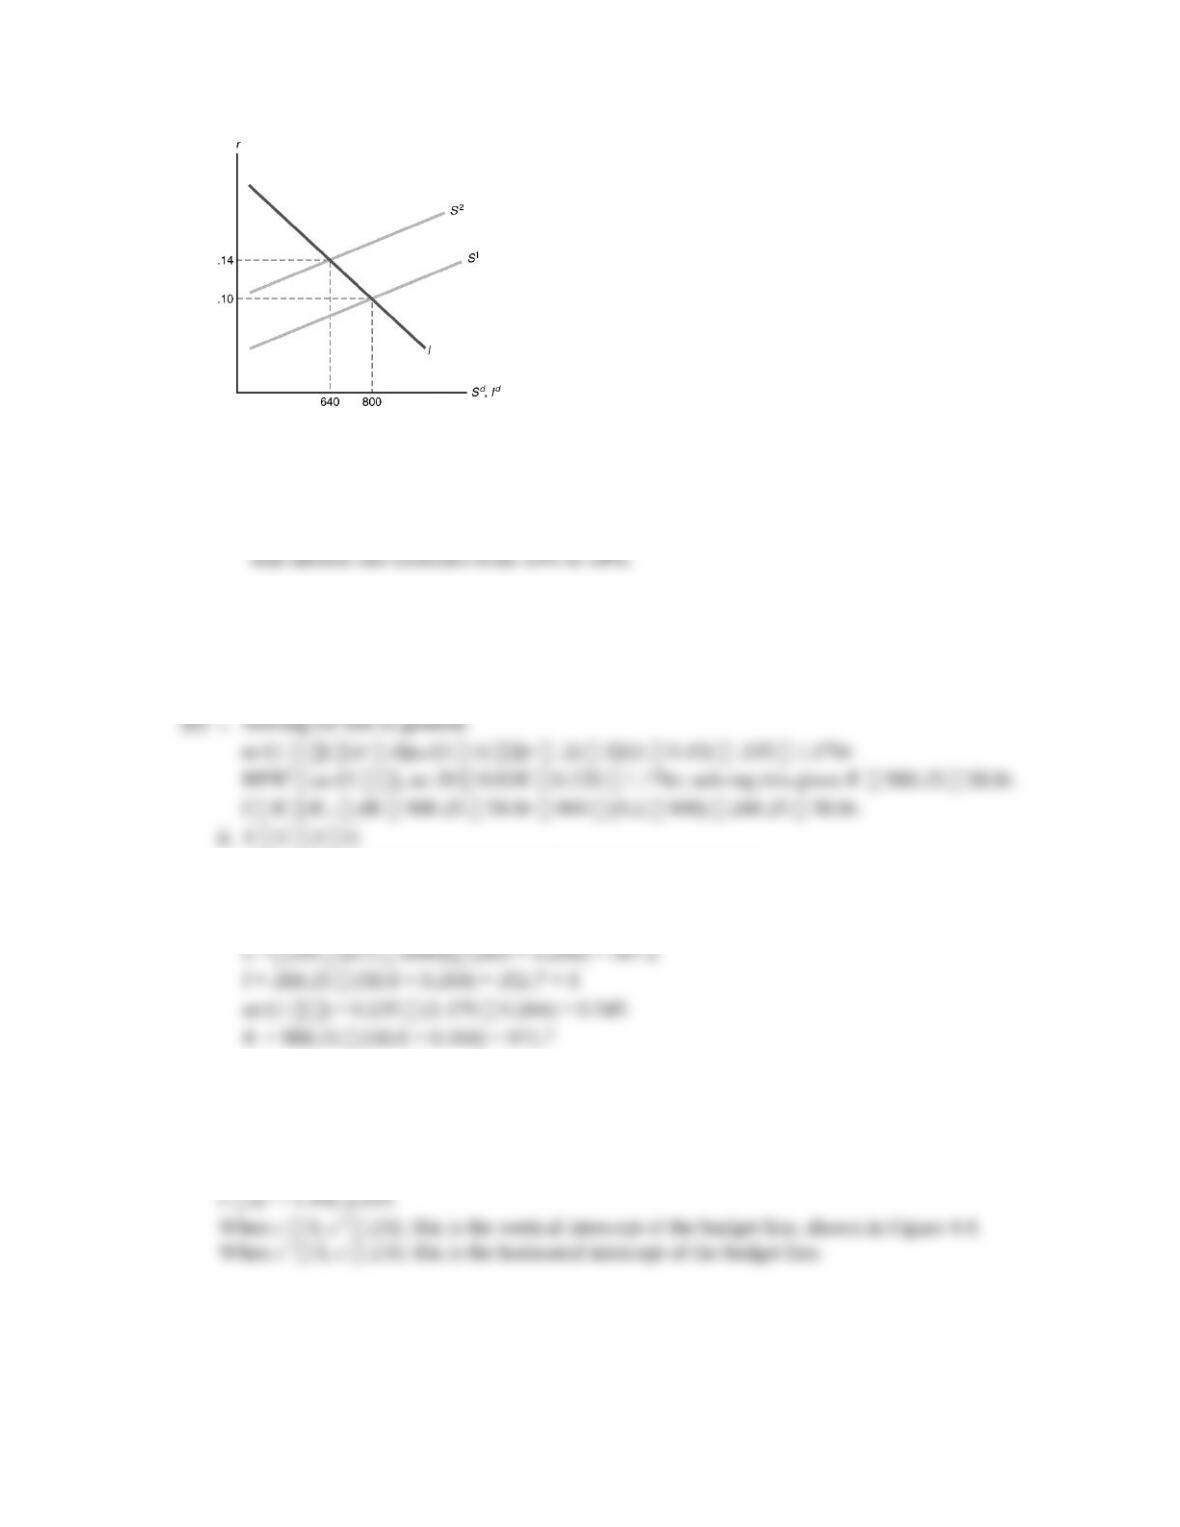
6000r 0.9Y 6240
At Y 6000, this is 6000r 6240 (0.9 6000) 840, so r 0.14. The market-clearing
7. (a) r 0.10
uc/(1 τ) (r d)pK/(1 ) [(.1 0.2) 1]/(1 0.15) 0.35.
MPKf uc/(1 ), so 20 0.02K 0.35; solving this gives K 982.5.
Since K K-1 I dK, I K K–1 dK 982.5 900 (.2 900) 262.5.
1000 [100 (.5 1000) 200r] (268.25 58.8r) 200
1000 1068.25 258.8r, so 258.8r 68.25
r 0.264
8. (a) PVLR y [yf/(1 r)] a
90 (110/1.10) 20
210.
(b) c [cf / (1 r)] PVLR.
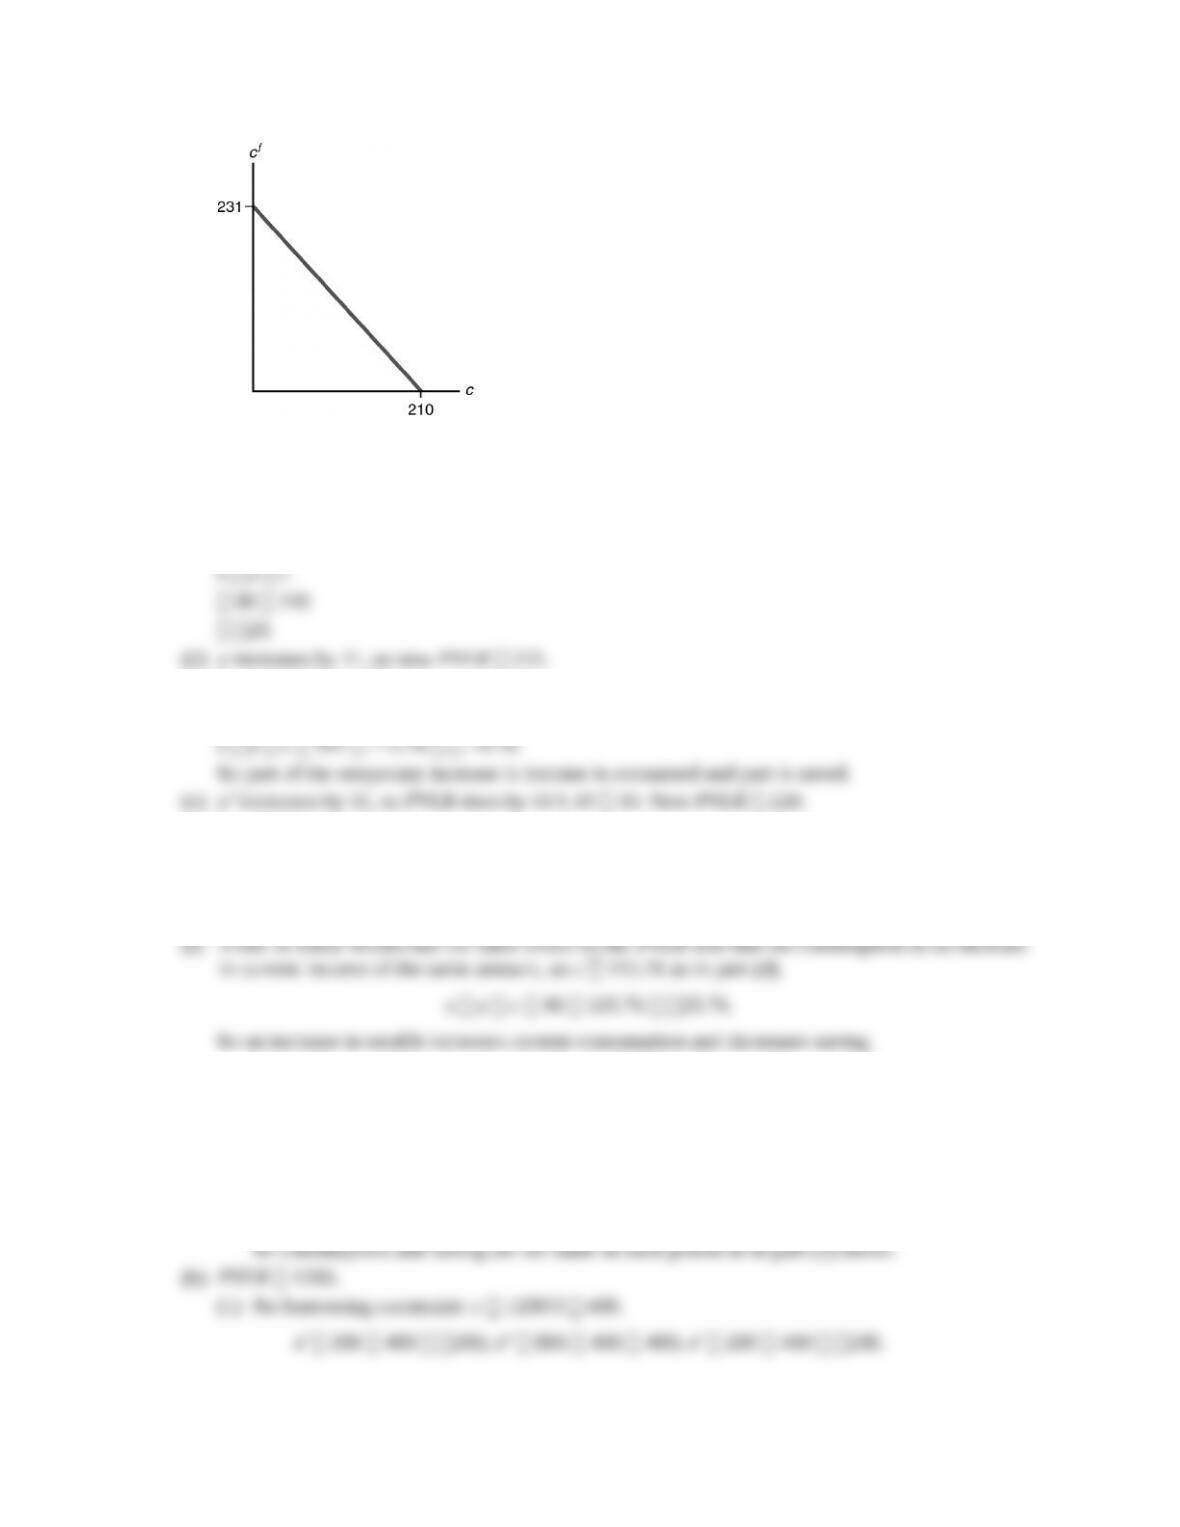
1.10c c 210 1.10.
2.1c 231.
c 110.
2.1c 221 1.1 243.1.
c 115.76.
2.1c 220 1.1 242.
c 115.24.
s y c 90 115.24 25.24.
So a rise in future income leads to an increase in current consumption but a decrease in saving.
9. (a) PVLR a yl yw yr 1500.
(1) No borrowing constraint: cl cw cr 1500.
cl cw cr c 1500/3 500.
sl 200 500 300; sw 800 500 300; sr 200 500 300.
(2) A borrowing constraint is nonbinding, since a yl 500 cl, and cw 500 800 yw.
1. (a) As Figure 4.5 shows, the shift to the right in the saving curve from S1 to S2 causes saving and
investment to increase and the real interest rate to decrease.
Figure 4.5
(b) This is really just a transfer from the general population to veterans. The effect on saving
depends on whether the marginal propensity to consume (MPC) of veterans differs from that
2. (a) With a lower capital stock, the marginal product of labor is reduced, so the labor demand curve
shifts to the left from ND1 to ND2 in Figure 4.8. Then the new equilibrium point is one with
lower employment and a lower real wage. With lower employment and a lower capital stock,
full-employment output will be lower.
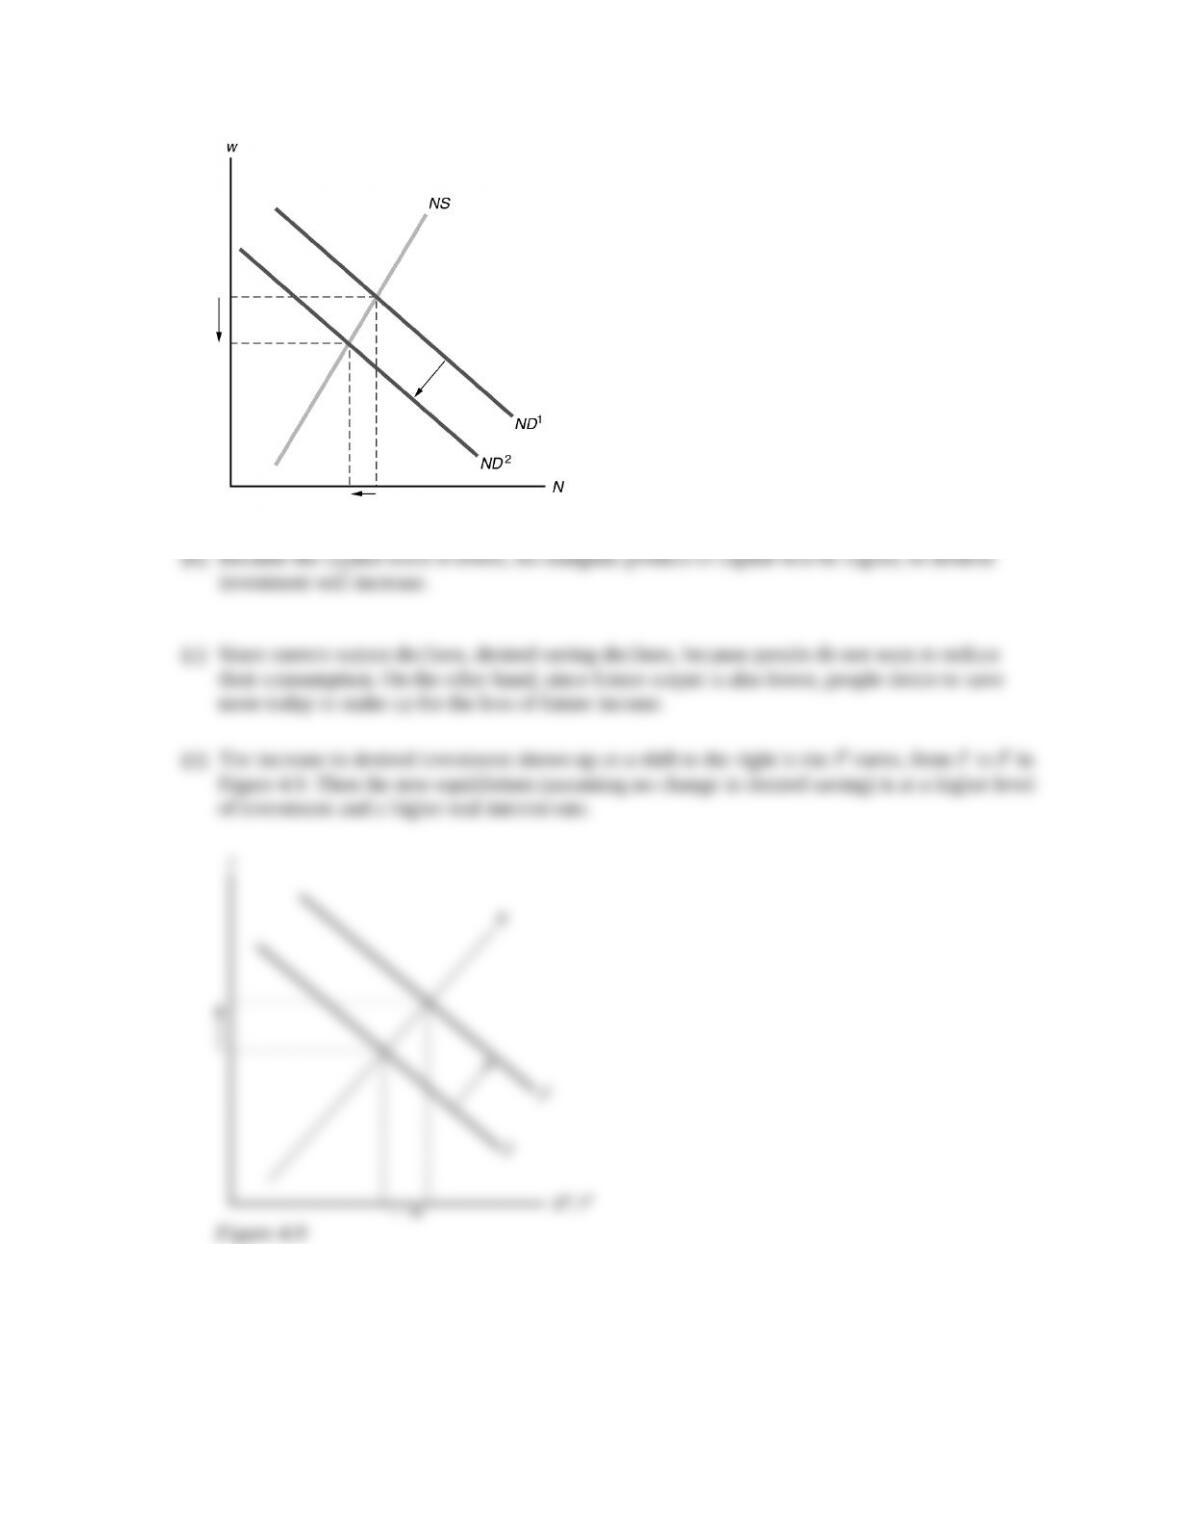
Figure 4.8
The Social Security trust fund is projected to decline to zero around the year 2030, thanks to demographic
changes, especially the aging of the population and lower birth rates. A number of solutions are possible,
including reducing Social Security benefits or increasing taxes. Another possibility is to allow the trust
fund to invest in the stock market, so the returns to the fund would be higher than they are now. Currently,
6. How Are You Trading Off the Present for the Future?
The material in the appendix may seem theoretical and abstract, but it’s easy to show students that they’re
really acting in the way the chapter describes. Ask them what tradeoffs they’re making between the present
and the future. The most obvious tradeoff is the fact that they’re in college, acquiring human capital, rather
7. What Borrowing Constraints Do You Face?
Some of your students may have already faced severe borrowing constraints in their lives. Some may note
that they could not obtain credit very easily. Fortunately, many will have been able to borrow enough
money to go to college, thanks to government programs that allow equal opportunity in education. But in
1.Saving is current income minus consumption. For given income, any increase in consumption means
an equal decrease in saving, so consumption and saving are inversely related. The basic motivation
2. When a consumer gets an increase in current income, both current consumption and future
consumption increase. Since current consumption rises, but by less than the increase in current income,
saving increases. When the consumer gets an increase in expected future income, again
both current and future consumption increase. Since current income does not increase, but current
3.The effect on desired saving of an increase in the expected real interest rate is potentially ambiguous.
An increase in the real interest rate has two effects on desired saving: (1) the substitution effect increases
saving, because the amount of future consumption that can be obtained in exchange for giving up a unit
of current consumption rises; and (2) the income effect may increase or reduce saving. The income effect
4.The expected after-tax real interest rate is the after-tax nominal interest rate, (1 t)i, minus the
expected rate of inflation, e, and represents the real return earned by a saver when a portion, t, of
1 t becomes larger, so the expected after-tax real interest rate increases.
5.When government purchases increase temporarily, consumers see that higher taxes will be required in
the future to pay off the deficit. They reduce both current consumption and future consumption, but
current consumption declines by less than the amount of the government purchases. Since national
saving is output minus desired consumption minus government purchases, and government
purchases have increased more than current desired consumption has decreased, national saving
6. The two components of the user cost of capital are the interest cost and the depreciation cost.
The depreciation cost is the value lost as the capital wears out during the period. The interest cost
7. The desired capital stock is the amount of capital that allows the firm to earn the largest possible
profit. The higher the expected future marginal product of capital, the higher the desired capital
8. Gross investment represents the total purchase or construction of new capital goods that takes place
during a period. Net investment is gross investment minus the depreciation on existing capital. Thus
9. Equilibrium in the goods market occurs when the aggregate supply of goods (Y) equals the aggregate
demand for goods (Cd Id G). Since desired national saving (Sd) is Y Cd G, an equivalent
10. The saving curve slopes upward because saving is assumed to increase with an increase in the
expected real interest rate. The investment curve slopes downward because investment is lower the
1. First, a general formulation of the problem is useful. With income of Y1 in the first year and Y2 in the
second year, the consumer saves Y1 C in the first year and Y2 C in the second year, where C is the
consumption amount, which is the same in both years. Saving in the first year earns interest at rate r,
where r is the real interest rate. And the consumer needs to accumulate just enough after two years to
pay for college tuition, in the amount T. So the key equation is (Y1 C)(1 r) (Y2 C) T.
2. (a) This chart shows the MPKf as the increase in output from adding another fabricator:
# Fabricators Output MPKf
0 0 —
1 100 100
2 150 50
3 180 30
4 195 15
5 205 10
6 210 5
(b) uc (r d)pK (0.12 0.20)$100 $32. HHHHC should buy two fabricators, since at two
fabricators, MPKf 50 32 uc. But at three fabricators, MPKf 30 32 uc. You want to
add fabricators only if the future marginal product of capital exceeds the user cost of capital. The
1 0.6. They should buy just one fabricator, since (1 )MPKf 0.6 100 60 32 uc.
They shouldn’t buy two, since then (1 τ)MPKf 0.6 50 30 32 uc.
3. (a) The expected after-tax real interest rate is r i(1 t) e
0.10 (1 0.30) 0.05
4. Since the price of capital declines from 60 to 51, the depreciation rate is 9/60 .15.
(a) uc (r d)pK (.10 .15)60 15 units of output per year.
(b) The desired capital stock is such that MPKf uc, so 165 2K 15, or 2K 150, so K 75.
(c) The tax-adjusted user cost of capital is uc/(1 ), so with .4, the condition for the desired
5. (a) Desired consumption declines as the real interest rate rises because the higher return to saving
encourages higher saving; desired investment declines as the real interest rate rises because the
2 6100 1500 900 9600
3 6000 1400 1000 9400
4 5900 1300 1100 9200
5 5800 1200 1200 9000
6 5700 1100 1300 8800
(c) Equation (4.7) says that Y Cd Id G at equilibrium. Looking at the last column of the table,
with Y 9000, this is true only at r 5%. At this point, Sd Id 1200. Equation (4.8) says that
Sd Id at equilibrium. From the table, this occurs at r 5%.
2 6100 1500 1300 9200
3 6000 1400 1400 9000
4 5900 1300 1500 8800
5 5800 1200 1600 8600
6 5700 1100 1700 8400
6. (a) Sd Y Cd G
Y (3600 2000r 0.1Y) 1200
So 0.9Y 6000 6000r
At full employment, Y 6000. Solving 0.9 6000 6000 6000r, we get r 0.10.
0.9Y 6000 6000r
When Y 6000, r 0.10.
So we can use either Eq. (4.7) or (4.8) to get to the same result.
(c) When G 1440, desired saving becomes Sd Y Cd G Y (3600 2000r 0.1Y) 1440
6000r 0.9Y 6240
At Y 6000, this is 6000r 6240 (0.9 6000) 840, so r 0.14. The market-clearing
7. (a) r 0.10
uc/(1 τ) (r d)pK/(1 ) [(.1 0.2) 1]/(1 0.15) 0.35.
MPKf uc/(1 ), so 20 0.02K 0.35; solving this gives K 982.5.
Since K K-1 I dK, I K K–1 dK 982.5 900 (.2 900) 262.5.
1000 [100 (.5 1000) 200r] (268.25 58.8r) 200
1000 1068.25 258.8r, so 258.8r 68.25
r 0.264
8. (a) PVLR y [yf/(1 r)] a
90 (110/1.10) 20
210.
(b) c [cf / (1 r)] PVLR.
1.10c c 210 1.10.
2.1c 231.
c 110.
2.1c 221 1.1 243.1.
c 115.76.
2.1c 220 1.1 242.
c 115.24.
s y c 90 115.24 25.24.
So a rise in future income leads to an increase in current consumption but a decrease in saving.
9. (a) PVLR a yl yw yr 1500.
(1) No borrowing constraint: cl cw cr 1500.
cl cw cr c 1500/3 500.
sl 200 500 300; sw 800 500 300; sr 200 500 300.
(2) A borrowing constraint is nonbinding, since a yl 500 cl, and cw 500 800 yw.
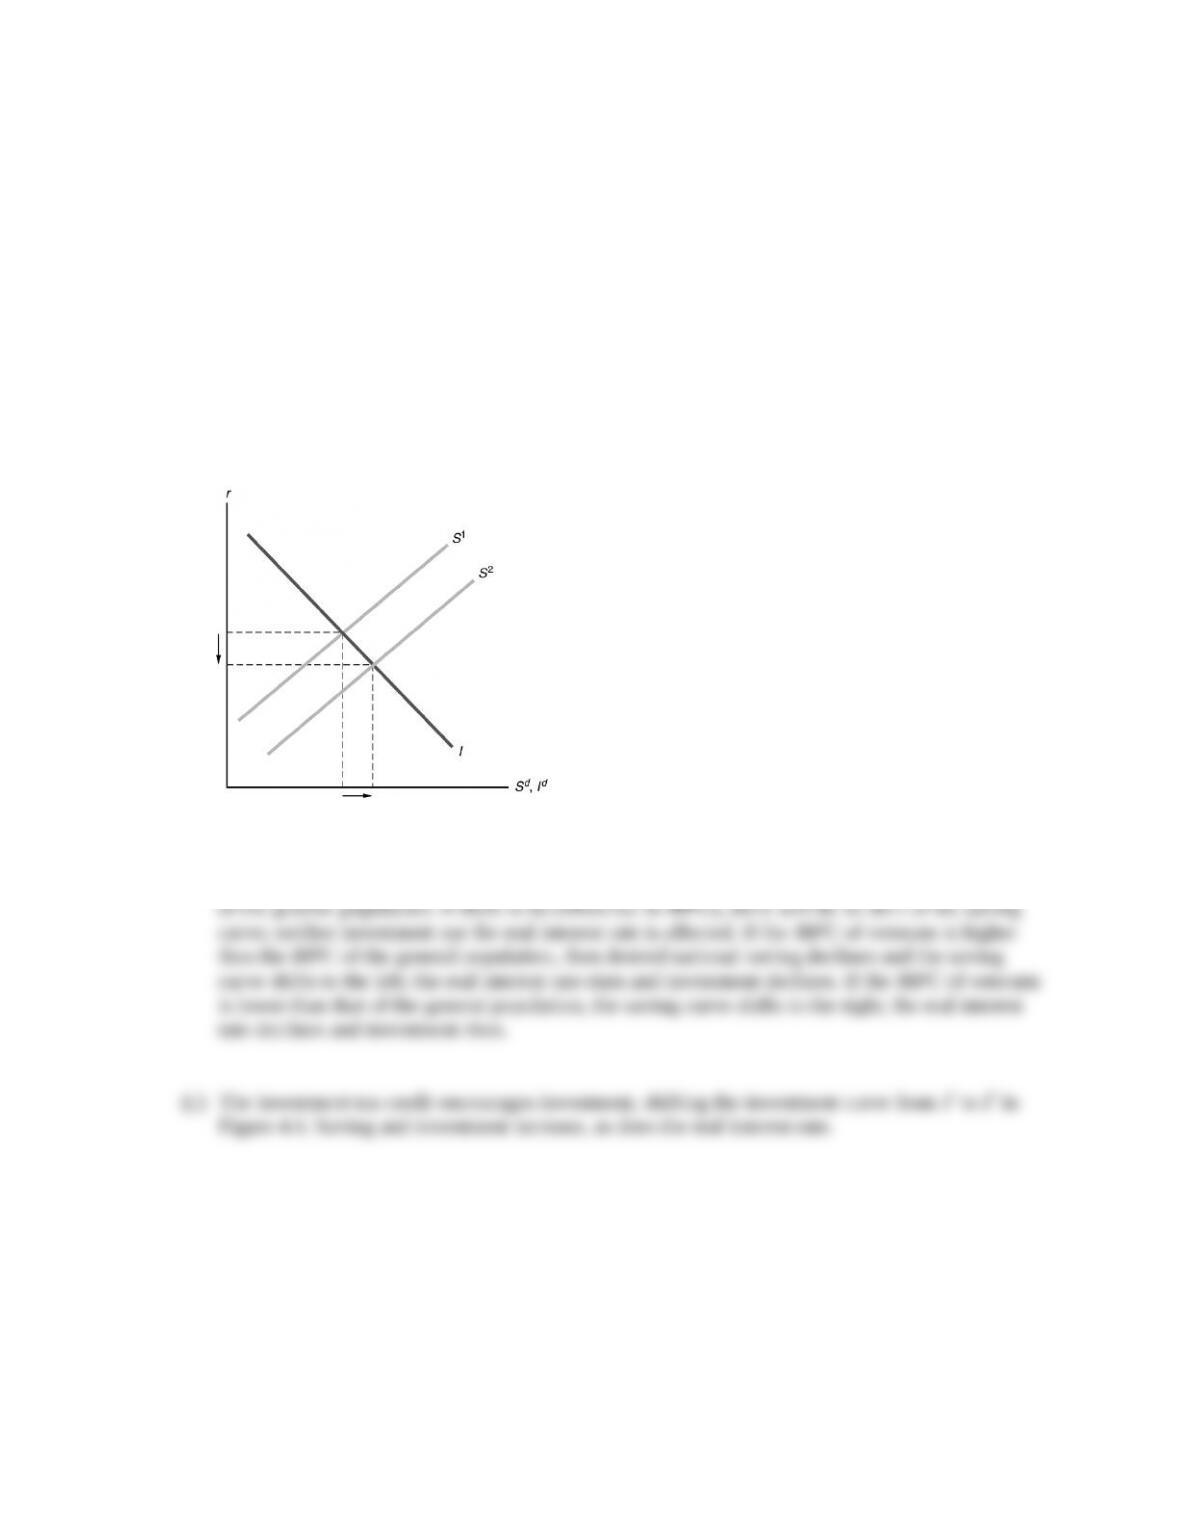
1. (a) As Figure 4.5 shows, the shift to the right in the saving curve from S1 to S2 causes saving and
investment to increase and the real interest rate to decrease.
Figure 4.5
(b) This is really just a transfer from the general population to veterans. The effect on saving
depends on whether the marginal propensity to consume (MPC) of veterans differs from that
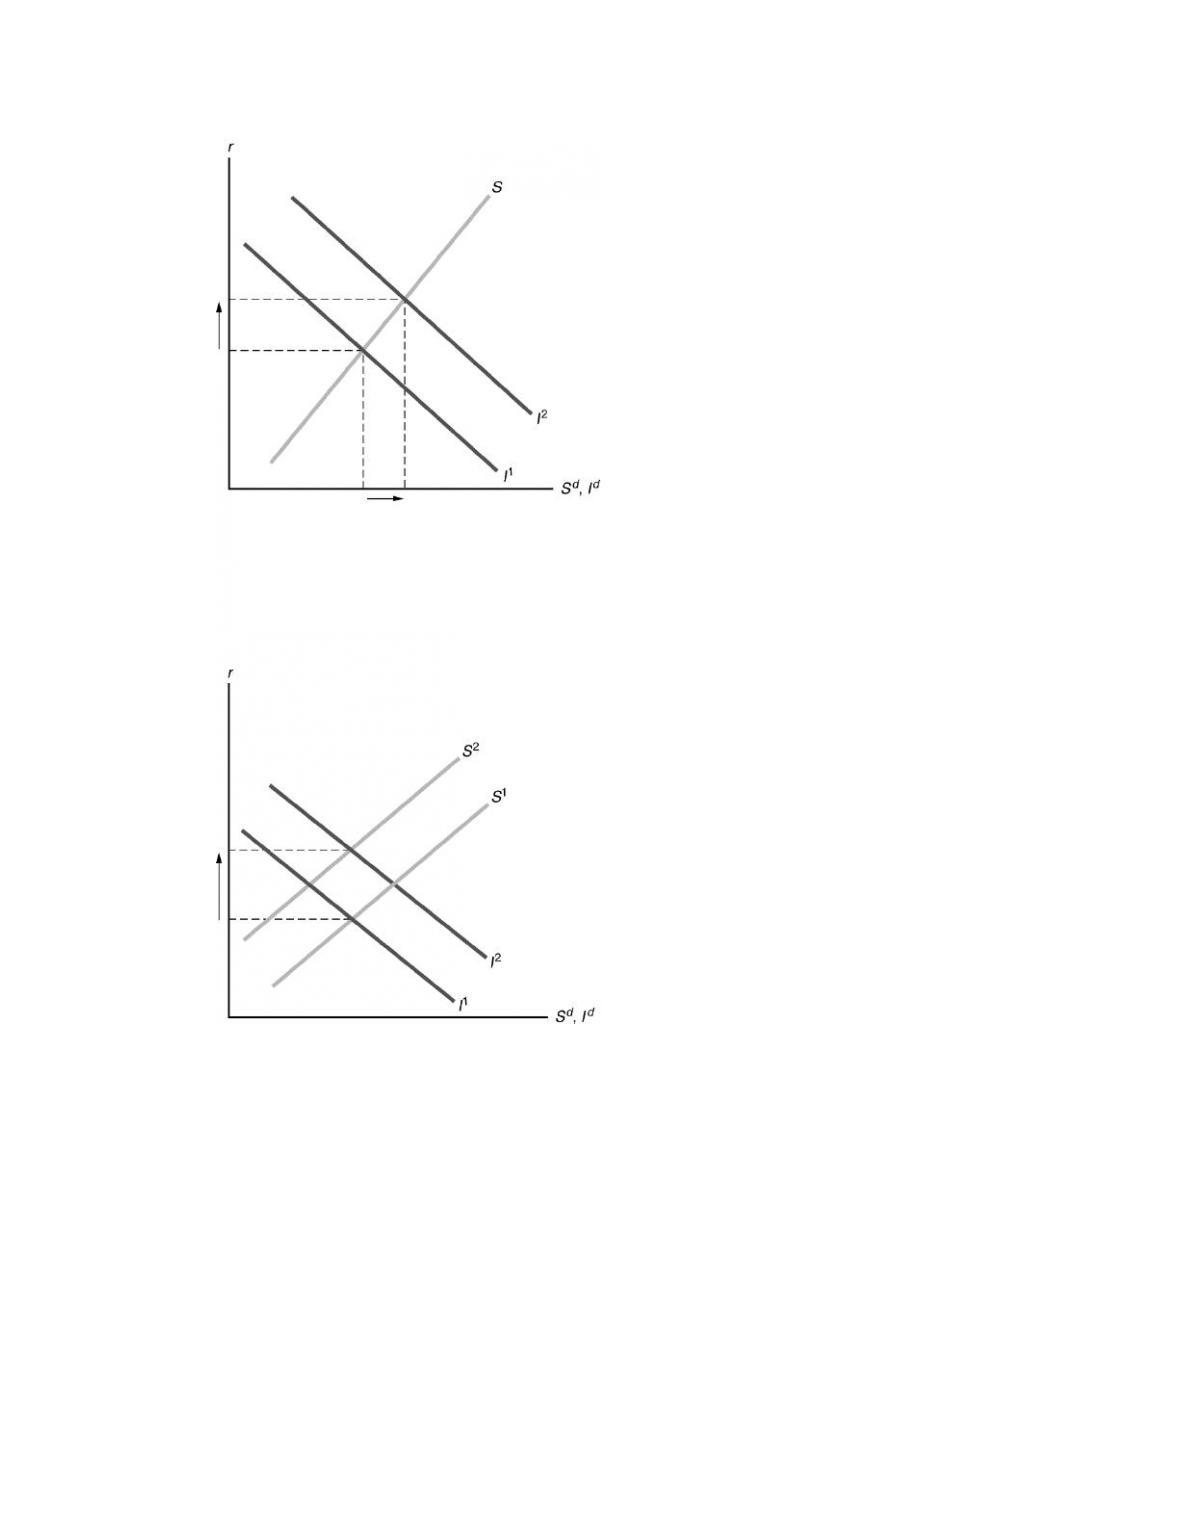
2. (a) With a lower capital stock, the marginal product of labor is reduced, so the labor demand curve
shifts to the left from ND1 to ND2 in Figure 4.8. Then the new equilibrium point is one with
lower employment and a lower real wage. With lower employment and a lower capital stock,
full-employment output will be lower.
Figure 4.8