Policy Application
Should tax policy be used to promote savings or investment? Many policymakers and
economists have argued that obtaining the correct amount of future economic growth requires
us to have a higher capital stock, so that we need more investment than we have. They suggest
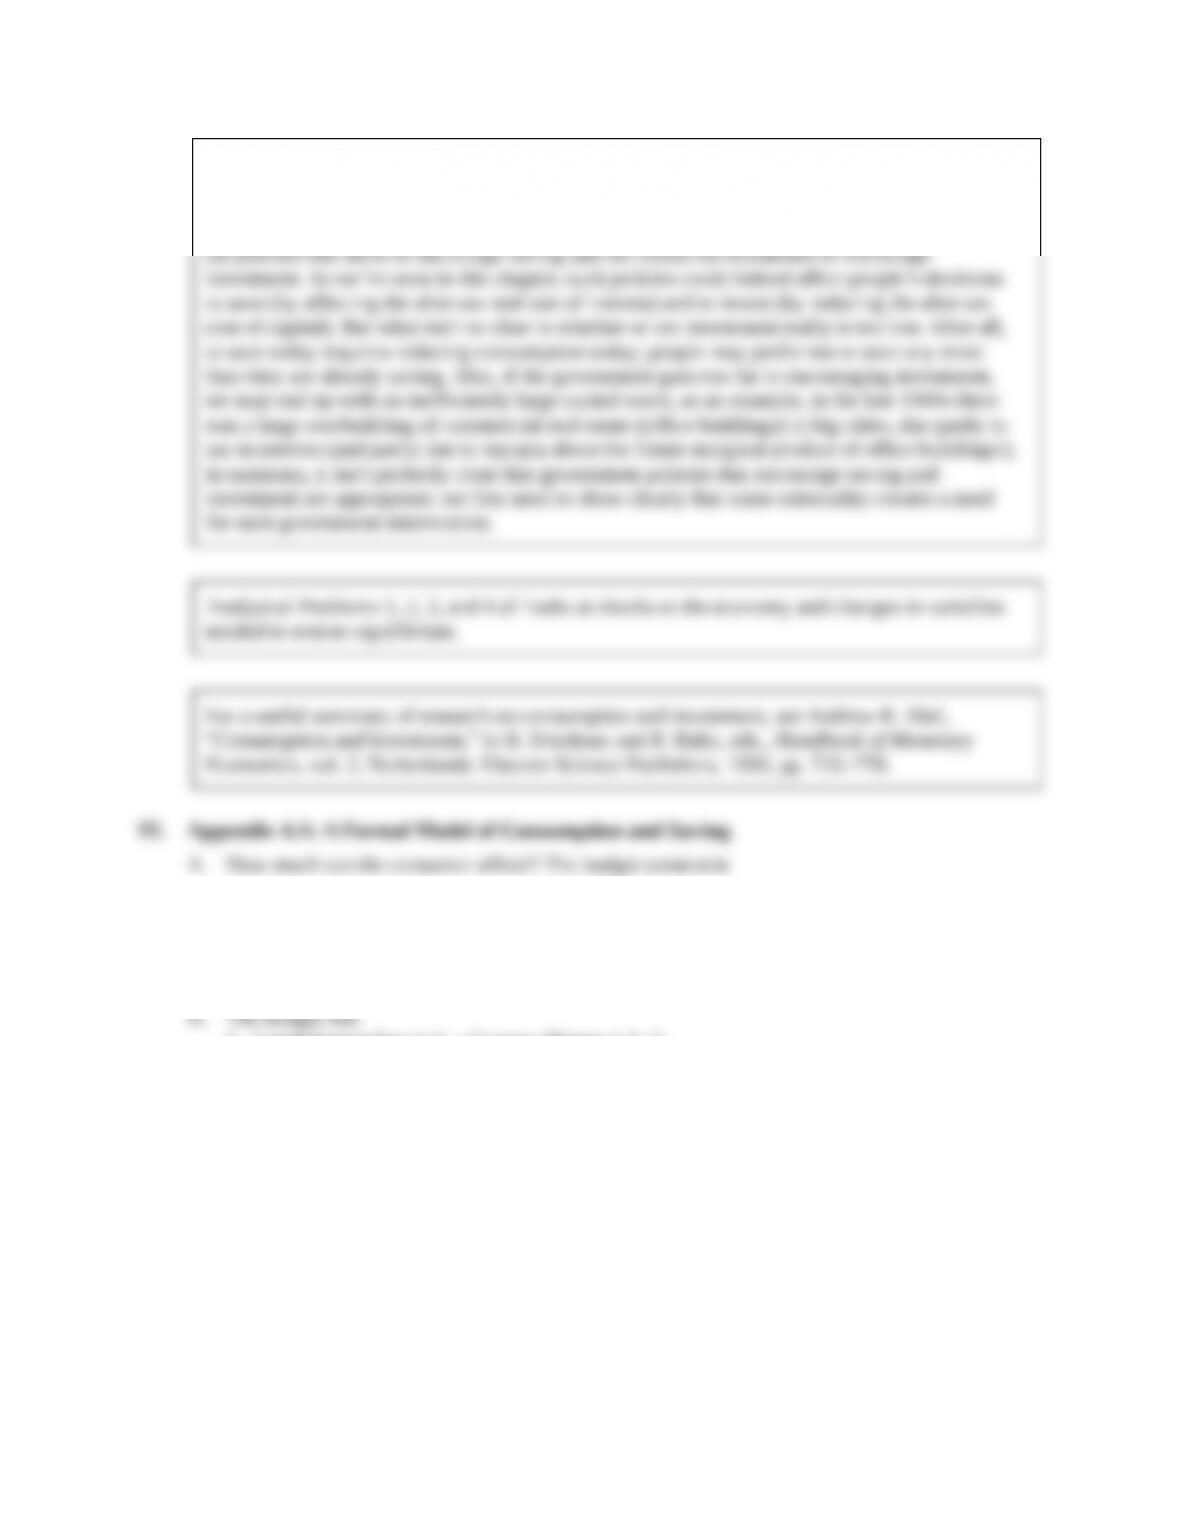
the budget constraint
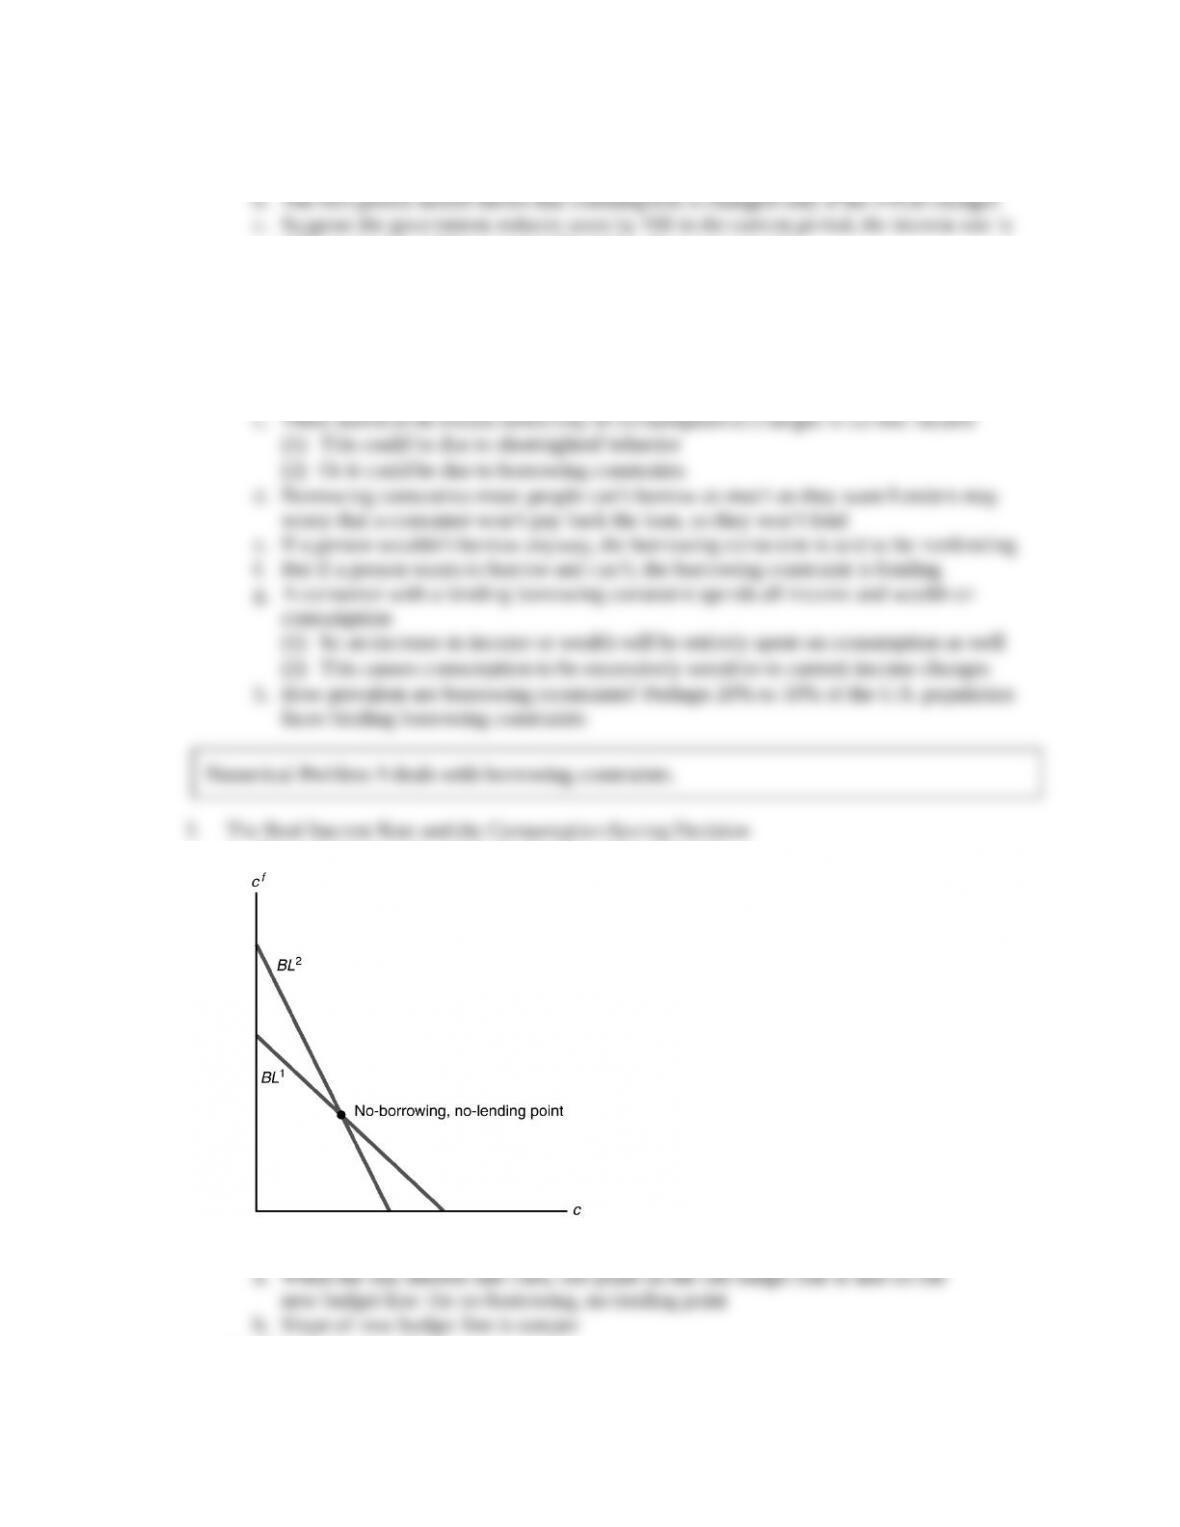
1. Graph budget line in (c, cf) space (Figure 4.A.1)
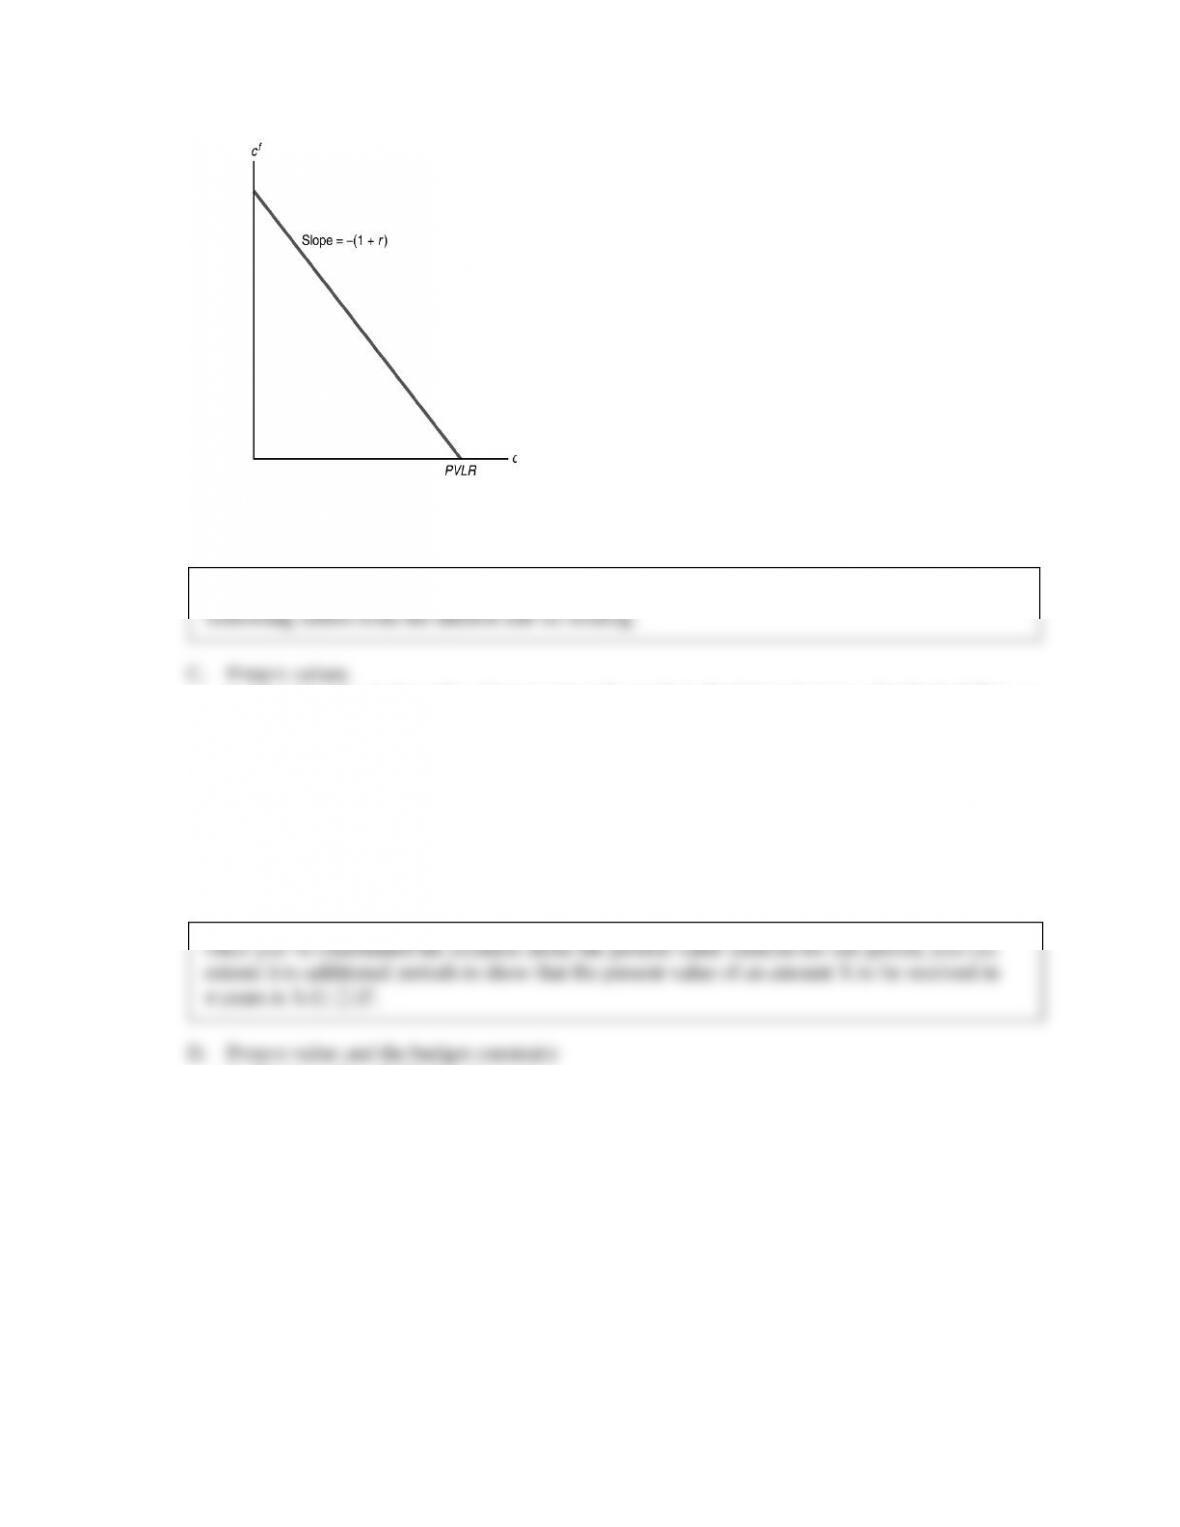
Figure 4.A.1
2. Slope of line (1 r)
Analytical Problem 7 looks at what happens to the budget line when the interest rate on
1. Present value is the value of payments to be made in the future in terms of today’s dollars or
goods
2. Example: At an interest rate of 10%, $12,000 today invested for one year is worth $13,200
($12,000 1.10); so the present value of $13,200 in one year is $12,000
3. General formula: Present value future value/(1 i), where amounts are in dollar terms and
i is the nominal interest rate
4. Alternatively, if amounts are in real terms, use the real interest rate r instead of the nominal
interest rate i
1. Present value of lifetime resources:
PVLR y yf/(1 r) a(4.A.2)
2. Present value of lifetime consumption:
PVLC c cf/(1 r)
3. The budget constraint means PVLC PVLR
4. c cf/(1 r) y yf/(1 r) a (4.A.3)
5. Horizontal intercept of budget line is c PVLR, cf 0
E. What does the consumer want? Consumer preferences
1. Utility a person’s satisfaction or well-being
2. Graph a person’s preference for current versus future consumption using indifference curves
3. An indifference curve shows combinations of c and cf that give the same utility (Figure 4.A.2)
Figure 4.A.2
4. A person is equally happy at any point on an indifference curve
5. Three important properties of indifference curves
a. Slope downward from left to right: Less consumption in one period requires more
consumption in the other period to keep utility unchanged
b. Indifference curves that are farther up and to the right represent higher levels of utility,
because more consumption is preferred to less
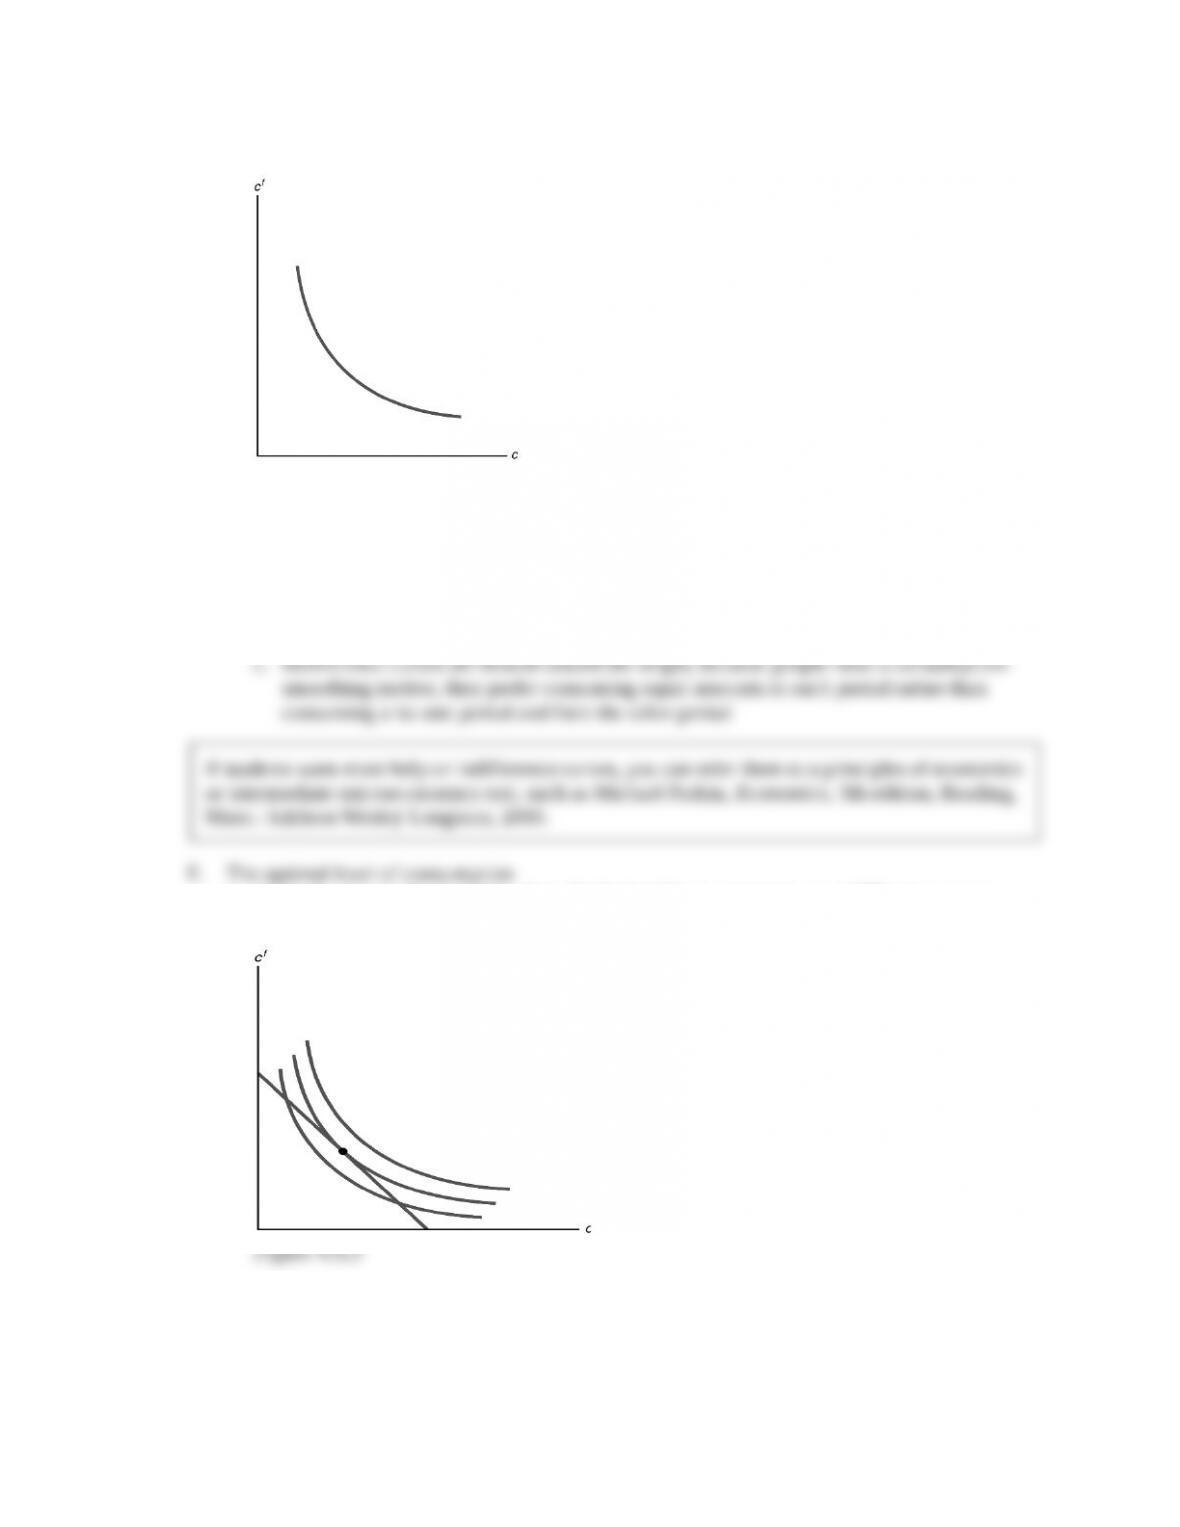
1. Optimal consumption point is where the budget line is tangent to an indifference curve
(Figure 4.A.3)
2. That’s the highest indifference curve that it’s possible to reach
3. All other points on the budget line are on lower indifference curves
G. The Effects of Changes in Income and Wealth on Consumption and Saving
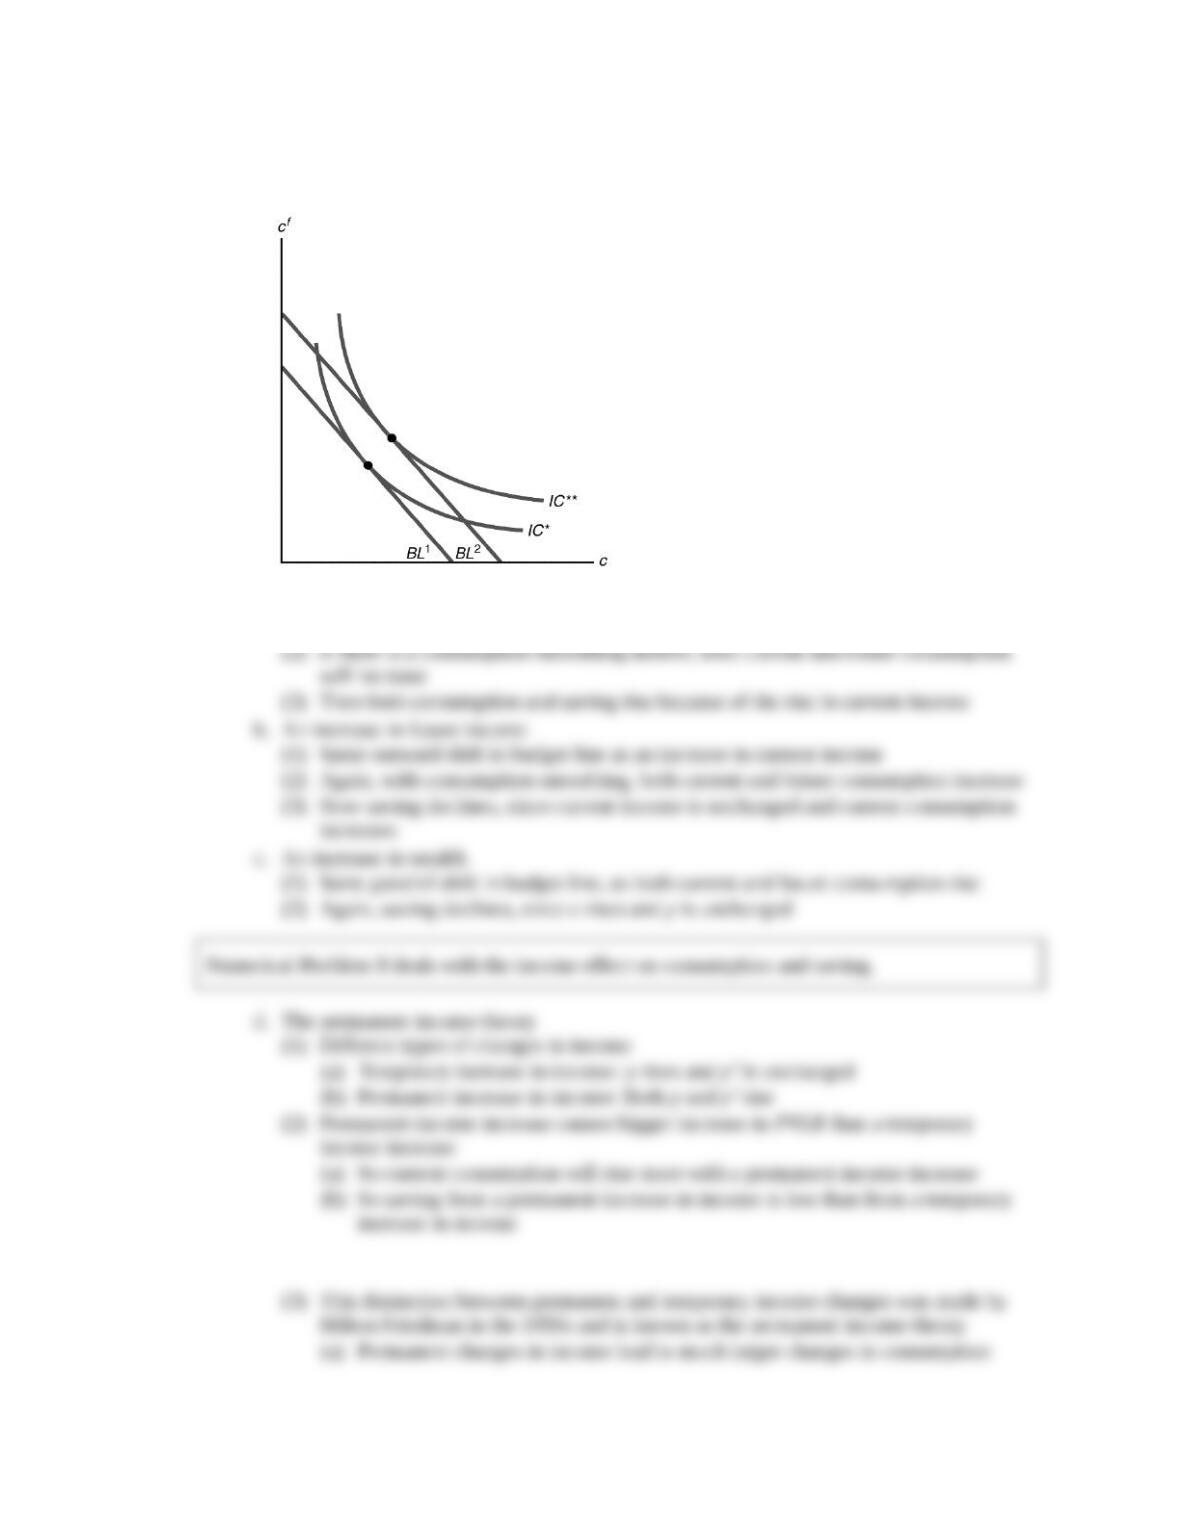
1. The effect on consumption of a change in income (current or future) or wealth depends
only on how the change affects the PVLR
a. An increase in current income (Figure 4.A.4)
Figure 4.A.4
(1) Increases PVLR, so shifts budget line out parallel to old budget line
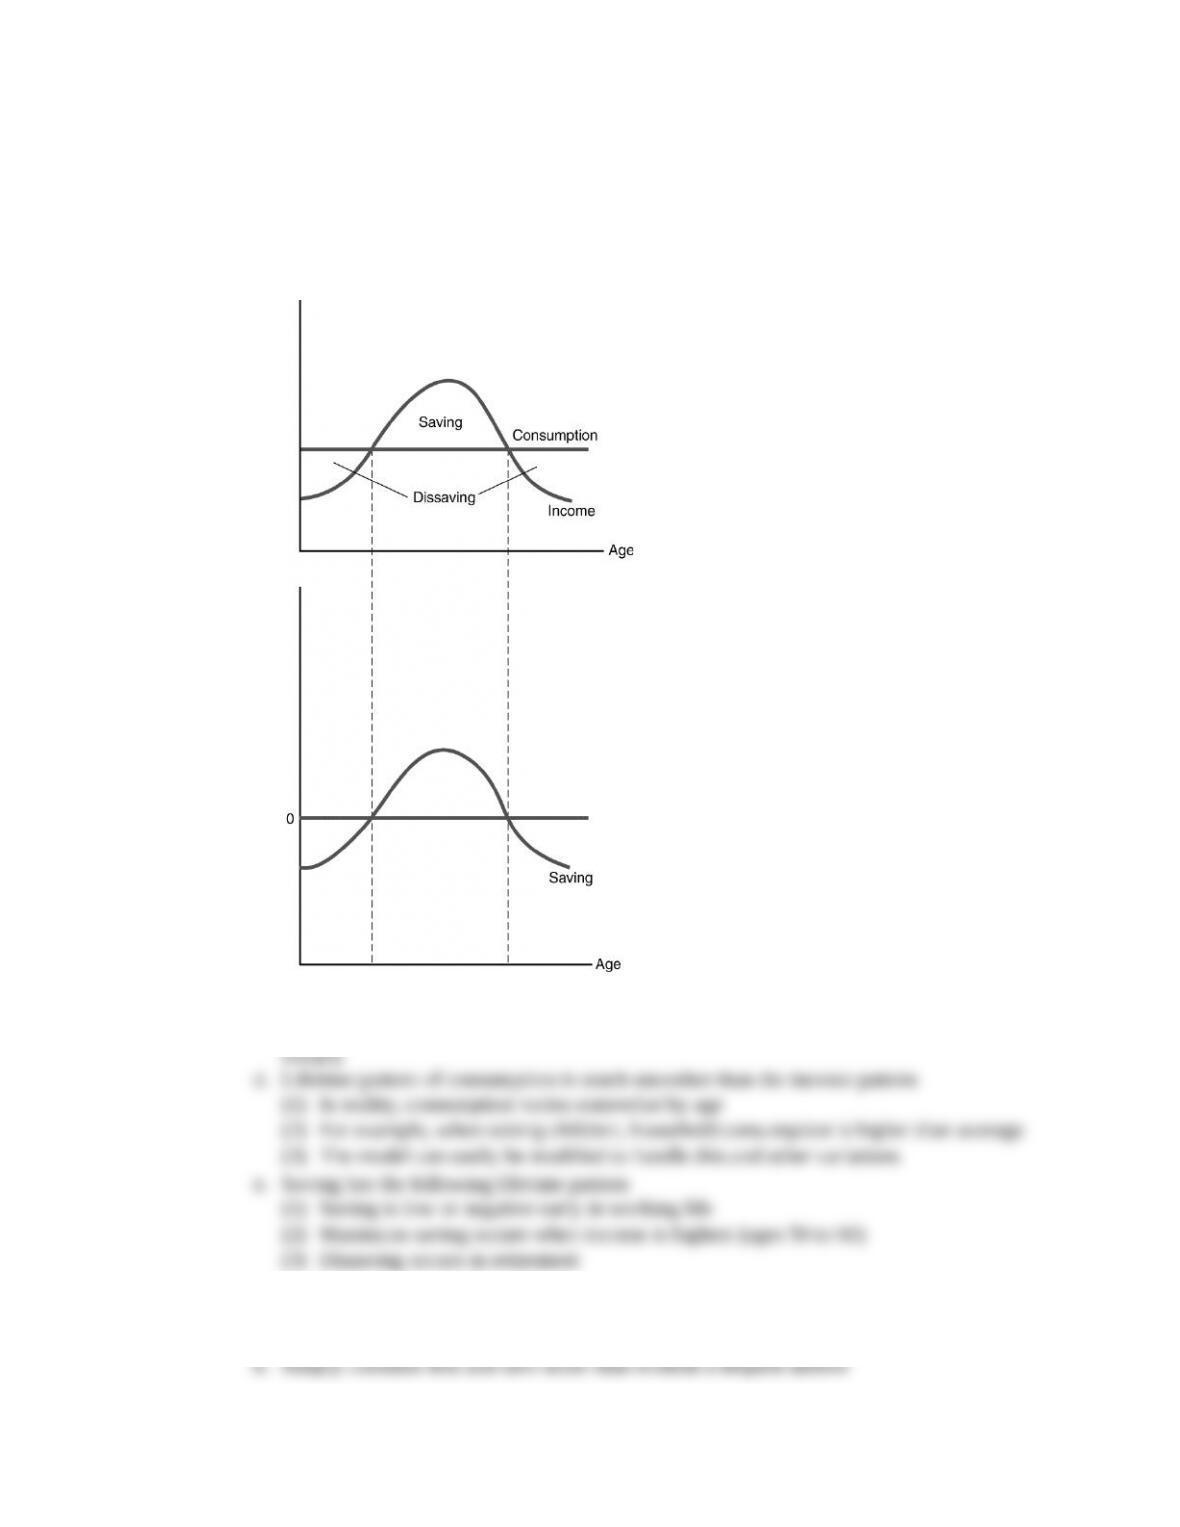
1. Life-cycle model was developed by Franco Modigliani and associates in the 1950s
a. Looks at patterns of income, consumption, and saving over an individual’s lifetime
b. Typical consumer’s income and saving pattern shown in Figure 4.A.5
Figure 4.A.5
c. Real income steadily rises over time until near retirement; at retirement, income drops
2. Bequests and saving
a. What effect does a bequest motive (a desire to leave an inheritance) have on saving?
3. Ricardian equivalence
a. We can use the two-period model to examine Ricardian equivalence
10%, and taxes will be increased by 110 in the future period
d. Then the PVLR is unchanged, and thus there is no change in consumption
4. Excess sensitivity and borrowing constraints
a. Generally, theories about consumption, including the permanent income theory, have
been supported by looking at real-world data
b. But some researchers have found that the data show that the impact of an income or
wealth change is different than that implied by a change in the PVLR
1. The real interest rate and the budget line (Figure 4.A.6)
Figure 4.A.6
2. The substitution effect
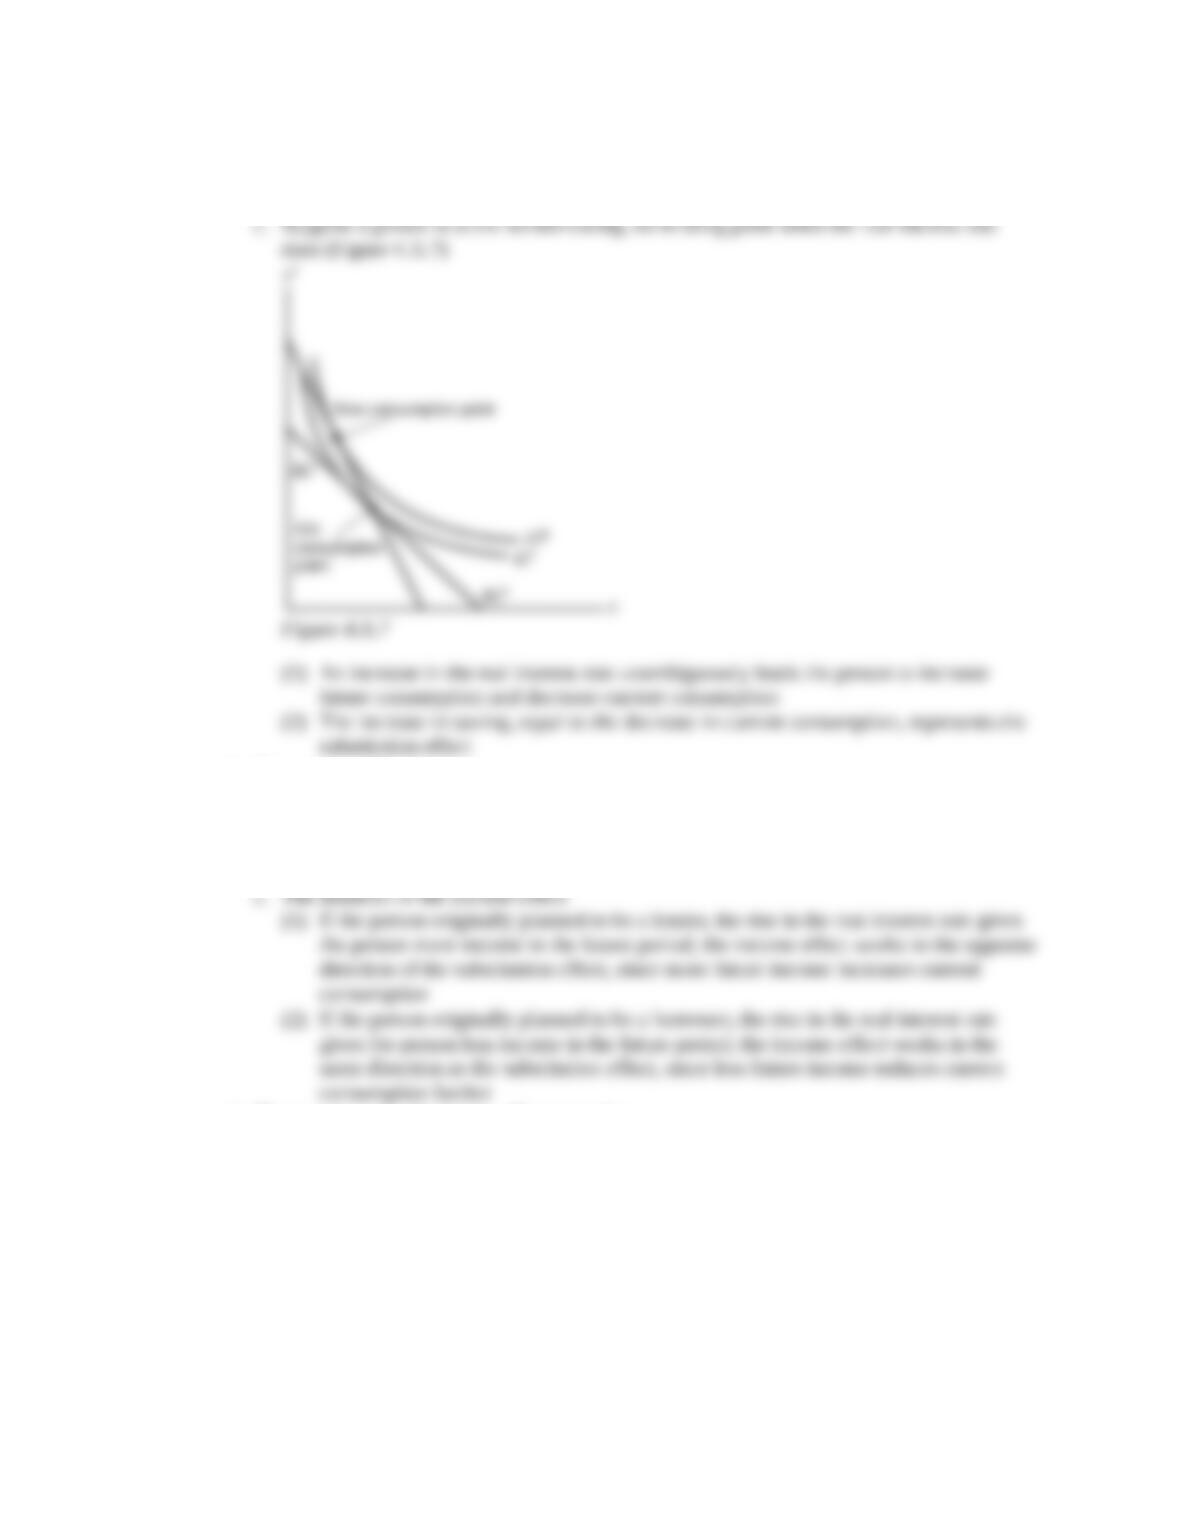
a. A higher real interest rate makes future consumption cheaper relative to current
consumption
b. Increasing future consumption and reducing current consumption increases saving
3. The income effect
a. If a person is planning to consume at the no-borrowing, no-lending point, then a rise in
the real interest rate leads just to a substitution effect
b. But if a person is planning to consume at a different point than the no-borrowing,
no-lending point, there is also an income effect
4. The income and substitution effects together
a. Split the change in the budget line into two parts (Figure 4.A.8)
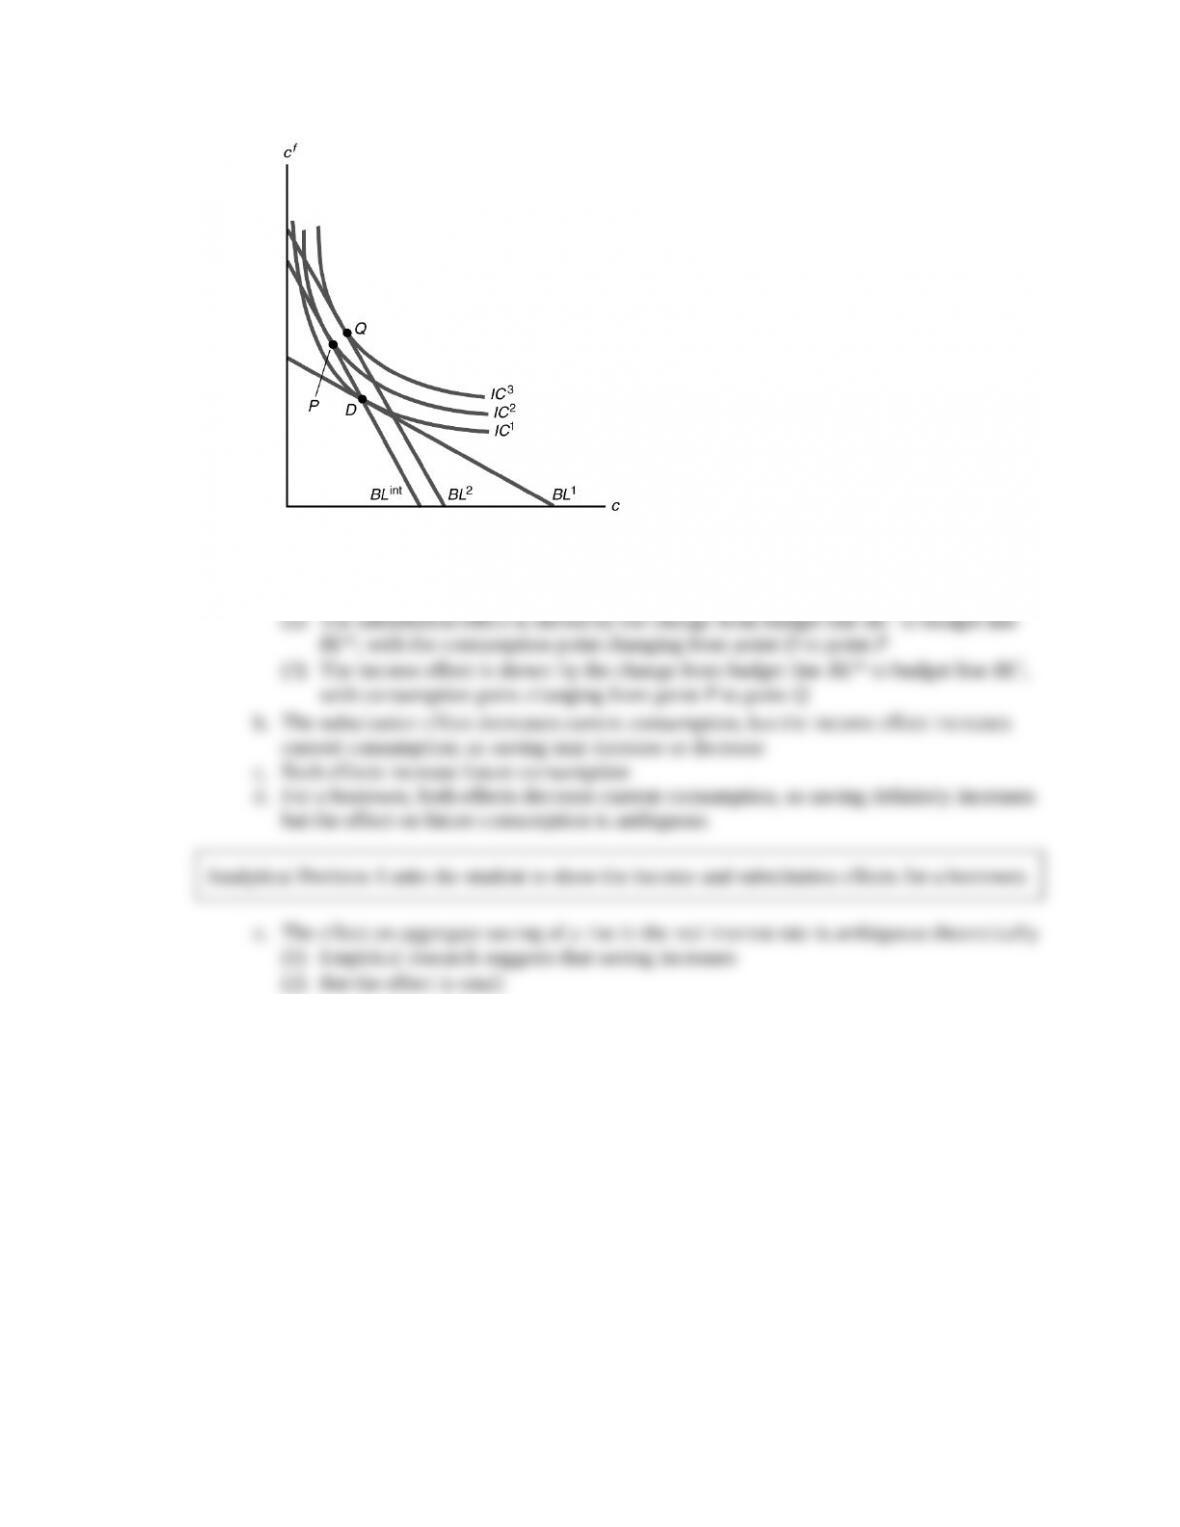
Figure 4.A.8
(1) A budget line with the same slope as the new budget line, but going through the
original consumption point (BLint)
Figure 4.A.1
2. Slope of line (1 r)
Analytical Problem 7 looks at what happens to the budget line when the interest rate on
1. Present value is the value of payments to be made in the future in terms of today’s dollars or
goods
2. Example: At an interest rate of 10%, $12,000 today invested for one year is worth $13,200
($12,000 1.10); so the present value of $13,200 in one year is $12,000
3. General formula: Present value future value/(1 i), where amounts are in dollar terms and
i is the nominal interest rate
4. Alternatively, if amounts are in real terms, use the real interest rate r instead of the nominal
interest rate i
1. Present value of lifetime resources:
PVLR y yf/(1 r) a(4.A.2)
2. Present value of lifetime consumption:
PVLC c cf/(1 r)
3. The budget constraint means PVLC PVLR
4. c cf/(1 r) y yf/(1 r) a (4.A.3)
5. Horizontal intercept of budget line is c PVLR, cf 0
E. What does the consumer want? Consumer preferences
1. Utility a person’s satisfaction or well-being
2. Graph a person’s preference for current versus future consumption using indifference curves
3. An indifference curve shows combinations of c and cf that give the same utility (Figure 4.A.2)
Figure 4.A.2
4. A person is equally happy at any point on an indifference curve
5. Three important properties of indifference curves
a. Slope downward from left to right: Less consumption in one period requires more
consumption in the other period to keep utility unchanged
b. Indifference curves that are farther up and to the right represent higher levels of utility,
because more consumption is preferred to less
1. Optimal consumption point is where the budget line is tangent to an indifference curve
(Figure 4.A.3)
2. That’s the highest indifference curve that it’s possible to reach
3. All other points on the budget line are on lower indifference curves
G. The Effects of Changes in Income and Wealth on Consumption and Saving
1. The effect on consumption of a change in income (current or future) or wealth depends
only on how the change affects the PVLR
a. An increase in current income (Figure 4.A.4)
Figure 4.A.4
(1) Increases PVLR, so shifts budget line out parallel to old budget line
1. Life-cycle model was developed by Franco Modigliani and associates in the 1950s
a. Looks at patterns of income, consumption, and saving over an individual’s lifetime
b. Typical consumer’s income and saving pattern shown in Figure 4.A.5
Figure 4.A.5
c. Real income steadily rises over time until near retirement; at retirement, income drops
2. Bequests and saving
a. What effect does a bequest motive (a desire to leave an inheritance) have on saving?
3. Ricardian equivalence
a. We can use the two-period model to examine Ricardian equivalence
10%, and taxes will be increased by 110 in the future period
d. Then the PVLR is unchanged, and thus there is no change in consumption
4. Excess sensitivity and borrowing constraints
a. Generally, theories about consumption, including the permanent income theory, have
been supported by looking at real-world data
b. But some researchers have found that the data show that the impact of an income or
wealth change is different than that implied by a change in the PVLR
1. The real interest rate and the budget line (Figure 4.A.6)
Figure 4.A.6
2. The substitution effect
a. A higher real interest rate makes future consumption cheaper relative to current
consumption
b. Increasing future consumption and reducing current consumption increases saving
3. The income effect
a. If a person is planning to consume at the no-borrowing, no-lending point, then a rise in
the real interest rate leads just to a substitution effect
b. But if a person is planning to consume at a different point than the no-borrowing,
no-lending point, there is also an income effect
4. The income and substitution effects together
a. Split the change in the budget line into two parts (Figure 4.A.8)
Figure 4.A.8
(1) A budget line with the same slope as the new budget line, but going through the
original consumption point (BLint)