Chapter 12
1. Unemployment and inflation (this chapter)
2. Policy in an open economy—international trade and finance (Ch. 13)
3. Monetary institutions and policy (Ch. 14)
4. Fiscal institutions and policy (Ch. 15)
II. Goals of Chapter 12
A. Describe the Phillips curve relationship between unemployment and inflation (Sec. 12.1)
B. Discuss whether the Phillips curve offers a ‘menu’ of inflation-unemployment combinations from
which policymakers can choose (Sec. 12.2)
1. The idea originated in 1958 when A.W. Phillips showed a negative relationship between
unemployment and nominal wage growth in Britain
2. Since then economists have looked at the relationship between unemployment and inflation
3. In the 1950s and 1960s many nations seemed to have a negative relationship between the
two variables
4. The United States appears to be on one Phillips curve in the 1960s (text Figure 12.1)
5. This suggested that policymakers could choose the combination of unemployment and inflation they
most desired
6. But the relationship fell apart in the following three decades (text Figure 12.2)
7. The 1970s were a particularly bad period, with both high inflation and high unemployment,
inconsistent with the Phillips curve
1. Friedman and Phelps: The cyclical unemployment rate (the difference between actual and natural
unemployment rates) depends only on unanticipated inflation (the difference between actual and
2. How does this work in the extended classical model?
Analytical Problem 3 looks at similar analysis in a Keynesian model.
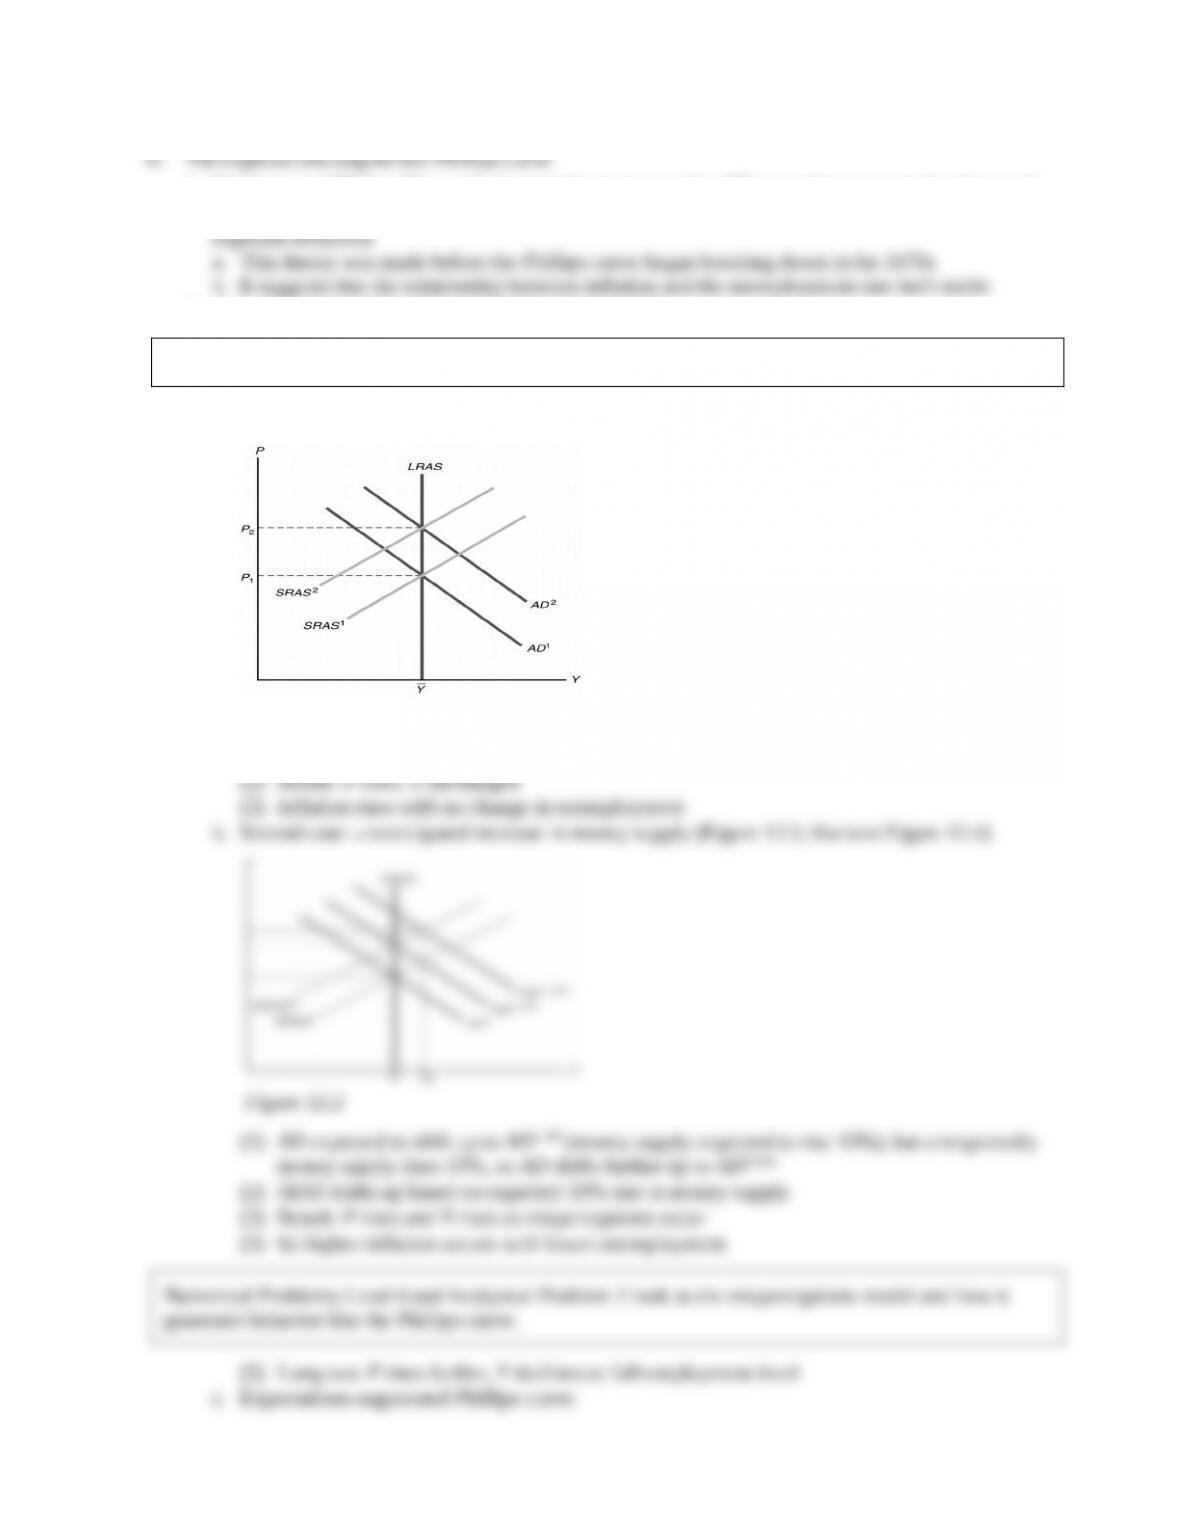
a. First case: anticipated increase in money supply (Figure 12.1; like text Figure 12.3)
Figure 12.1
(1) AD shifts up and SRAS shifts up, with no misperceptions
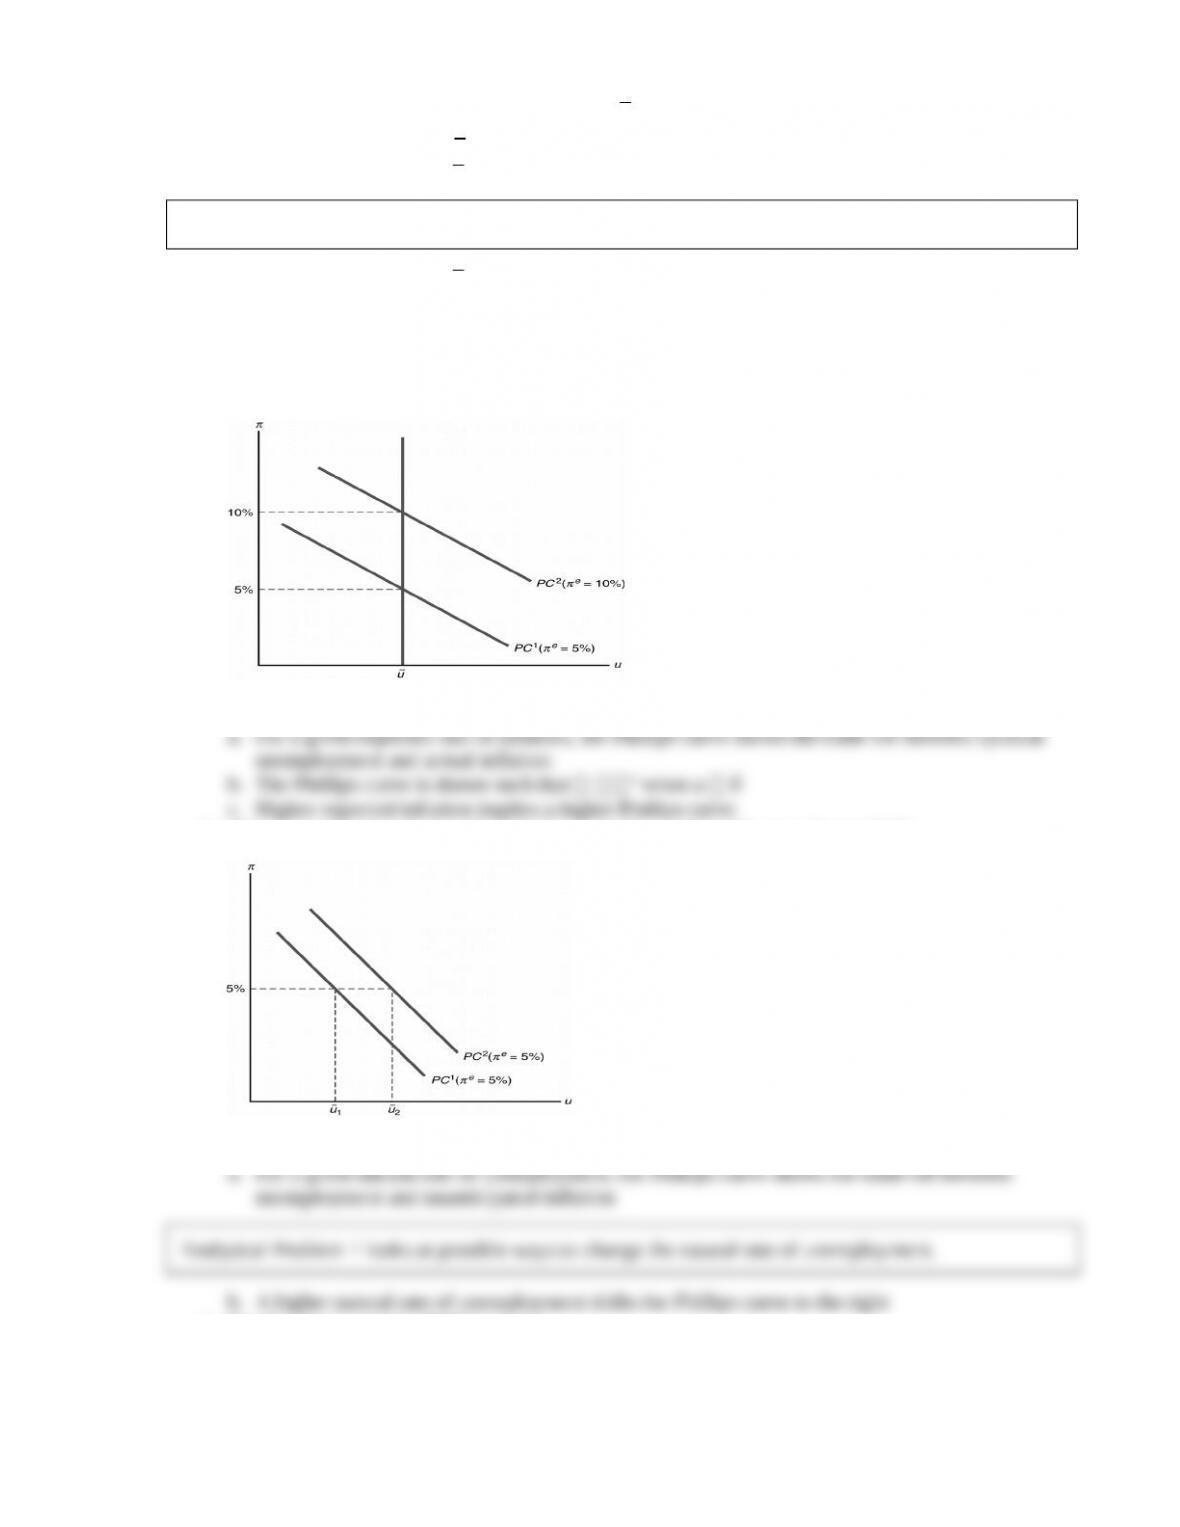
1. The Phillips curve shows the relationship between unemployment and inflation for a given expected
rate of inflation and natural rate of unemployment
2. Changes in the expected rate of inflation (Figure 12.3; like text Figure 12.5)
Figure 12.3
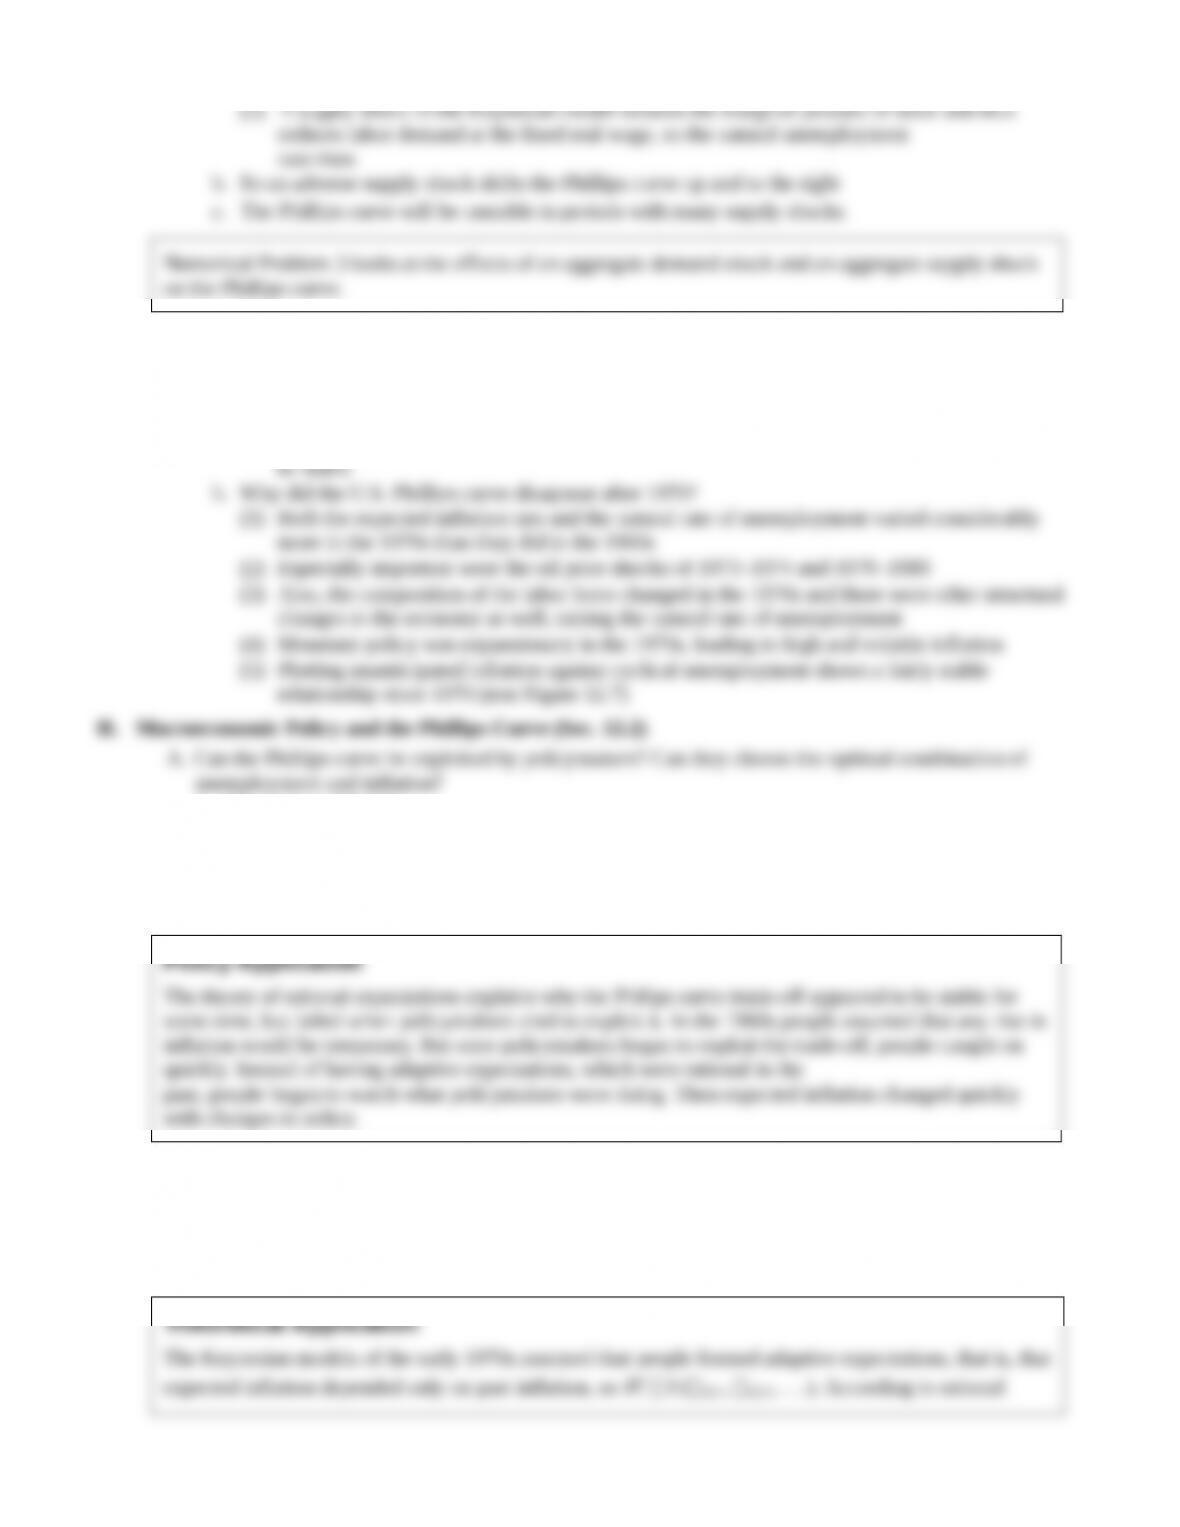
3. Changes in the natural rate of unemployment (Figure 12.4; like text Figure 12.6)
Figure 12.4
4. Supply shocks and the Phillips curve
a. A supply shock increases both expected inflation and the natural rate of unemployment
(1) A supply shock in the classical model increases the natural rate of unemployment, because it
increases the mismatch between firms and workers
5. The shifting Phillips curve in practice
a. Why did the original Phillips curve relationship apply to many historical cases?
(1) The original relationship between inflation and unemployment holds up as long as expected
inflation and the natural rate of unemployment are approximately constant
(2) This was true in the United States in the 1960s, so the Phillips curve appeared to
1. Classical model: NO
a. The unemployment rate returns to its natural level quickly, as people’s expectations adjust
b. So unemployment can change from its natural level only for a very brief time
c. Also, people catch on to policy games; they have rational expectations and try to anticipate
policy changes, so there is no way to fool people systematically
2. Keynesian model: YES, temporarily
a. The expected rate of inflation in the Phillips curve is the forecast of inflation at the time the oldest
sticky prices were set
b. It takes time for prices and expected prices to adjust, so unemployment may differ from the
natural rate for some time

1. When the rules of the game change, behavior changes
2. For example, if batters in baseball were called out after two strikes instead of three, they’d swing
more often when they have one strike than they do now
3. Lucas applied this idea to macroeconomics, arguing that historical relationships between variables
won’t hold up if there’s been a major policy change
4. The Phillips curve is a good example—it fell apart as soon as policymakers tried to exploit it
5. Evaluating policy requires an understanding of how behavior will change under the new policy, so
both economic theory and empirical analysis are necessary
3. Changes in the level of money supply have no long-run real effects; changes in the growth rate of
money supply have no long-run real effects, either
4. Even though expansionary policy may reduce unemployment only temporarily, policymakers may
want to do so if, for example, timing economic booms right before elections helps them (or their
political allies) get reelected
Theoretical Application
1. Loss in output from idle resources
a. Workers lose income
2. Personal or psychological cost to workers and their families
a. Especially important for those with long spells of unemployment
3. There are some offsetting factors
a. Unemployment leads to increased job search and acquiring new skills, which may lead to
1. The changing natural rate
a. How do we calculate the natural rate of unemployment?
1990s, and 2000s
c. In the 1980s and 1990s, demographic forces reduced the natural rate of unemployment
in 1998
(2) Research by Shimer showed this is the main reason for the fall in the natural rate
and 2000s
(1) The labor market became more efficient at matching workers and jobs, reducing frictional
and structural unemployment
(2) Temporary help agencies became prominent, helping the matching process and reducing the
natural rate of unemployment
f. Increased labor productivity may increase the natural rate of unemployment
(1) If increases in real wages lag changes in productivity, firms hire more workers and the
natural rate of unemployment will decline temporarily
(2) Ball and Mankiw found evidence supporting this hypothesis in the 1990s
Data Application
A very different picture of the natural rate of unemployment than that of the CBO comes from classical
economists, who think the natural rate changes much more than the CBO’s measure does. One version of
this can be found in the article “In Search of the Natural Rate of Unemployment,” by Thomas B. King

7. The 1970s were a particularly bad period, with both high inflation and high unemployment,
inconsistent with the Phillips curve
1. Friedman and Phelps: The cyclical unemployment rate (the difference between actual and natural
unemployment rates) depends only on unanticipated inflation (the difference between actual and
2. How does this work in the extended classical model?
Analytical Problem 3 looks at similar analysis in a Keynesian model.
a. First case: anticipated increase in money supply (Figure 12.1; like text Figure 12.3)
Figure 12.1
(1) AD shifts up and SRAS shifts up, with no misperceptions
1. The Phillips curve shows the relationship between unemployment and inflation for a given expected
rate of inflation and natural rate of unemployment
2. Changes in the expected rate of inflation (Figure 12.3; like text Figure 12.5)
Figure 12.3
3. Changes in the natural rate of unemployment (Figure 12.4; like text Figure 12.6)
Figure 12.4
4. Supply shocks and the Phillips curve
a. A supply shock increases both expected inflation and the natural rate of unemployment
(1) A supply shock in the classical model increases the natural rate of unemployment, because it
increases the mismatch between firms and workers
5. The shifting Phillips curve in practice
a. Why did the original Phillips curve relationship apply to many historical cases?
(1) The original relationship between inflation and unemployment holds up as long as expected
inflation and the natural rate of unemployment are approximately constant
(2) This was true in the United States in the 1960s, so the Phillips curve appeared to
1. Classical model: NO
a. The unemployment rate returns to its natural level quickly, as people’s expectations adjust
b. So unemployment can change from its natural level only for a very brief time
c. Also, people catch on to policy games; they have rational expectations and try to anticipate
policy changes, so there is no way to fool people systematically
2. Keynesian model: YES, temporarily
a. The expected rate of inflation in the Phillips curve is the forecast of inflation at the time the oldest
sticky prices were set
b. It takes time for prices and expected prices to adjust, so unemployment may differ from the
natural rate for some time
1. When the rules of the game change, behavior changes
2. For example, if batters in baseball were called out after two strikes instead of three, they’d swing
more often when they have one strike than they do now
3. Lucas applied this idea to macroeconomics, arguing that historical relationships between variables
won’t hold up if there’s been a major policy change
4. The Phillips curve is a good example—it fell apart as soon as policymakers tried to exploit it
5. Evaluating policy requires an understanding of how behavior will change under the new policy, so
both economic theory and empirical analysis are necessary
3. Changes in the level of money supply have no long-run real effects; changes in the growth rate of
money supply have no long-run real effects, either
4. Even though expansionary policy may reduce unemployment only temporarily, policymakers may
want to do so if, for example, timing economic booms right before elections helps them (or their
political allies) get reelected
Theoretical Application
1. Loss in output from idle resources
a. Workers lose income
2. Personal or psychological cost to workers and their families
a. Especially important for those with long spells of unemployment
3. There are some offsetting factors
a. Unemployment leads to increased job search and acquiring new skills, which may lead to
1. The changing natural rate
a. How do we calculate the natural rate of unemployment?
1990s, and 2000s
c. In the 1980s and 1990s, demographic forces reduced the natural rate of unemployment
in 1998
(2) Research by Shimer showed this is the main reason for the fall in the natural rate
and 2000s
(1) The labor market became more efficient at matching workers and jobs, reducing frictional
and structural unemployment
(2) Temporary help agencies became prominent, helping the matching process and reducing the
natural rate of unemployment
f. Increased labor productivity may increase the natural rate of unemployment
(1) If increases in real wages lag changes in productivity, firms hire more workers and the
natural rate of unemployment will decline temporarily
(2) Ball and Mankiw found evidence supporting this hypothesis in the 1990s
Data Application
A very different picture of the natural rate of unemployment than that of the CBO comes from classical
economists, who think the natural rate changes much more than the CBO’s measure does. One version of
this can be found in the article “In Search of the Natural Rate of Unemployment,” by Thomas B. King