CHAPTER 8
MODELS FOR ECONOMIC EVALUATION
P/F,6,8
1) P = $10,000 (0.6274) = $6,274
Annual Equivalent Comparison:
12) (a) $4,000 ( ) + $3,000 ( )
14) (a) Without sprinkler system:
P/A,i,20
56
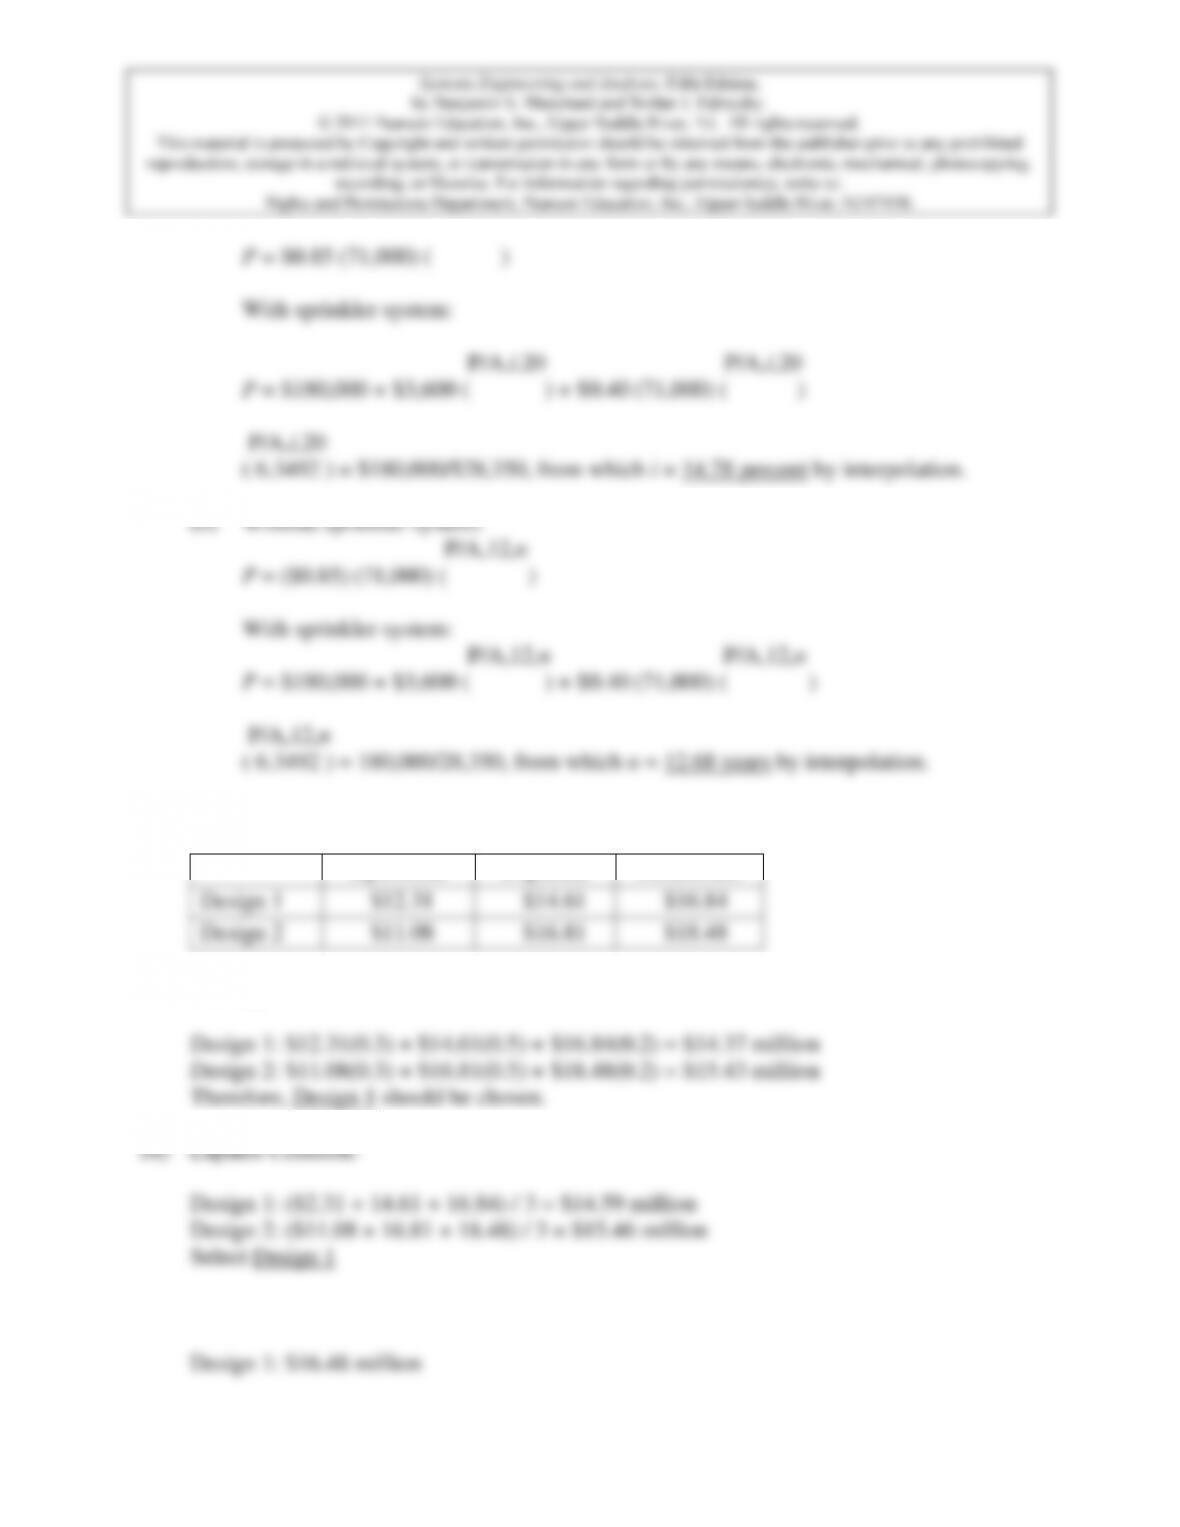
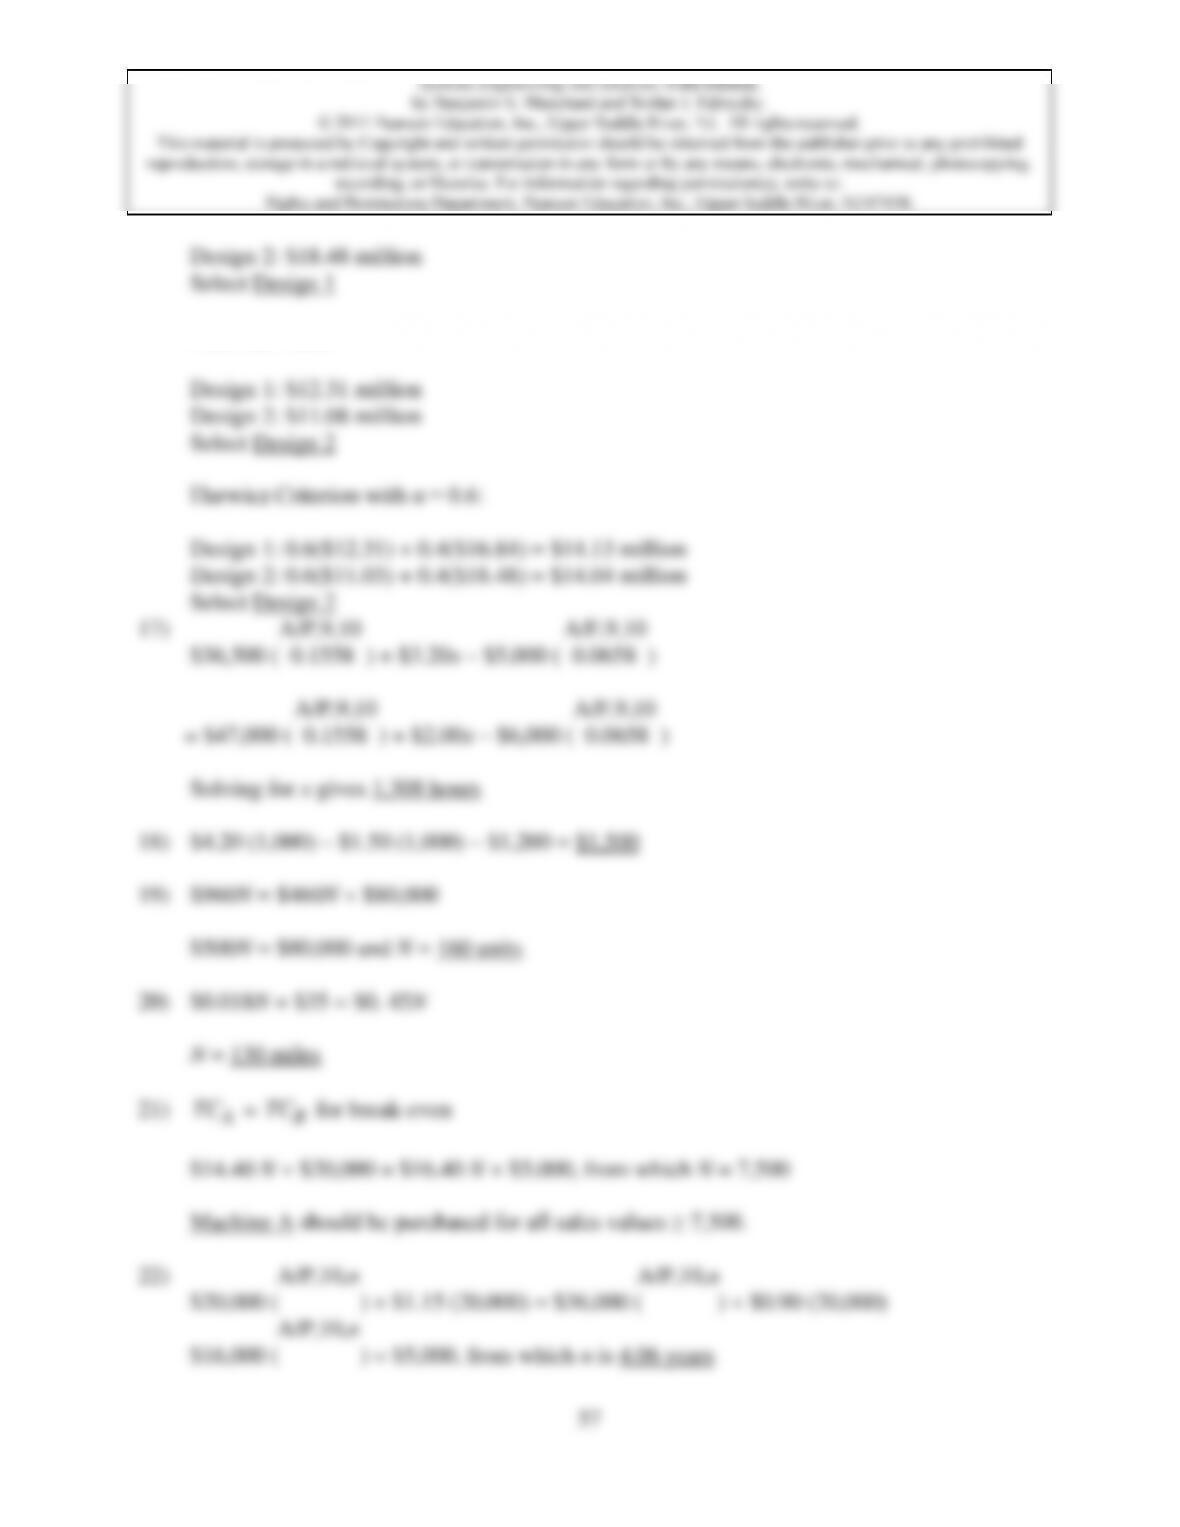
15) The present equivalent payoff matrix for the three futures of the two alternatives is:
Optimistic
Expected
Pessimistic
Design 1
$12.31
$14.61
$16.84
Design 2
$11.08
$16.81
$18.48
The expected cost for each alternative is calculated as:
Maximin Rule:
57
Maximax Rule:
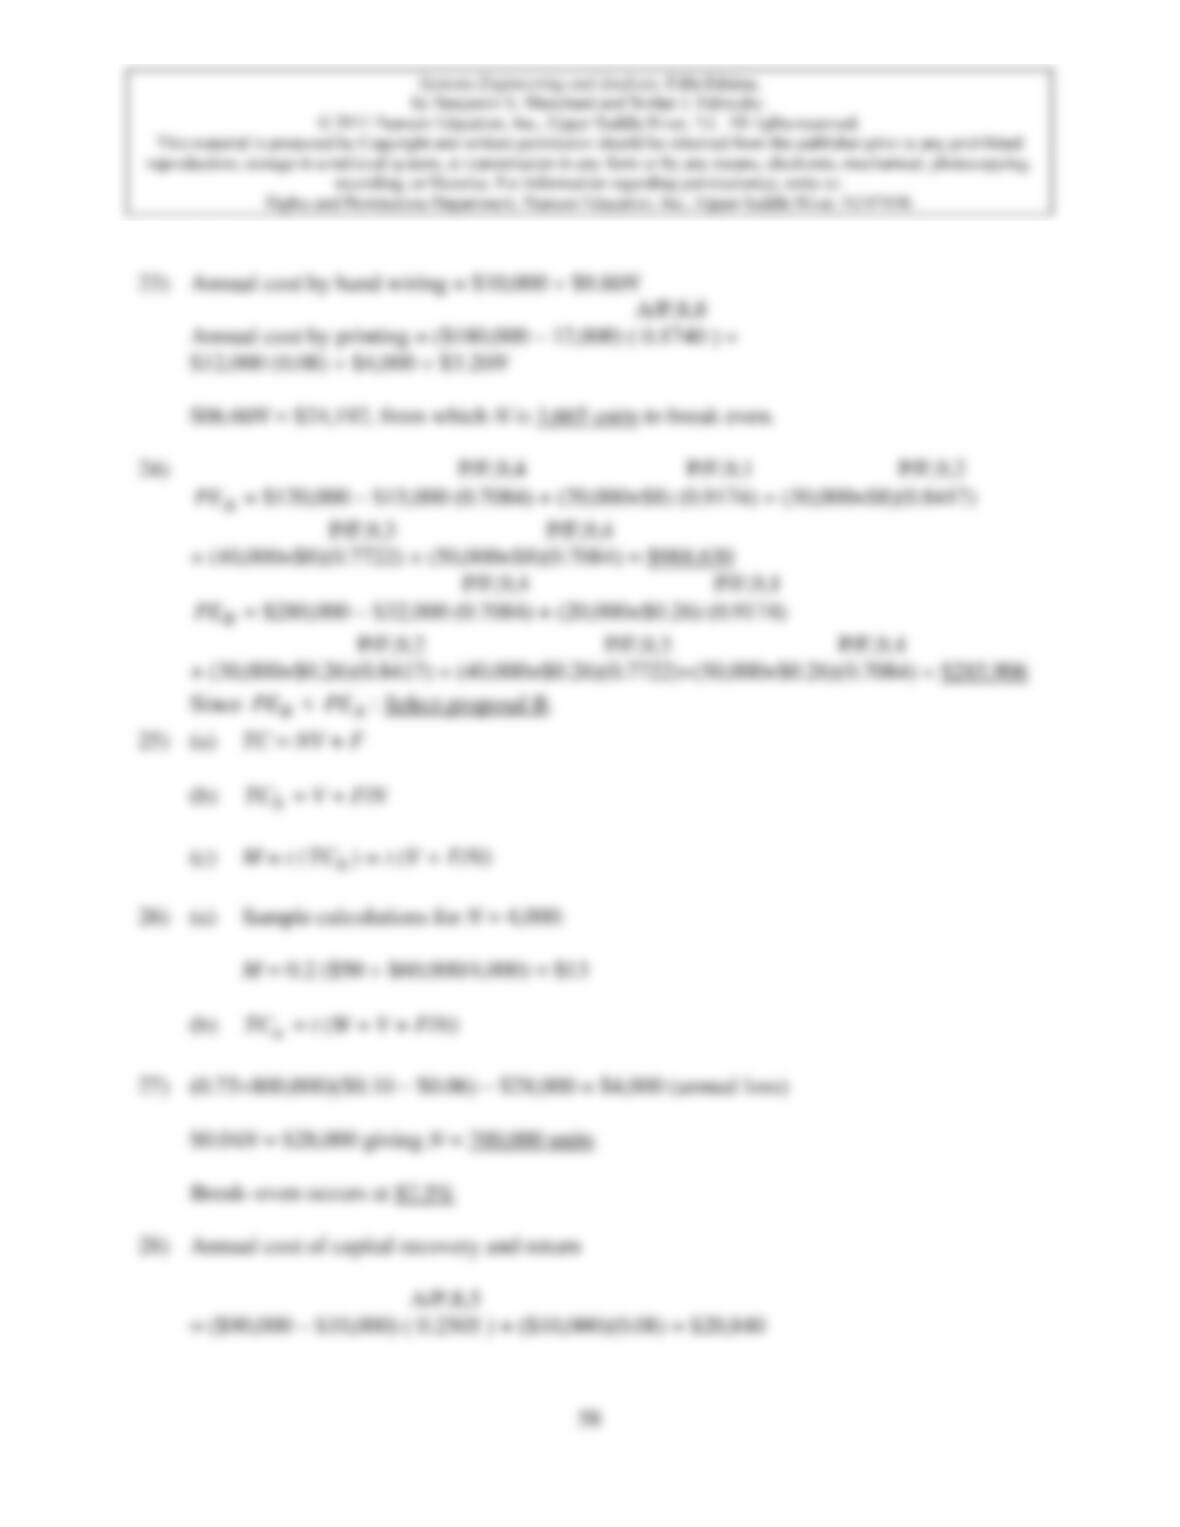
23) Annual cost by hand wiring = $10,000 + $9.80N
A/P,8,8
Annual cost by printing = ($180,000 – 12,000) ( 0.1740 ) +
$12,000 (0.08) + $4,000 + $3.20N
$06.60N = $24,192, from which N is 3,665 units to break even.
24) P/F,9,4 P/F,9,1 P/F,9,2
A
PE
= $120,000 – $15,000 (0.7084) + (20,000×$8) (0.9174) + (30,000×$8)(0.8417)
P/F,9,3 P/F,9,4
+ (40,000×$8)(0.7722) + (50,000×$8)(0.7084) = $988,630
P/F,9,4 P/F,9,1
B
PE
= $280,000 – $32,000 (0.7084) + (20,000×$0.26) (0.9174)
P/F,9,2 P/F,9,3 P/F,9,4
+ (30,000×$0.26)(0.8417) + (40,000×$0.26)(0.7722)+(50,000×$0.26)(0.7084) = $285,906
Since
B
PE
<
:
A
PE
Select proposal B.
25) (a) TC = NV + F
(b)
h
TC
= V + F/N
(c) M = t (
h
TC
) = t (V + F/N)
26) (a) Sample calculations for N = 4,000:
M = 0.2 ($50 + $60,000/4,000) = $13
(b)
u
TC
= t (W + V + F/N)
27) (0.75800,000)($0.10 – $0.06) – $28,000 = $4,000 (annual loss)
$0.04N = $28,000 giving N = 700,000 units
Break–even occurs at 87.5%
28) Annual cost of capital recovery and return
A/P,8,5
= ($90,000 – $10,000) ( 0.2505 ) + ($10,000)(0.08) = $20,840
59
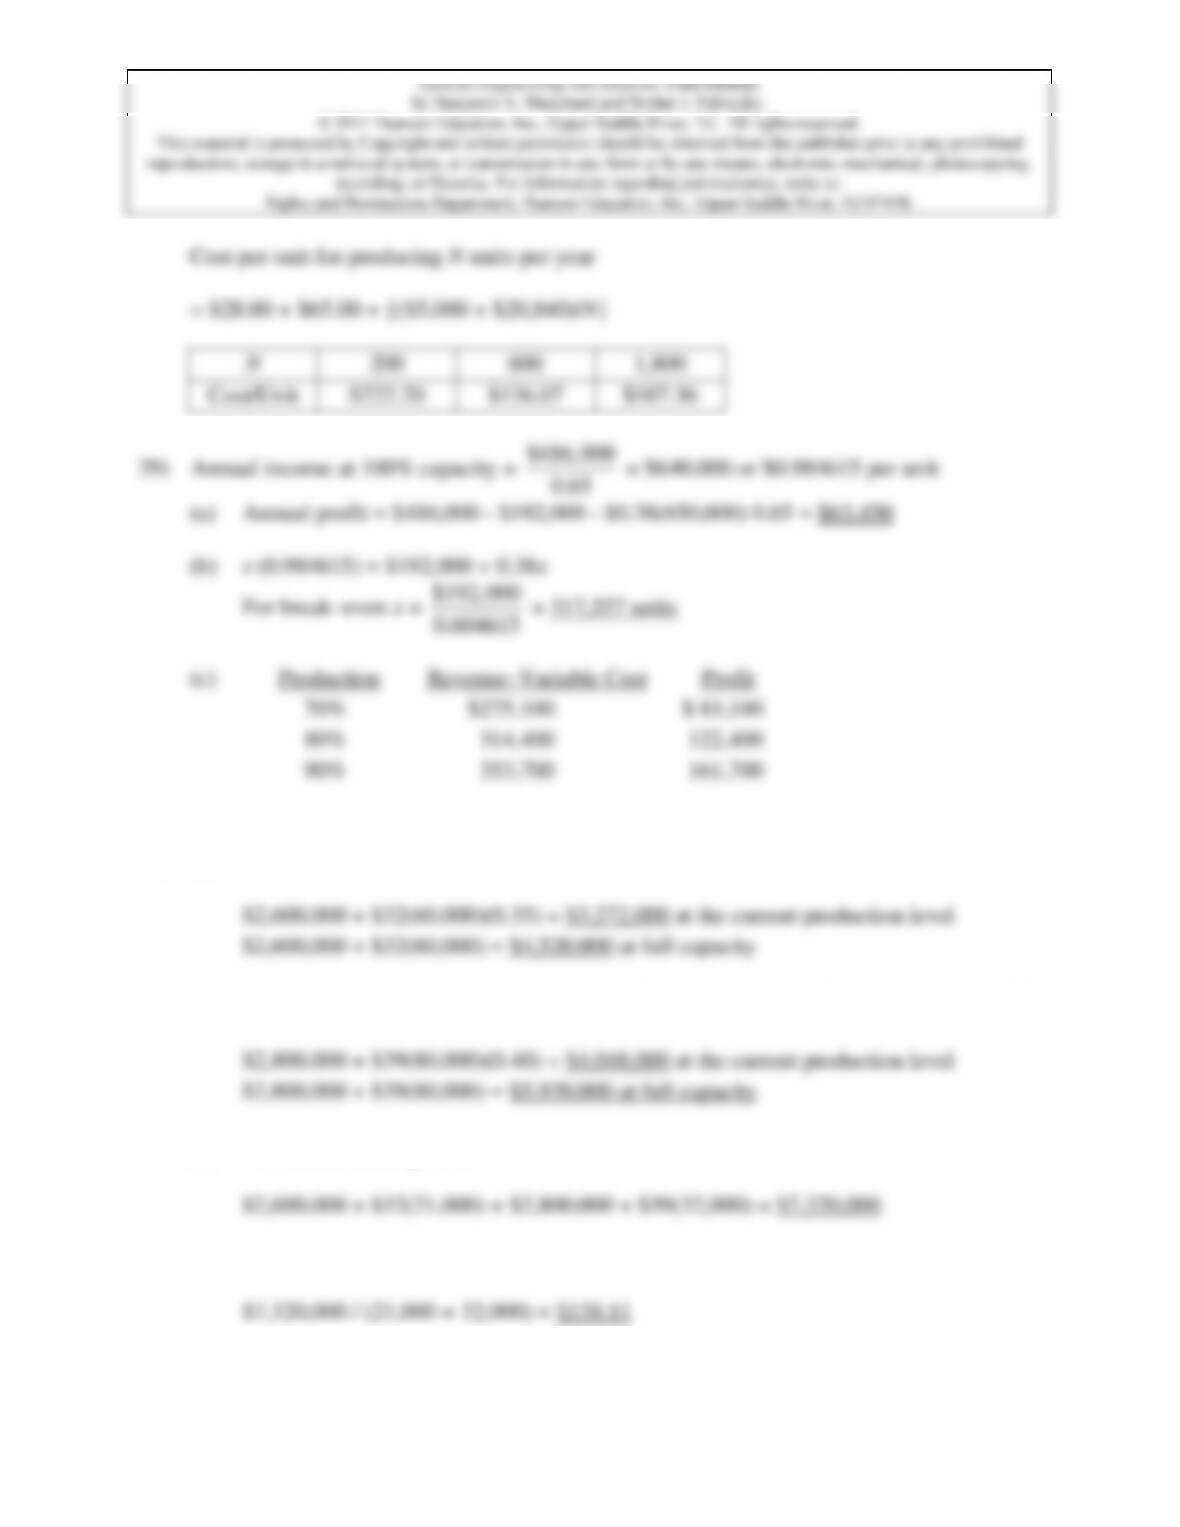
30) (a) Total cost at Plant A:
Total cost at Plant B:
(b) Total cost at both plants:
Average unit cost per gallon of both plants:
(c) Total cost if all production is transferred to plant A:
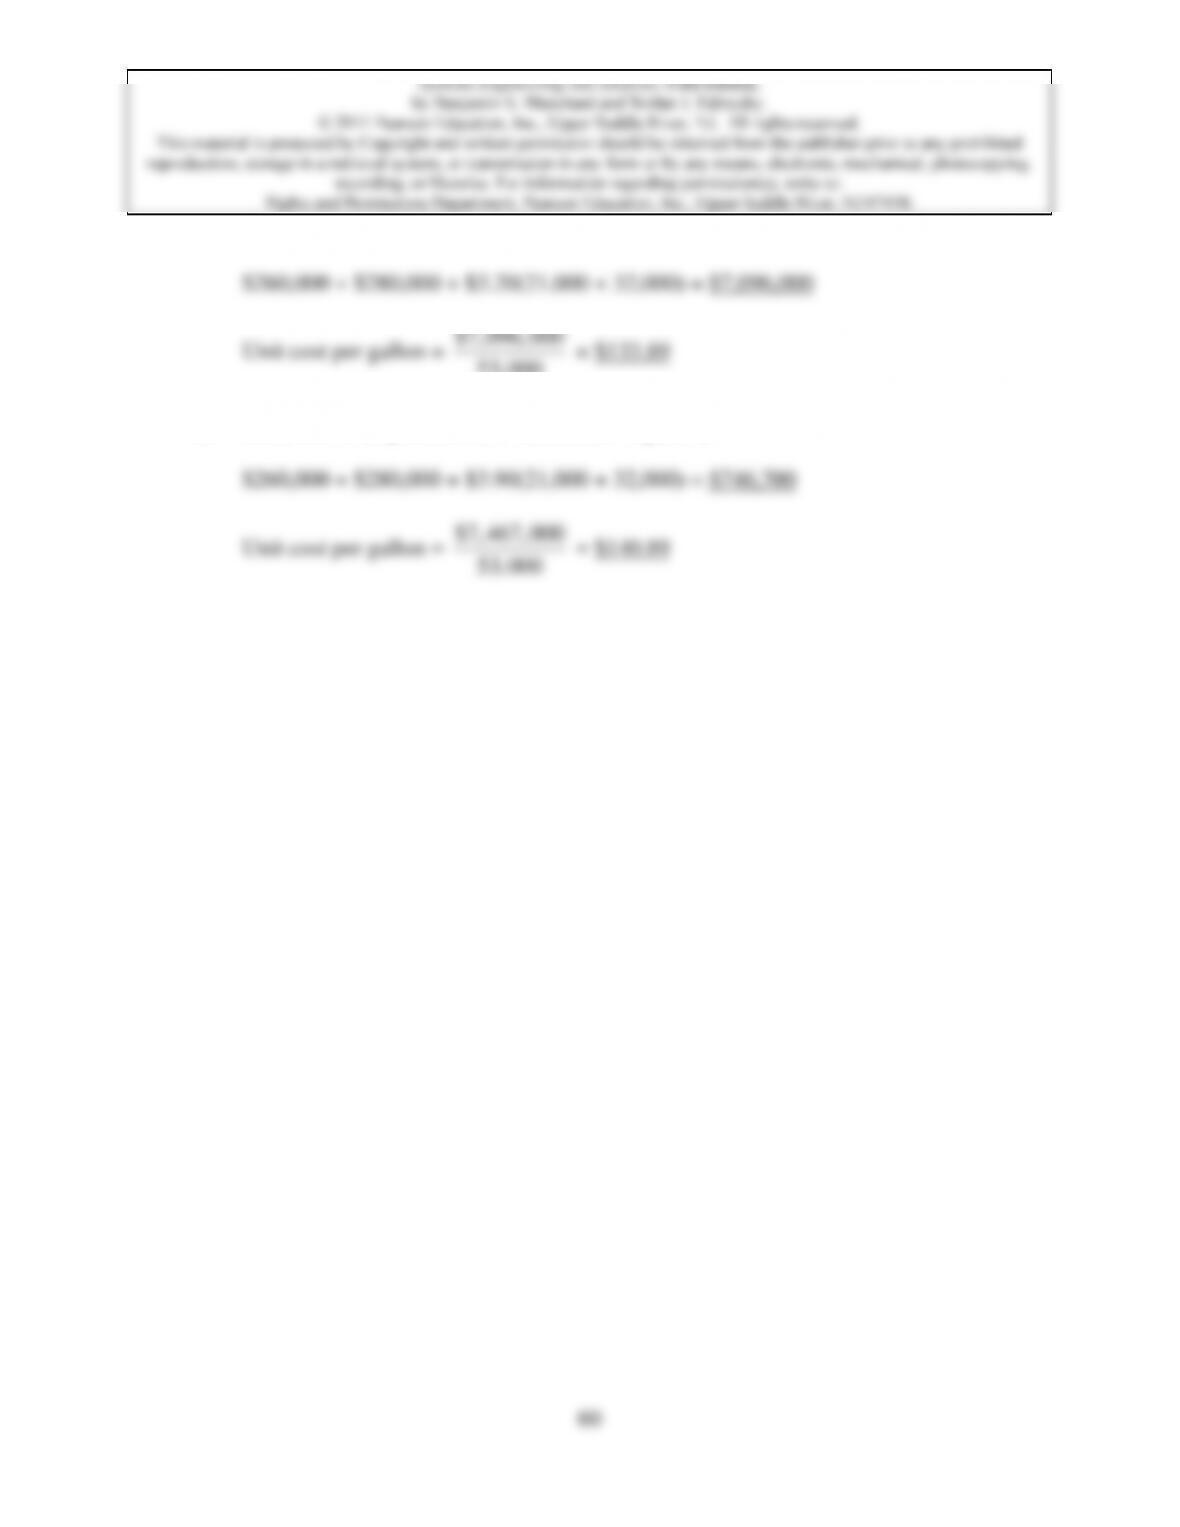
$260,000 + $280,000 + $3.20(21,000 + 32,000) = $7,096,000
$7,096,000