CHAPTER 11
CONTROL CONCEPTS AND METHODS
1) Speed, the characteristic to be controlled, is measured by a well known sensory device
called a speedometer and monitored by the automobile driver. Measured speed is compared
to planned speed by the driver who activates the throttle to make the speed change needed
to achieve the desired velocity.
30.223(0.002)
R
6) Utilizing the factors in Table 11.2, page 329
(a)
x
UCL
= 44.125 + 0.577(6) = 47.587
X
LCL
= 44.125 – 0.577(6) = 40.663.
(b)
R
UCL
= 2.115(6) = 12.690
R
LCL
= 0
7) Sketch not given. Calculate
2
/Rd
=
= 6/2.326 = 2.58
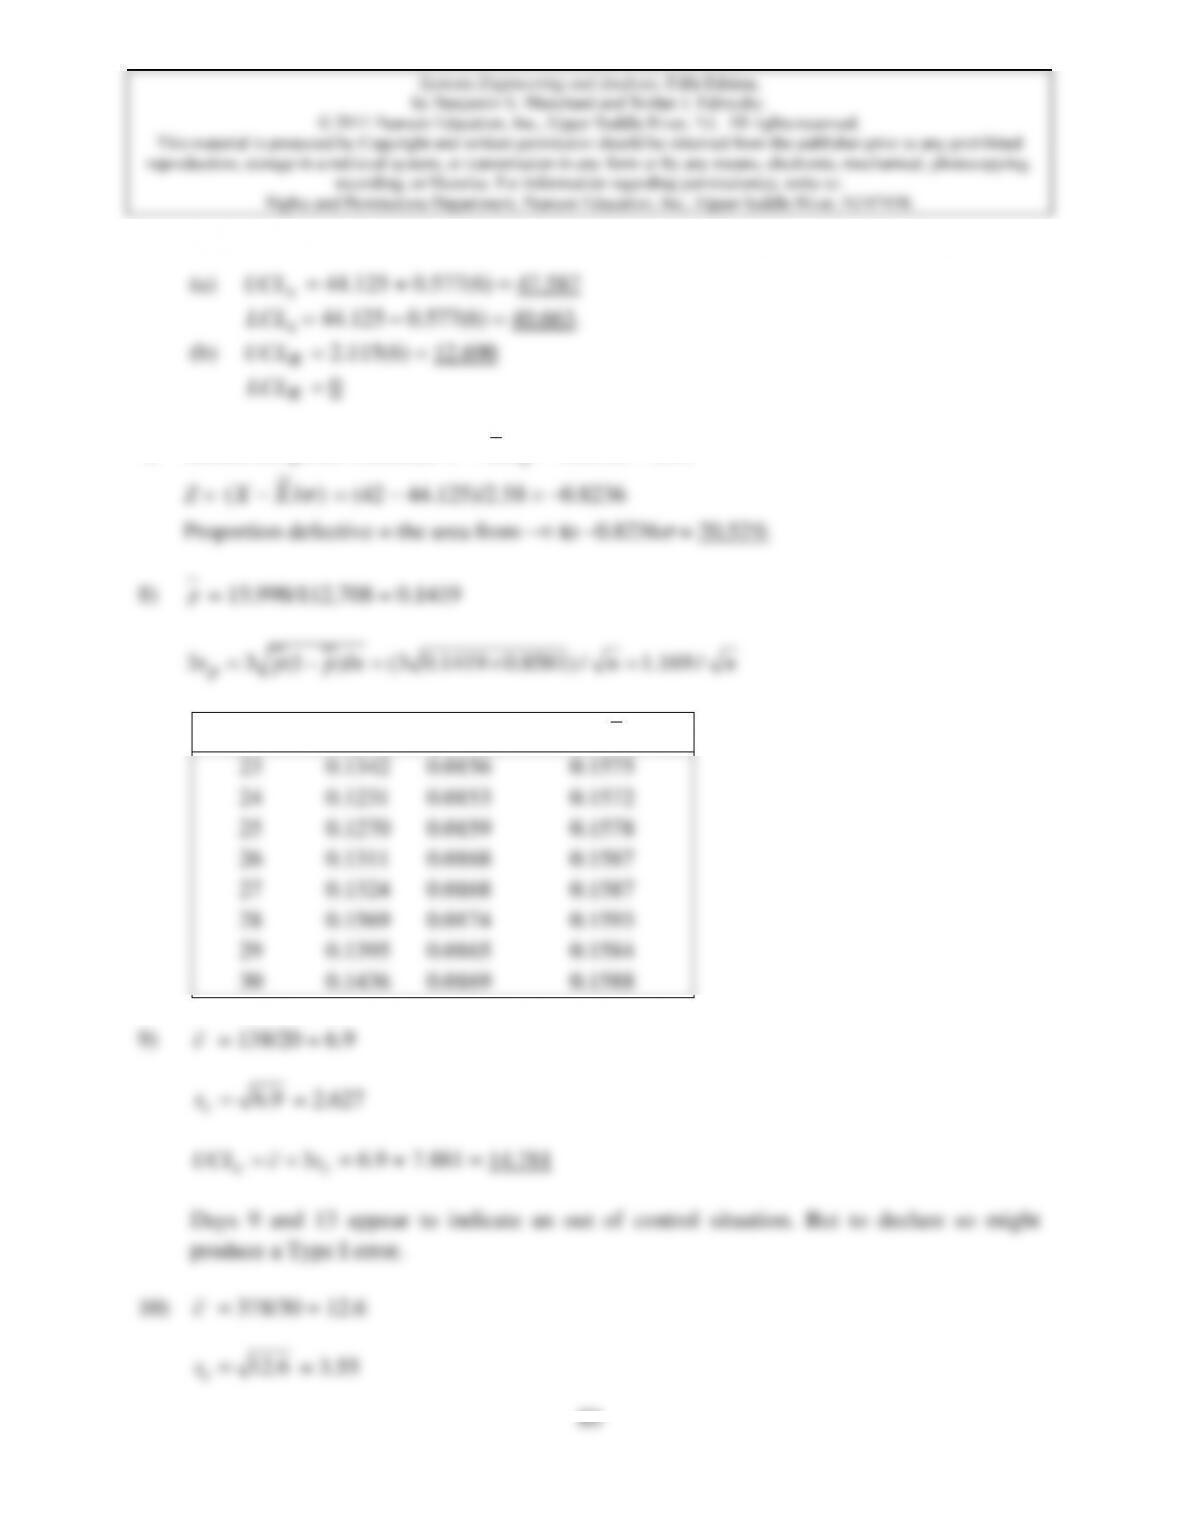
p
Weekend
P
3p
s
3
Pp
UCL p s=+
23
0.1342
0.0156
0.1575
24
0.1231
0.0153
0.1572
25
0.1270
0.0159
0.1578
26
0.1311
0.0168
0.1587
27
0.1324
0.0168
0.1587
28
0.1569
0.0174
0.1593
29
0.1395
0.0165
0.1584
30
0.1436
0.0169
0.1588
c
3
cc
UCL c s=+
= 12.6 + 10.65 = 23.25
3
cc
UCL c s=+
= 12.6 – 10.65 = 1.95
There is no evidence in these data of an assignable cause of variation.
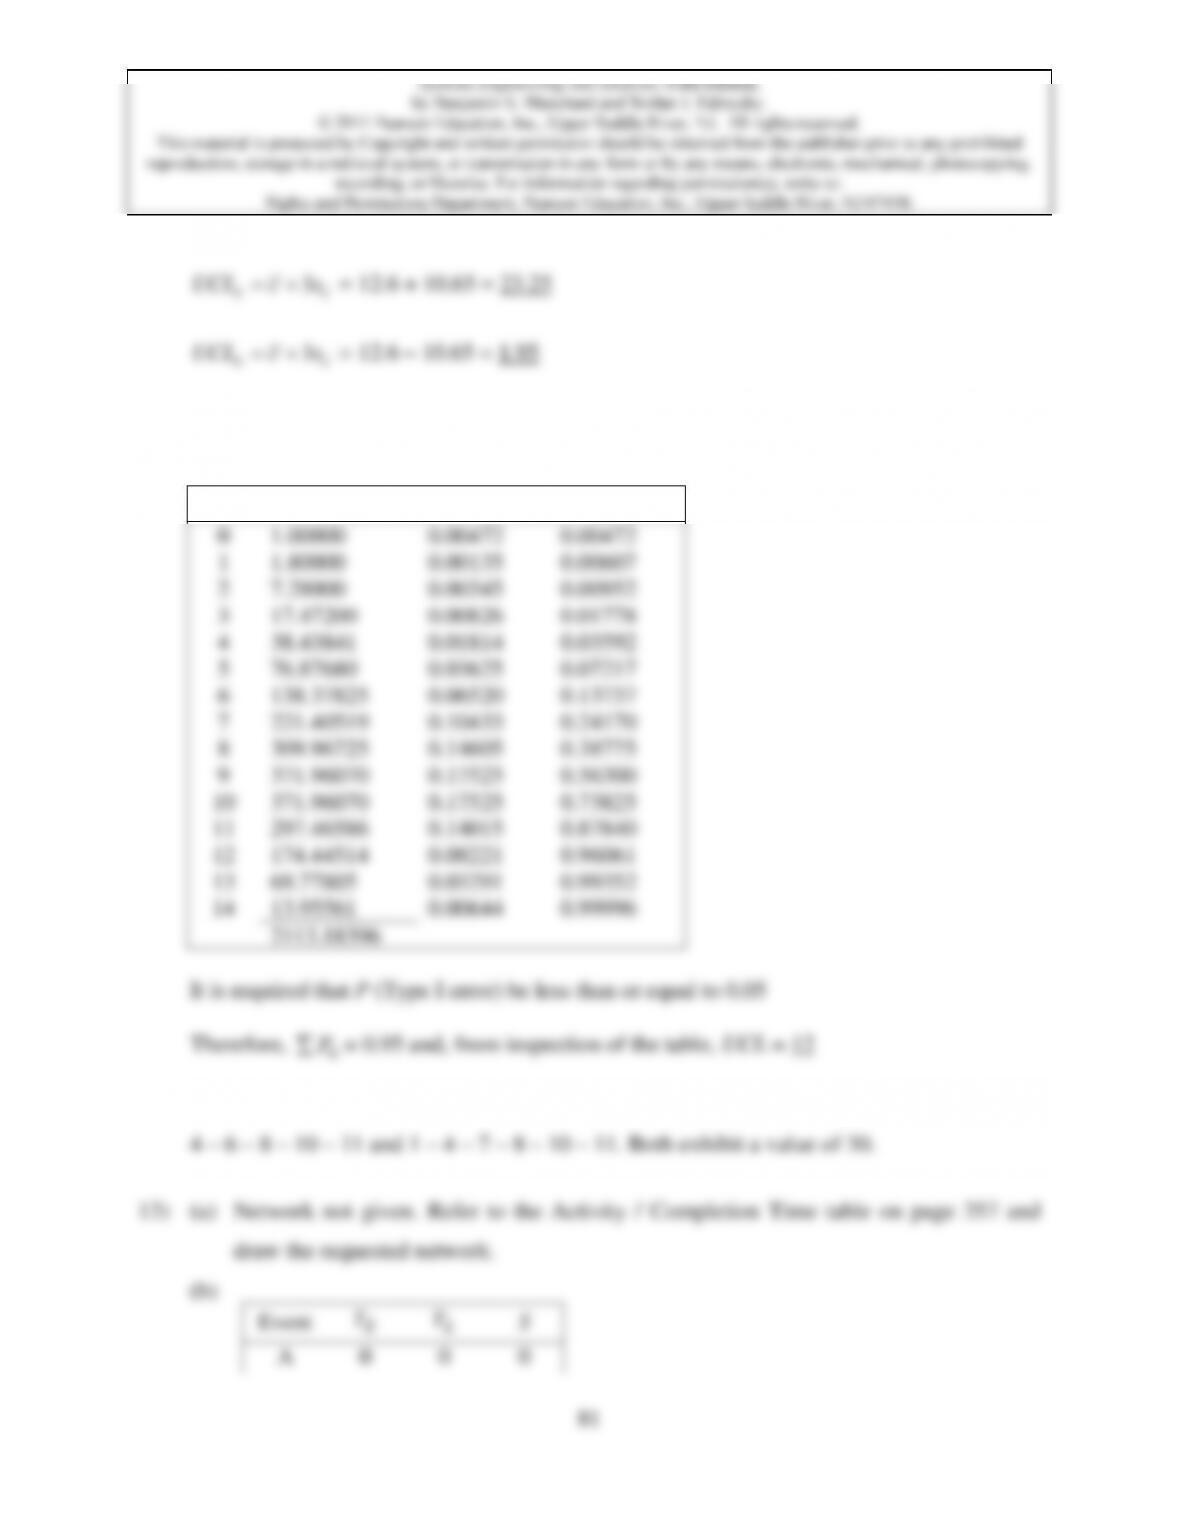
11) Proceed as in Table 11.6 on page 338.
n
/
no
PP
n
P
n
P
0
1.00000
0.00472
0.00472
1
1.80000
0.00135
0.00607
2
7.28000
0.00345
0.00952
3
17.47200
0.00826
0.01778
4
38.43841
0.01814
0.03592
5
76.87680
0.03625
0.07217
6
138.37825
0.06520
0.13737
7
221.40519
0.10433
0.24170
8
309.96725
0.14605
0.38775
9
371.96070
0.17525
0.56300
10
371.96070
0.17525
0.73825
11
297.46586
0.14015
0.87840
12
174.44514
0.08221
0.96061
13
69.77805
0.03291
0.99352
14
13.95561
0.00644
0.99996
2113.18396
It is required that P (Type I error) be less than or equal to 0.05
Therefore,
n
P
= 0.95 and, from inspection of the table, UCL = 12
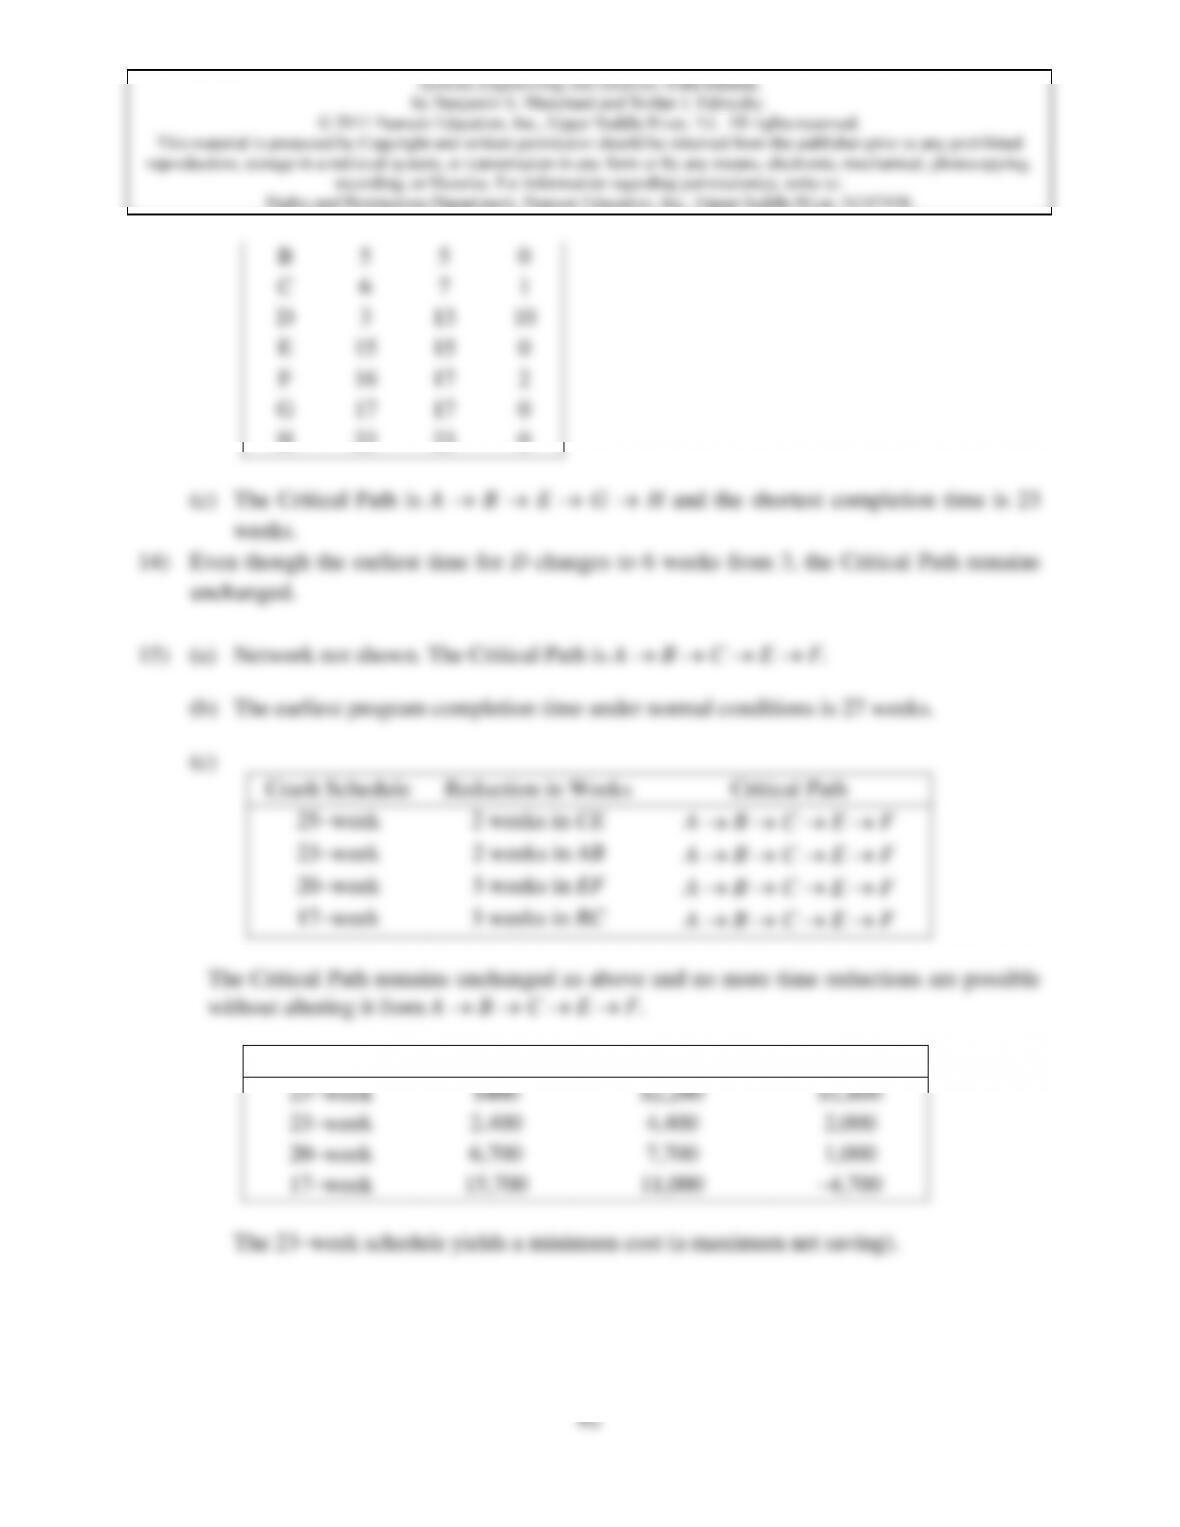
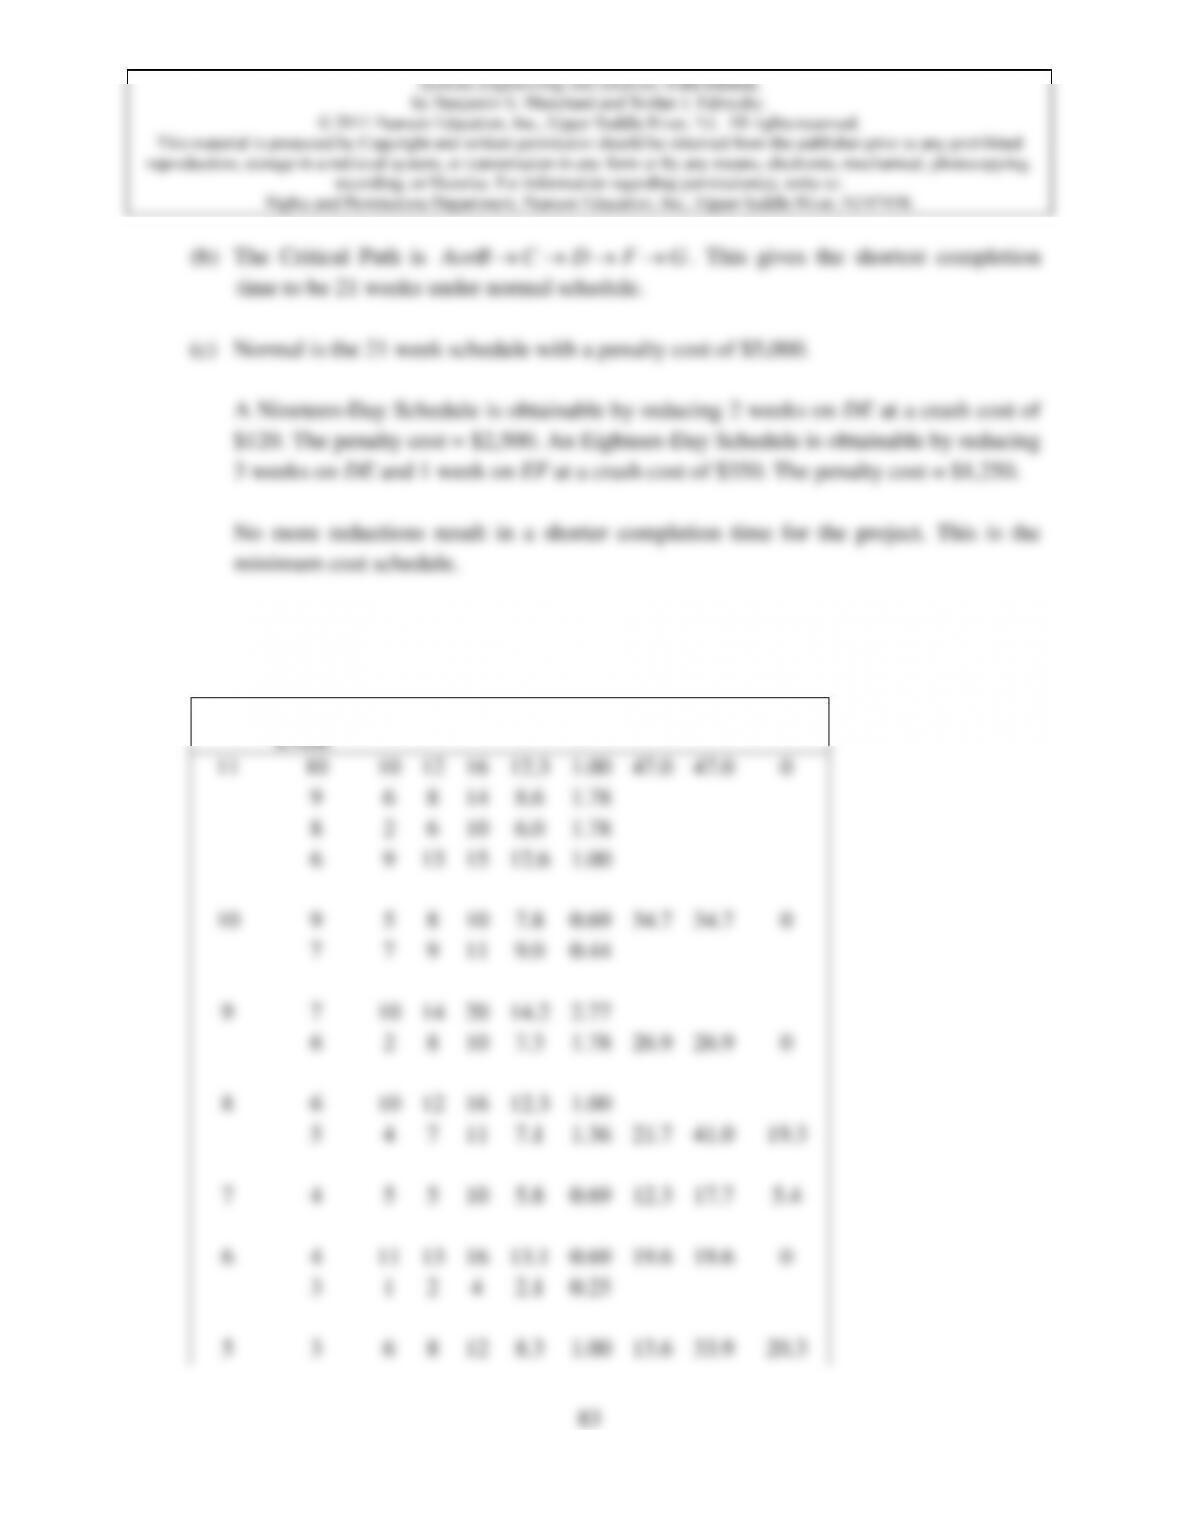
12) There are two Critical Paths in the network shown at the bottom of page 356. They are: 1 –
84
2
2
5
10
5.3
1.78
4
1
5
6
10
6.5
0.69
6.5
6.5
0
3
1
3
5
9
5.3
1.00
5.3
27.5
22.2
2
1
4
6
8
6.0
0.44
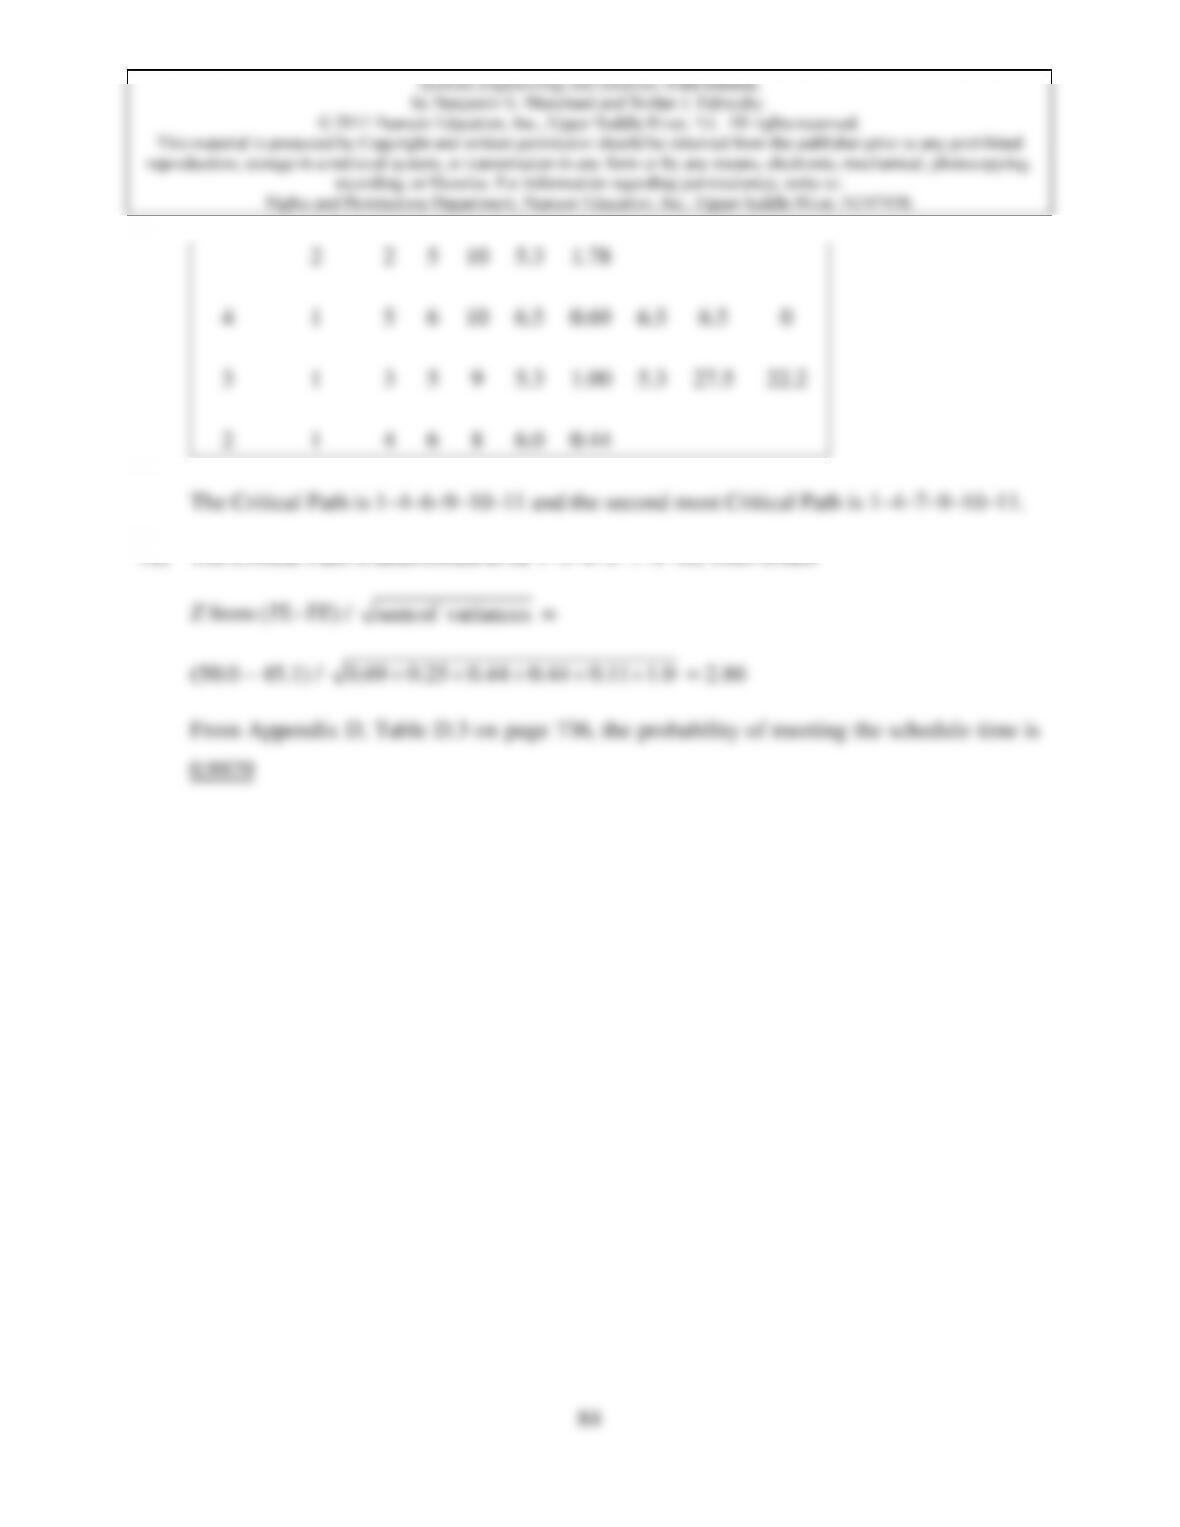
The Critical Path is 1–4–6–9–10–11 and the second most Critical Path is 1–4–7–9–10–11.
18) The Critical Path is determined to be 1–2–4–5–7–9–10, from which