9-30 (30–35 min.) Comparison of variable costing and absorption costing.
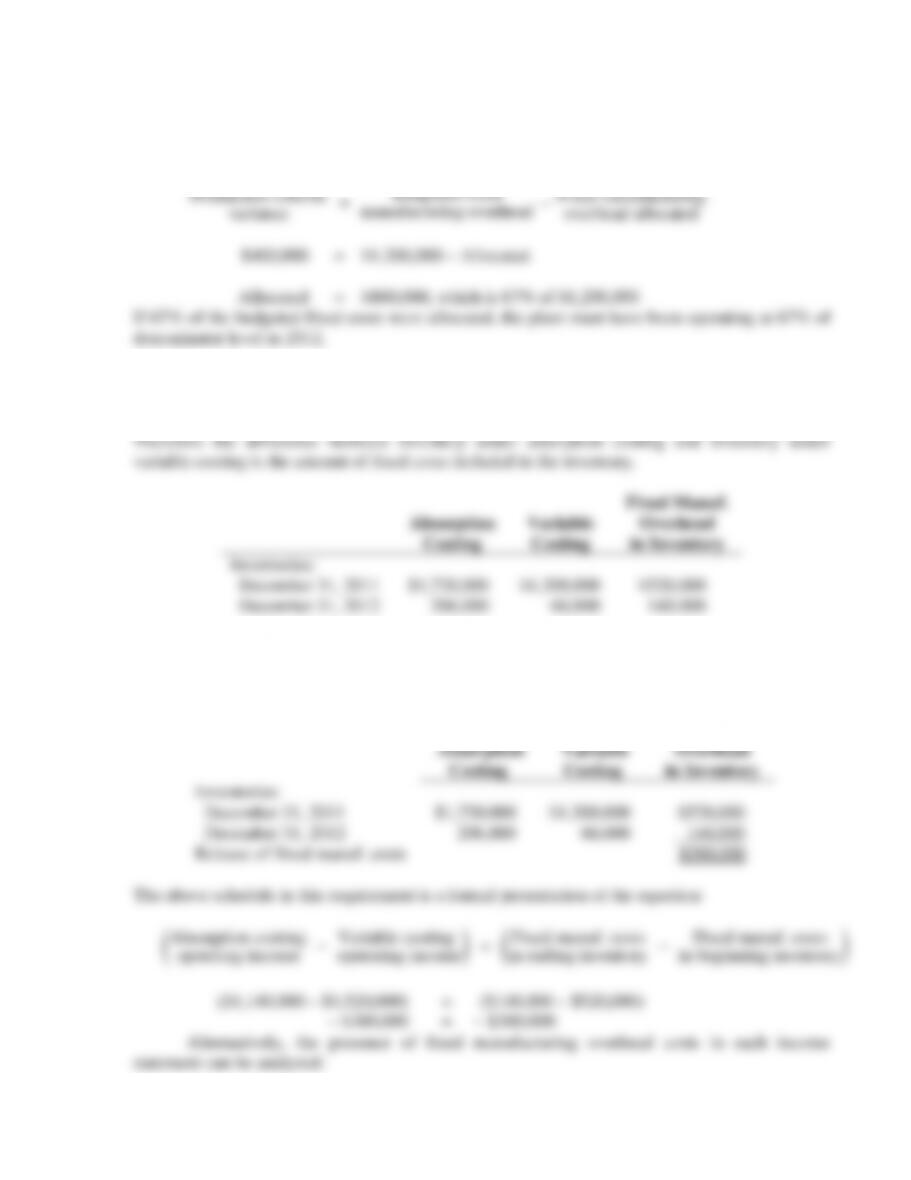
1. Since production volume variance is unfavorable, the budgeted fixed manufacturing
overhead must be larger than the fixed manufacturing overhead allocated.
Production-volume
variance
=
Budgeted fixed
manufacturing overhead
–
Fixed manufacturing
overhead allocated
$400,000 = $1,200,000 – Allocated
Allocated = $800,000, which is 67% of $1,200,000
If 67% of the budgeted fixed costs were allocated, the plant must have been operating at 67% of
denominator level in 2012.
2. The problem provides the beginning and ending inventory balances under both, variable
and absorption costing. Under variable costing, all fixed costs are written off as period costs, i.e.,
they are not inventoried. Under absorption costing, inventories include variable and fixed costs.
9-32
Absorption costing,
Fixed manuf. costs in cost of goods sold
($5,860,000 − $4,680,000)
$1,180,000
Production-volume variance
400,000
1,580,000
Variable costing, fixed manuf. costs charged to expense
(1,200,000)
Difference in operating income explained
$ 380,000
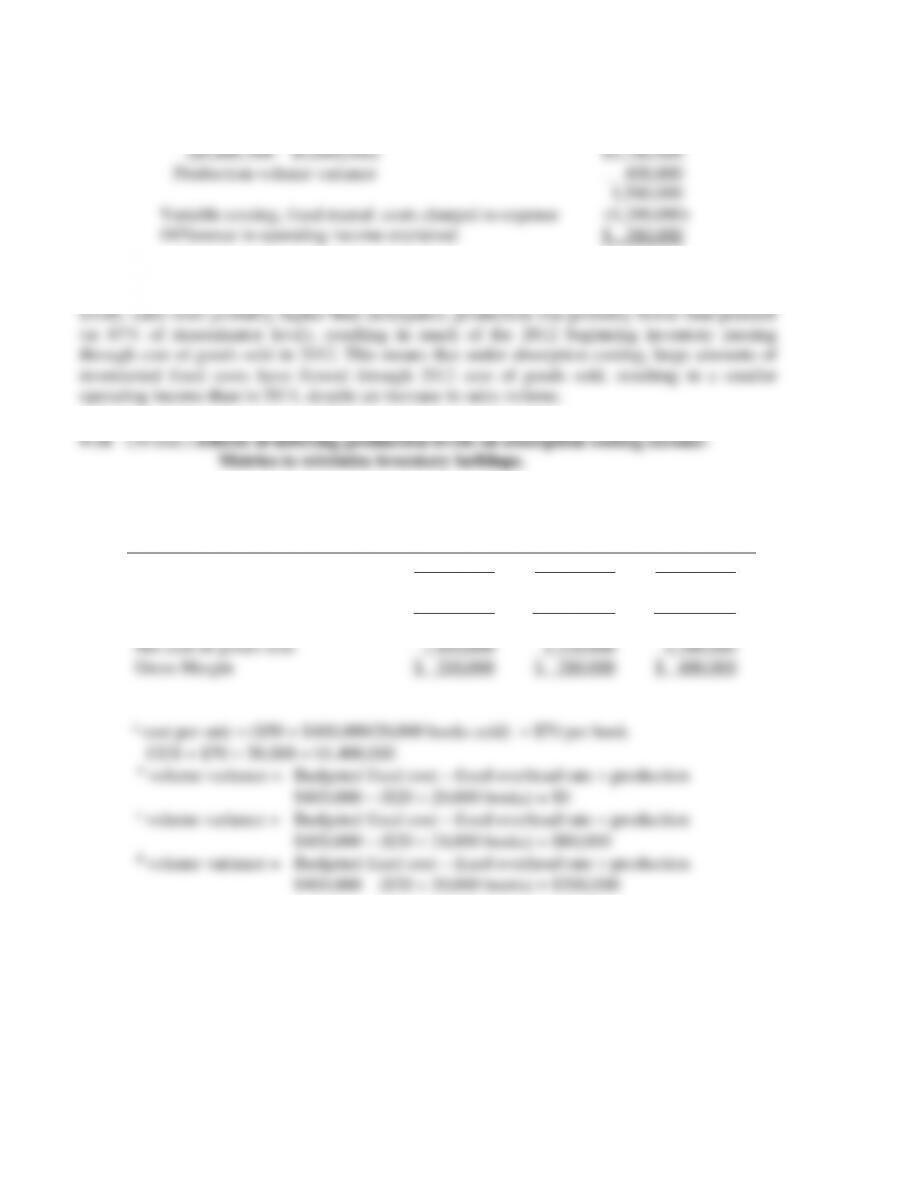
4. Under absorption costing, operating income is a function of both sales and production
(i.e., change in inventory levels). During 2012, Hinkle experienced a severe decline in inventory
1.
20,000
books
24,000
books
30,000
Books
Revenues
$1,600,000
$1,600,000
$1,600,000
Cost of goods sold
1,400,000a
1,400,000
1,400,000
Production volume —
*variance
0b
(80,000)c
(200,000)d
Net cost of goods sold
1,400,000
1,320,000
1,200,000
Gross Margin
$ 200,000
$ 280,000
$ 400,000
a cost per unit = ($50 + $400,000/20,000 books sold) = $70 per book
CGS = $70 20,000 = $1,400,000
b volume variance = Budgeted fixed cost – fixed overhead rate production
$400,000 – ($20 20,000 books) = $0
c volume variance = Budgeted fixed cost – fixed overhead rate production
$400,000 – ($20 24,000 books) = $80,000
d volume variance = Budgeted fixed cost – fixed overhead rate production
$400,000 – ($20 30,000 books) = $200,000
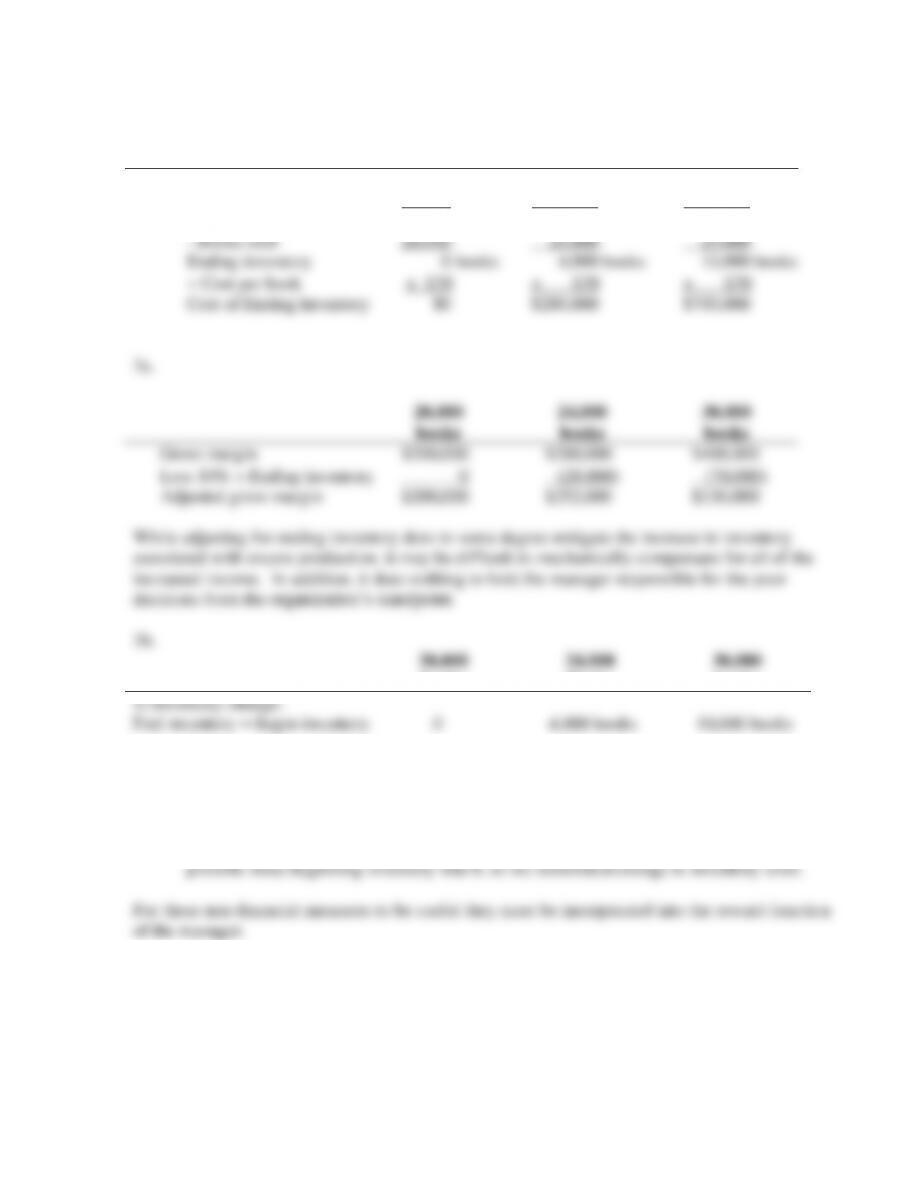
2.
20,000
Books
24,000
books
30,000
books
Beginning inventory 0 0 0
+ Production 20,000 books 24,000 books 30,000 books
20,000 24,000 30,000
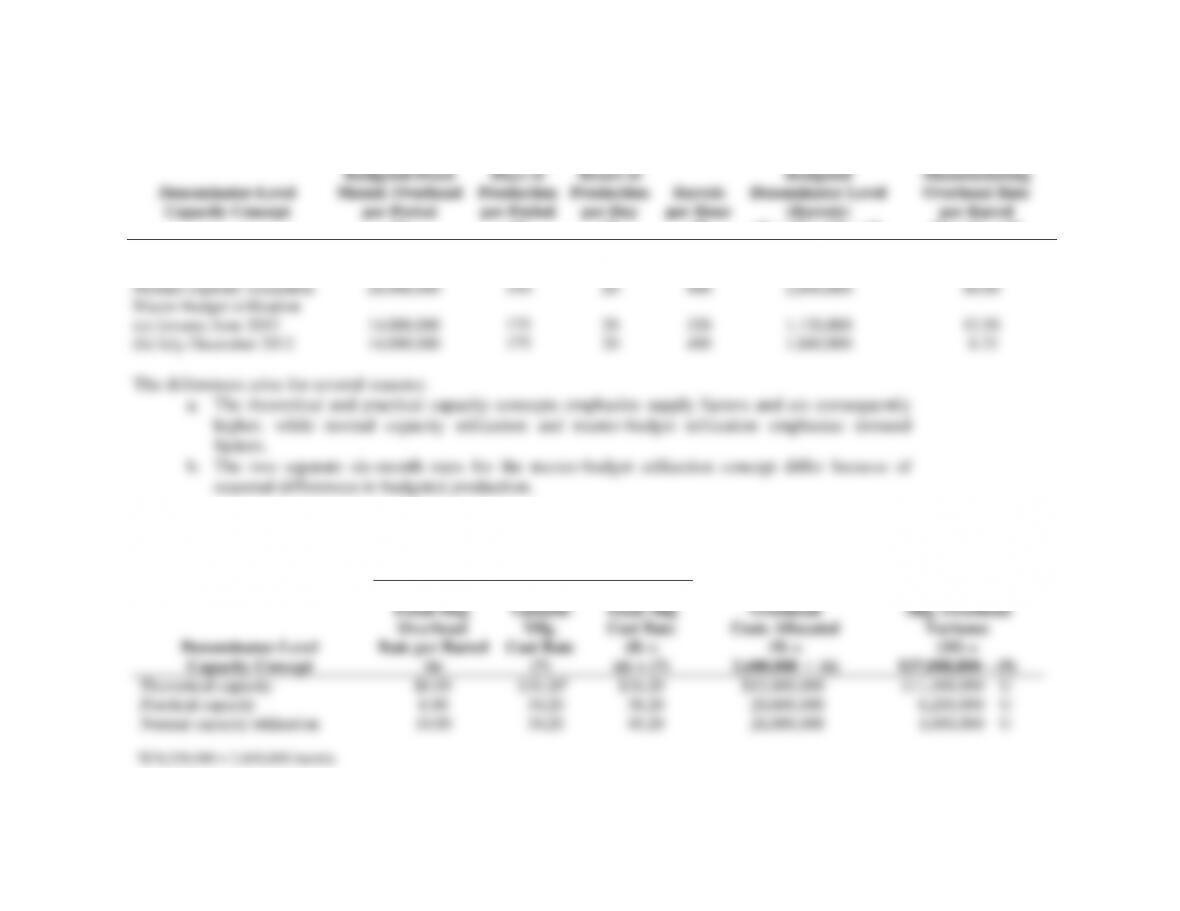
9-32 (25–30 min.) Alternative denominator-level capacity concepts, effect on operating income.
1.
Budgeted Fixed
Budgeted Fixed
Days of
Hours of
Budgeted
Manufacturing
Denominator-Level
Capacity Concept
Manuf. Overhead
per Period
Production
per Period
Production
per Day
Barrels
per Hour
Denominator Level
(Barrels)
Overhead Rate
per Barrel
(1)
(2)
(3)
(4)
(5) = (2)
(3)
(4)
(6) = (1)
(5)
Theoretical capacity
$28,000,000
360
24
540
4,665,600
$ 6.00
Practical capacity
28,000,000
350
20
500
3,500,000
8.00
Normal capacity utilization
28,000,000
350
20
400
2,800,000
10.00
Master-budget utilization
(a) January-June 2012
14,000,000
175
20
320
1,120,000
12.50
(b) July-December 2012
14,000,000
175
20
480
1,680,000
8.33
2. Using column (6) from above,
Per Barrel
Denominator-Level
Capacity Concept
Budgeted
Fixed Mfg.
Overhead
Rate per Barrel
(6)
Budgeted
Variable
Mfg.
Cost Rate
(7)
Budgeted
Total Mfg
Cost Rate
(8) =
(6) + (7)
Fixed Mfg.
Overhead
Costs Allocated
(9) =
2,600,000
(6)
Fixed
Mfg. Overhead
Variance
(10) =
$27,088,000 – (9)
Theoretical capacity
$6.00
$30.20a
$36.20
$15,600,000
$11,488,000
U
Practical capacity
8.00
30.20
38.20
20,800,000
6,288,000
U
Normal capacity utilization
10.00
30.20
40.20
26,000,000
1,088,000
U
a$78,520,000
2,600,000 barrels
9-35
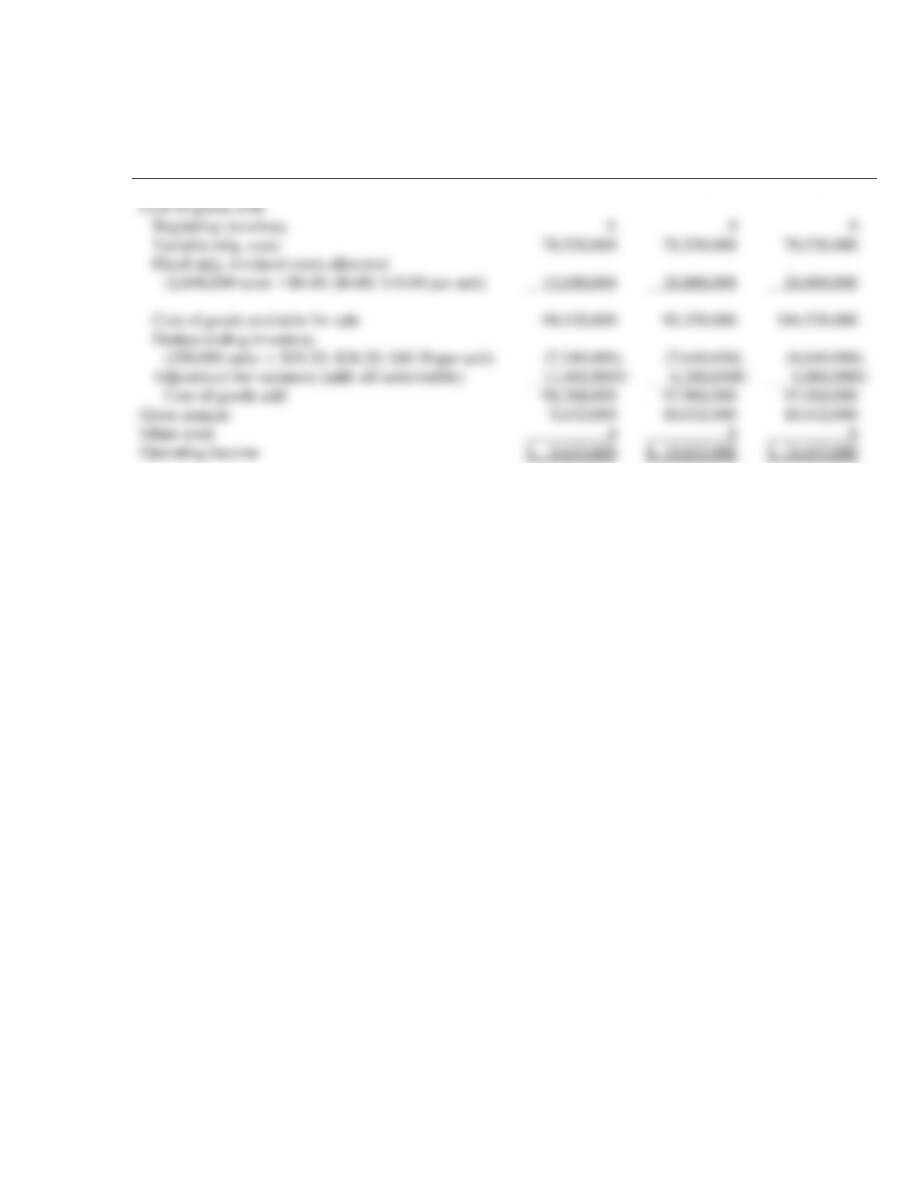
Absorption-Costing Income Statement
Theoretical
Capacity
Practical
Capacity
Normal
Capacity
Utilization
Revenues (2,400,000 bbls.
$45 per bbl.)
$108,000,000
$108,000,000
$108,000,000
Cost of goods sold
Beginning inventory
0
0
0
Variable mfg. costs
78,520,000
78,520,000
78,520,000
Fixed mfg. overhead costs allocated
(2,600,000 units
$6.00; $8.00; $10.00 per unit)
15,600,000
20,800,000
26,000,000
Cost of goods available for sale
94,120,000
99,320,000
104,520,000
Deduct ending inventory
(200,000 units
$36.20; $38.20; $40.20 per unit)
(7,240,000)
(7,640,000)
(8,040,000)
Adjustment for variances (add: all unfavorable)
11,488,000U
6,288,000U
1,088,000U
Cost of goods sold
98,368,000
97,968,000
97,568,000
Gross margin
9,632,000
10,032,000
10,432,000
Other costs
0
0
0
Operating income
$ 9,632,000
$ 10,032,000
$ 10,432,000
9-36
9-33 (20 min.) Motivational considerations in denominator-level capacity selection
(continuation of 9-32).
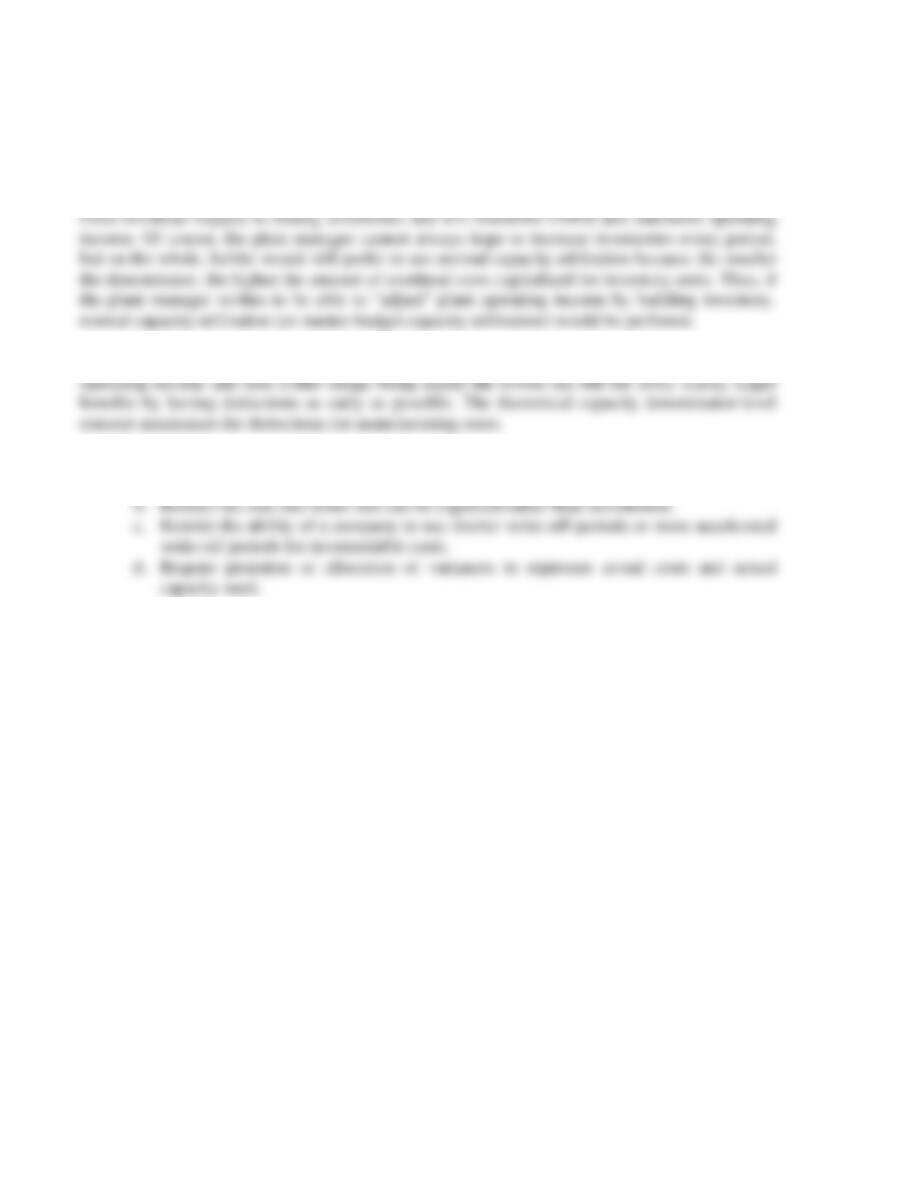
1. If the plant manager gets a bonus based on operating income, he/she will prefer the
denominator-level capacity to be based on normal capacity utilization (or master-budget
utilization). In times of rising inventories, as in 2012, this denominator level will maximize the
2. Given the data in this question, the theoretical capacity concept reports the lowest
3. The IRS may restrict the flexibility of a company in several ways:
a. Restrict the denominator-level concept choice (to say, practical capacity).
9-37
9-34 (25 min.) Denominator-level choices, changes in inventory levels, effect on
operating income.
1.
Normal
Theoretical
Practical
Capacity
Capacity
Capacity
Utilization
Denominator level in units
280,000
224,000
200,000
Budgeted fixed manuf. costs
$2,800,000
$2,800,000
$2,800,000
Budgeted fixed manuf. cost allocated per unit
$ 10.00
$ 12.50
$ 14.00
Production in units
220,000
220,000
220,000
Allocated fixed manuf. costs (production in units
budgeted fixed manuf. cost allocated per unit)
$2,200,000
$2,750,000
$3,080,000
Production volume variance (Budgeted fixed manuf.
costs – allocated fixed manuf. costs)a
$ 600,000
U
$ 50,000
U
$ 280,000
F
2.
Normal
Theoretical
Practical
Capacity
Capacity
Capacity
Utilization
Units sold
230,000
230,000
230,000
Budgeted fixed mfg. cost allocated per unit
$10.00
$12.50
$14.00
Budgeted var. mfg. cost per unit
$ 5.00
$ 5.00
$ 5.00
Budgeted cost per unit of inventory or production
$15.00
$17.50
$19.00
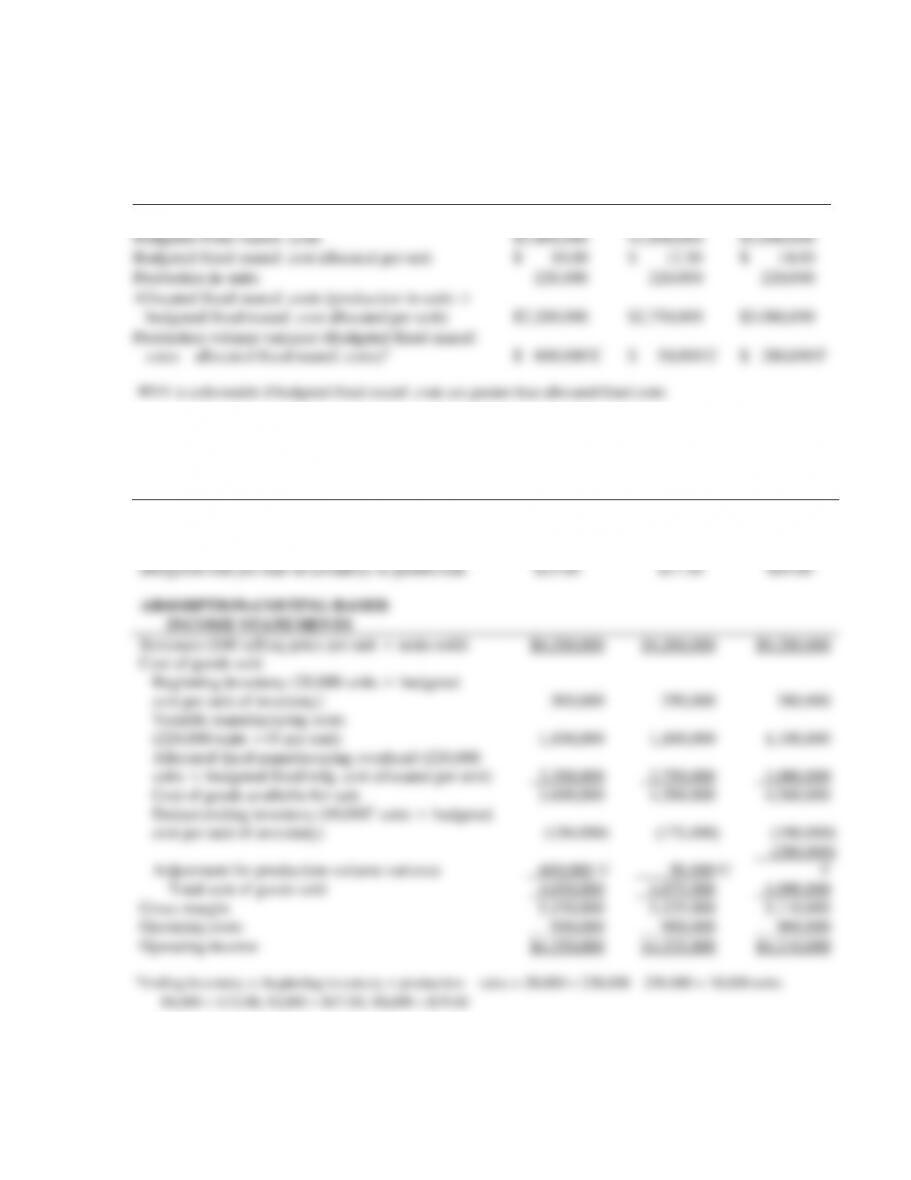
ABSORPTION-COSTING BASED
INCOME STATEMENTS
Revenues ($40 selling price per unit
units sold)
$9,200,000
$9,200,000
$9,200,000
Cost of goods sold
Beginning inventory (20,000 units
budgeted
cost per unit of inventory)
300,000
350,000
380,000
Variable manufacturing costs
(220,000 units
$5 per unit)
1,100,000
1,100,000
1,100,000
Allocated fixed manufacturing overhead (220,000
units
budgeted fixed mfg. cost allocated per unit)
2,200,000
2,750,000
3,080,000
Cost of goods available for sale
3,600,000
4,200,000
4,560,000
Deduct ending inventory (10,000b units
budgeted
cost per unit of inventory)
(150,000)
(175,000)
(190,000)
Adjustment for production-volume variance
600,000 U
50,000 U
(280,000)
F
Total cost of goods sold
4,050,000
4,075,000
4,090,000
Gross margin
5,150,000
5,125,000
5,110,000
Operating costs
900,000
900,000
900,000
Operating income
$4,250,000
$4,225,000
$4,210,000
9-38
3. Koshu’s 2011 beginning inventory was 20,000 units; its ending inventory was 10,000
units. So, during 2011, there was a drop of 10,000 units in inventory levels (matching the 10,000
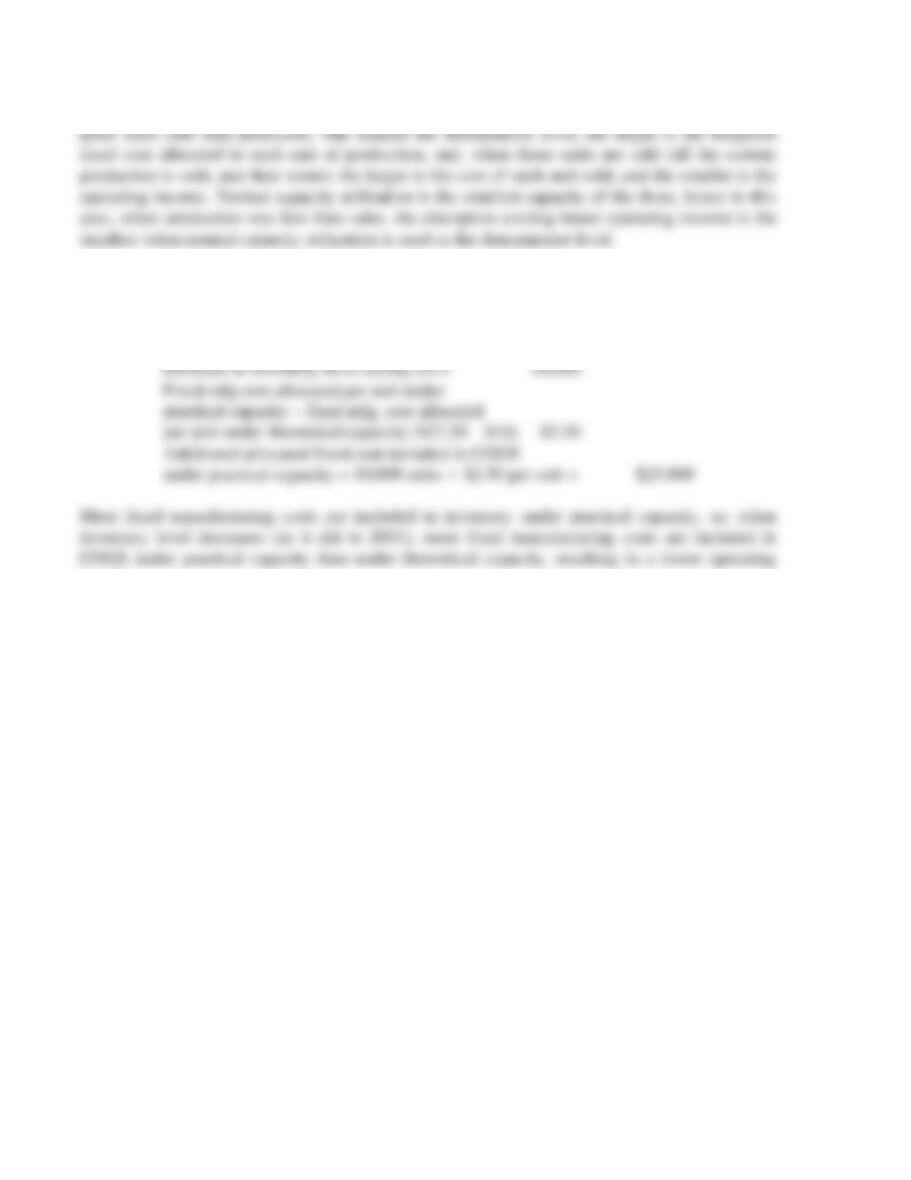
4.
Reconciliation
Theoretical Capacity Operating Income –
Practical Capacity Operating Income
$25,000
Decrease in inventory level during 2011
10,000
Fixed mfg cost allocated per unit under
practical capacity – fixed mfg. cost allocated
per unit under theoretical capacity ($12.50 – $10)
$2.50
Additional allocated fixed cost included in COGS
under practical capacity = 10,000 units
$2.50 per unit =
$25,000
income.
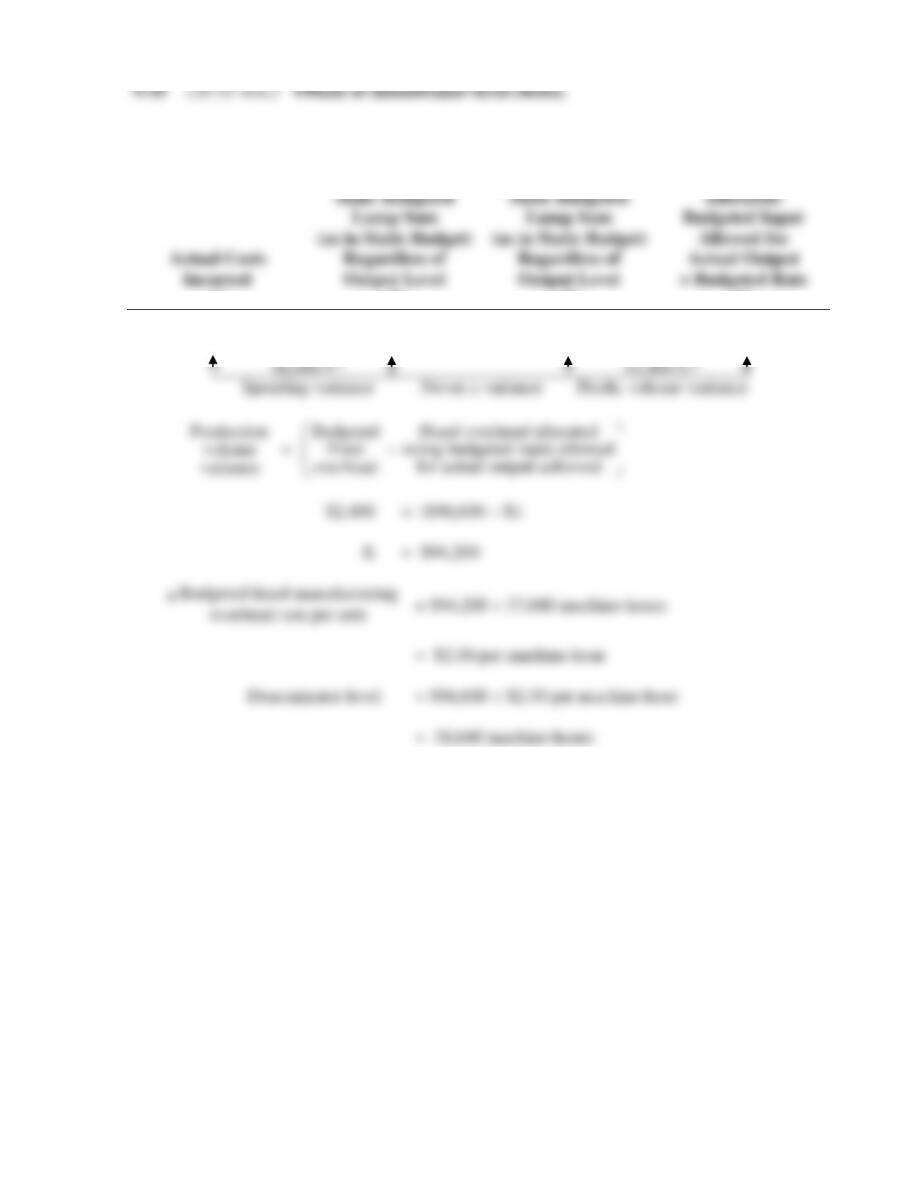
1. Normal capacity utilization. Givens denoted*
Actual Costs
Incurred
(1)
Same Budgeted
Lump Sum
(as in Static Budget)
Regardless of
Output Level
(2)
Flexible Budget:
Same Budgeted
Lump Sum
(as in Static Budget)
Regardless of
Output Level
(3)
Allocated:
Budgeted Input
Allowed for
Actual Output
× Budgeted Rate
(4)
$90,600
$96,600*
$96,600*
37,680 hrs.* × $2.50a
= $94,200
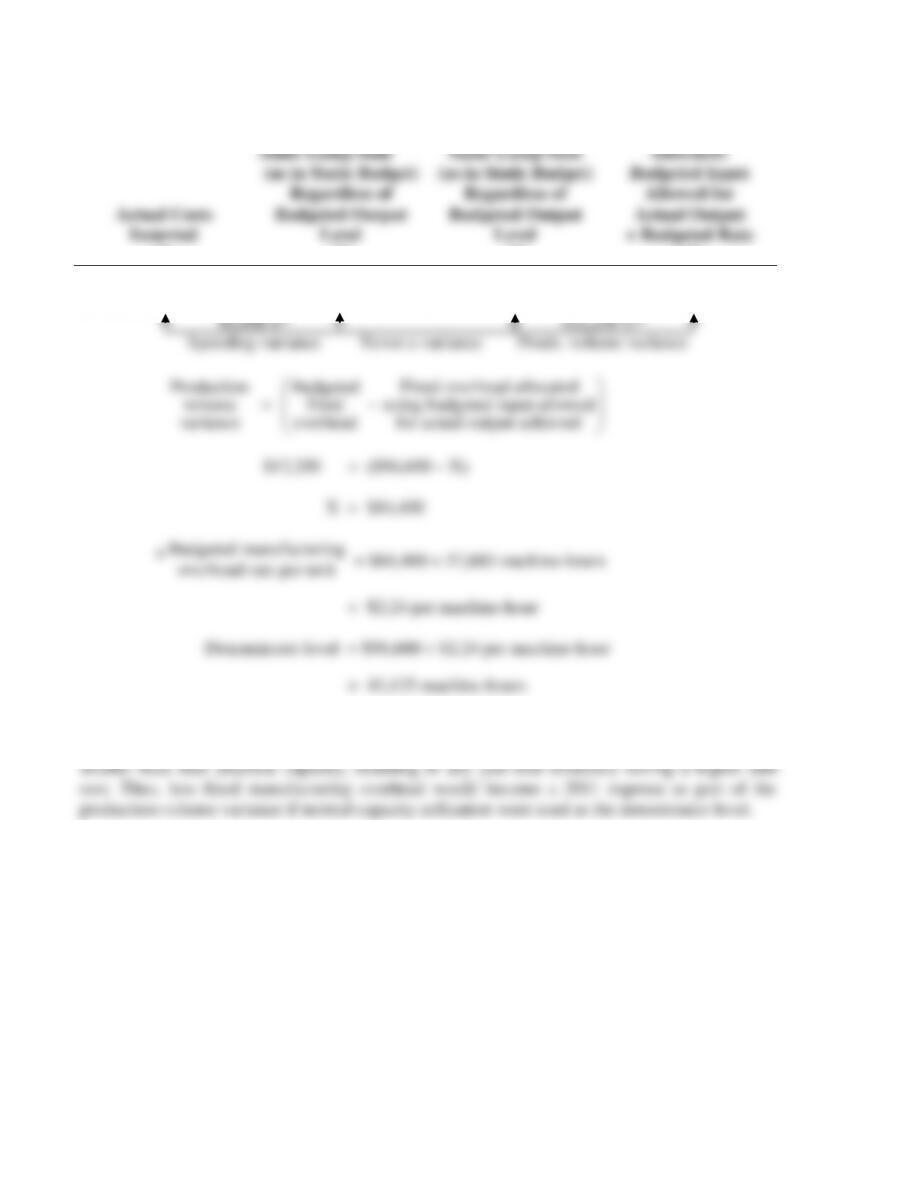
2. Practical capacity. Givens denoted*
Actual Costs
Incurred
(1)
Same Lump Sum
(as in Static Budget)
Regardless of
Budgeted Output
Level
(2)
Flexible Budget:
Same Lump Sum
(as in Static Budget)
Regardless of
Budgeted Output
Level
(3)
Allocated:
Budgeted Input
Allowed for
Actual Output
× Budgeted Rate
(4)
$90,600
$96,600*
$96,600*
37,680* × $2.24a
= $84,400
3. To maximize operating income, the executive vice president would favor using normal
capacity utilization rather than practical capacity. Why? Because normal capacity utilization is a