9-11
1.
Beginning Inventory + 2012 Production = 2012 Sales + Ending Inventory
85,000 units + 2012 Production = 345,400 units + 34,500 units
2012 Production = 294,900 units
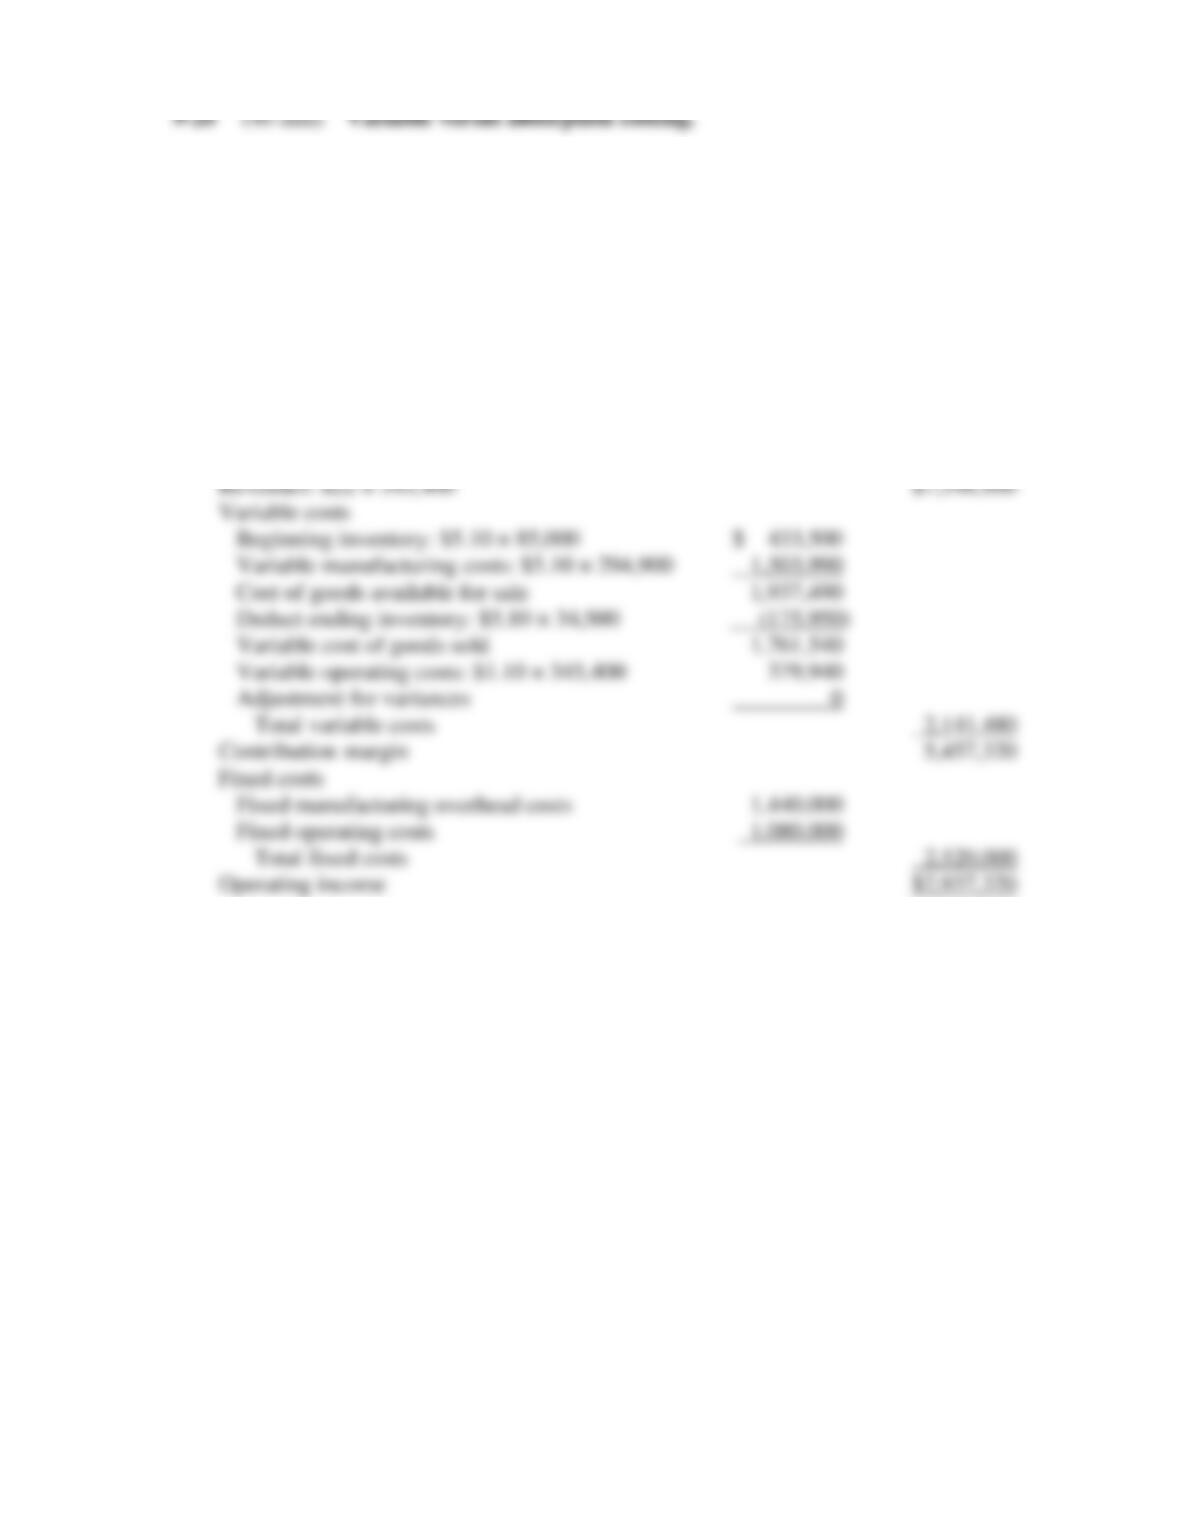
Income Statement for the Zwatch Company, Variable Costing
for the Year Ended December 31, 2012
Revenues: $22 × 345,400
$7,598,800
Variable costs
Beginning inventory: $5.10 × 85,000
$ 433,500
Variable manufacturing costs: $5.10 × 294,900
1,503,990
Cost of goods available for sale
1,937,490
Deduct ending inventory: $5.10 × 34,500
(175,950)
Variable cost of goods sold
1,761,540
Variable operating costs: $1.10 × 345,400
379,940
Adjustment for variances
0
Total variable costs
2,141,480
Contribution margin
5,457,320
Fixed costs
Fixed manufacturing overhead costs
1,440,000
Fixed operating costs
1,080,000
Total fixed costs
2,520,000
Operating income
$2,937,320
9-12
Absorption Costing Data
Fixed manufacturing overhead allocation rate =
Fixed manufacturing overhead/Denominator level machine-hours = $1,440,000
6,000
= $240 per machine-hour
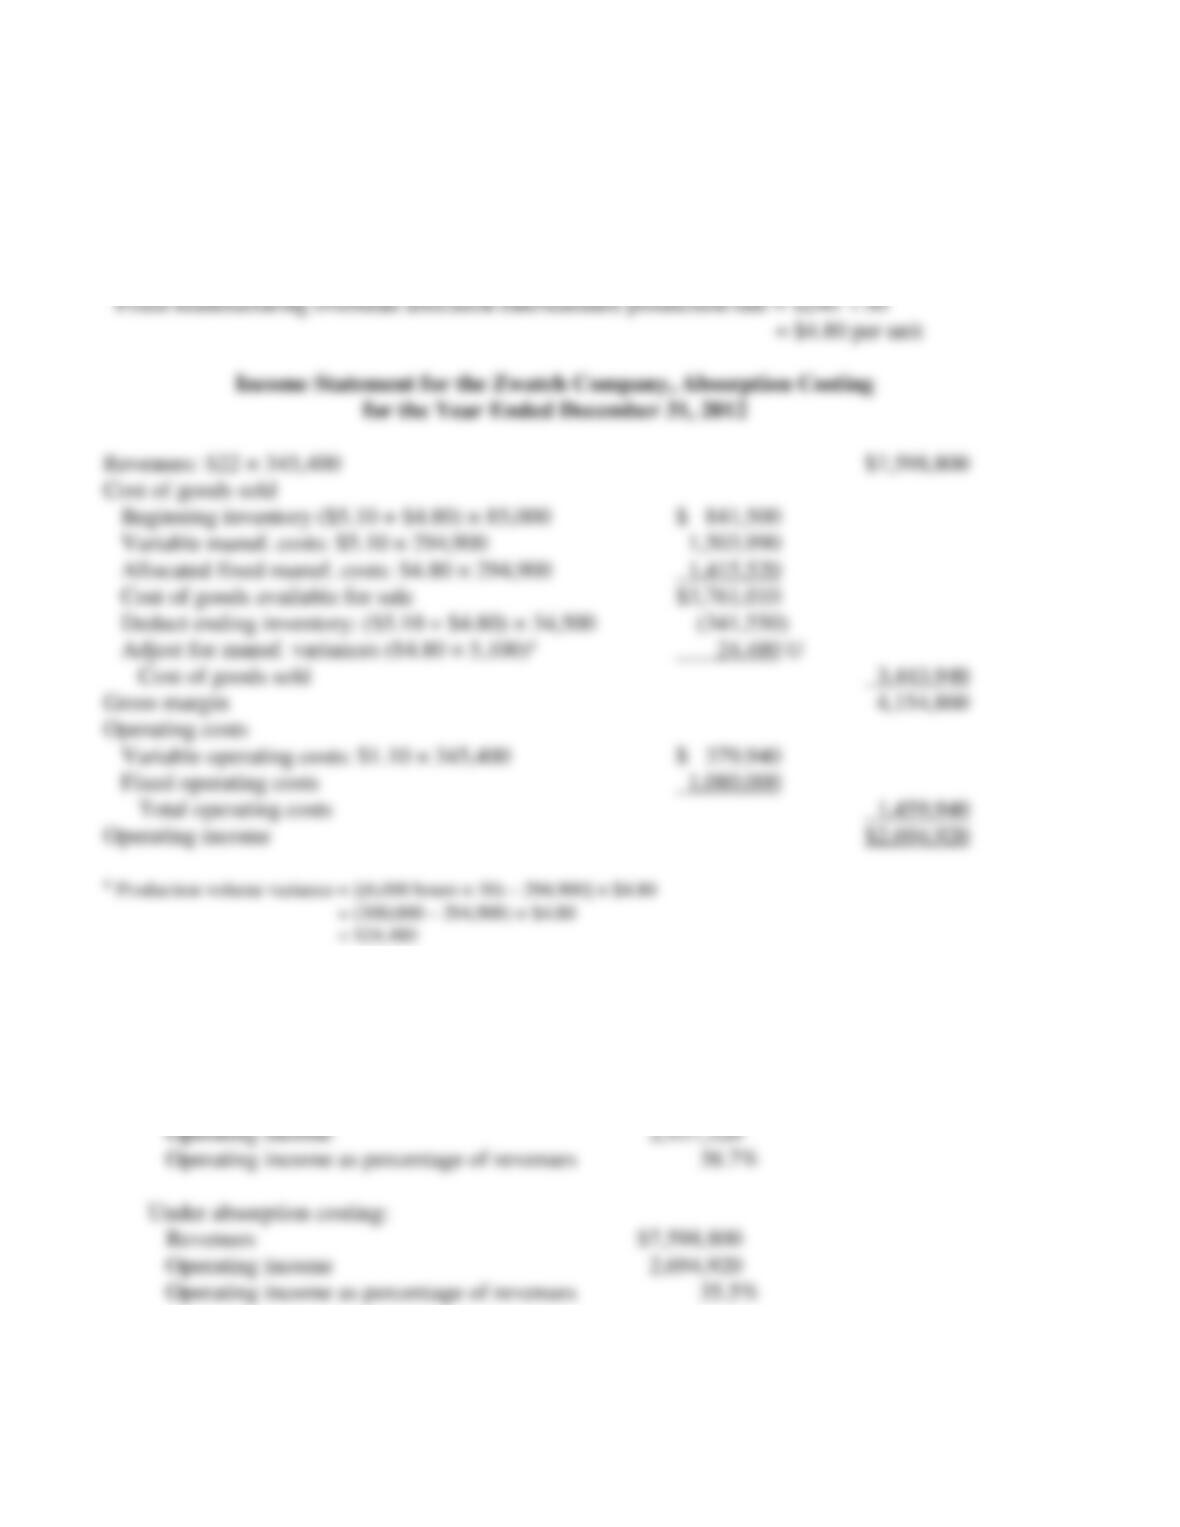
Fixed manufacturing overhead allocation rate per unit =
Revenues: $22 × 345,400
$7,598,800
Cost of goods sold
Beginning inventory ($5.10 + $4.80) × 85,000
$ 841,500
Variable manuf. costs: $5.10 × 294,900
1,503,990
Allocated fixed manuf. costs: $4.80 × 294,900
1,415,520
Cost of goods available for sale
$3,761,010
Deduct ending inventory: ($5.10 + $4.80) × 34,500
(341,550)
Adjust for manuf. variances ($4.80 × 5,100)a
24,480 U
Cost of goods sold
3,443,940
Gross margin
4,154,860
Operating costs
Variable operating costs: $1.10 × 345,400
$ 379,940
Fixed operating costs
1,080,000
Total operating costs
1,459,940
Operating income
$2,694,920
a Production volume variance = [(6,000 hours × 50) – 294,900] × $4.80
= (300,000 – 294,900) × $4.80
= $24,480
2. Zwatch’s operating margins as a percentage of revenues are
Under variable costing:
Revenues
$7,598,800
Operating income
2,937,320
Operating income as percentage of revenues
38.7%
Under absorption costing:
Revenues
$7,598,800
Operating income
2,694,920
Operating income as percentage of revenues
35.5%
9-13
3. Operating income using variable costing is about 9% higher than operating income calculated
using absorption costing.
4. The factors the CFO should consider include
(a) Effect on managerial behavior.
(b) Effect on external users of financial statements.
9-21 (10 min.) Absorption and variable costing.
The answers are 1(a) and 2(c). Computations:
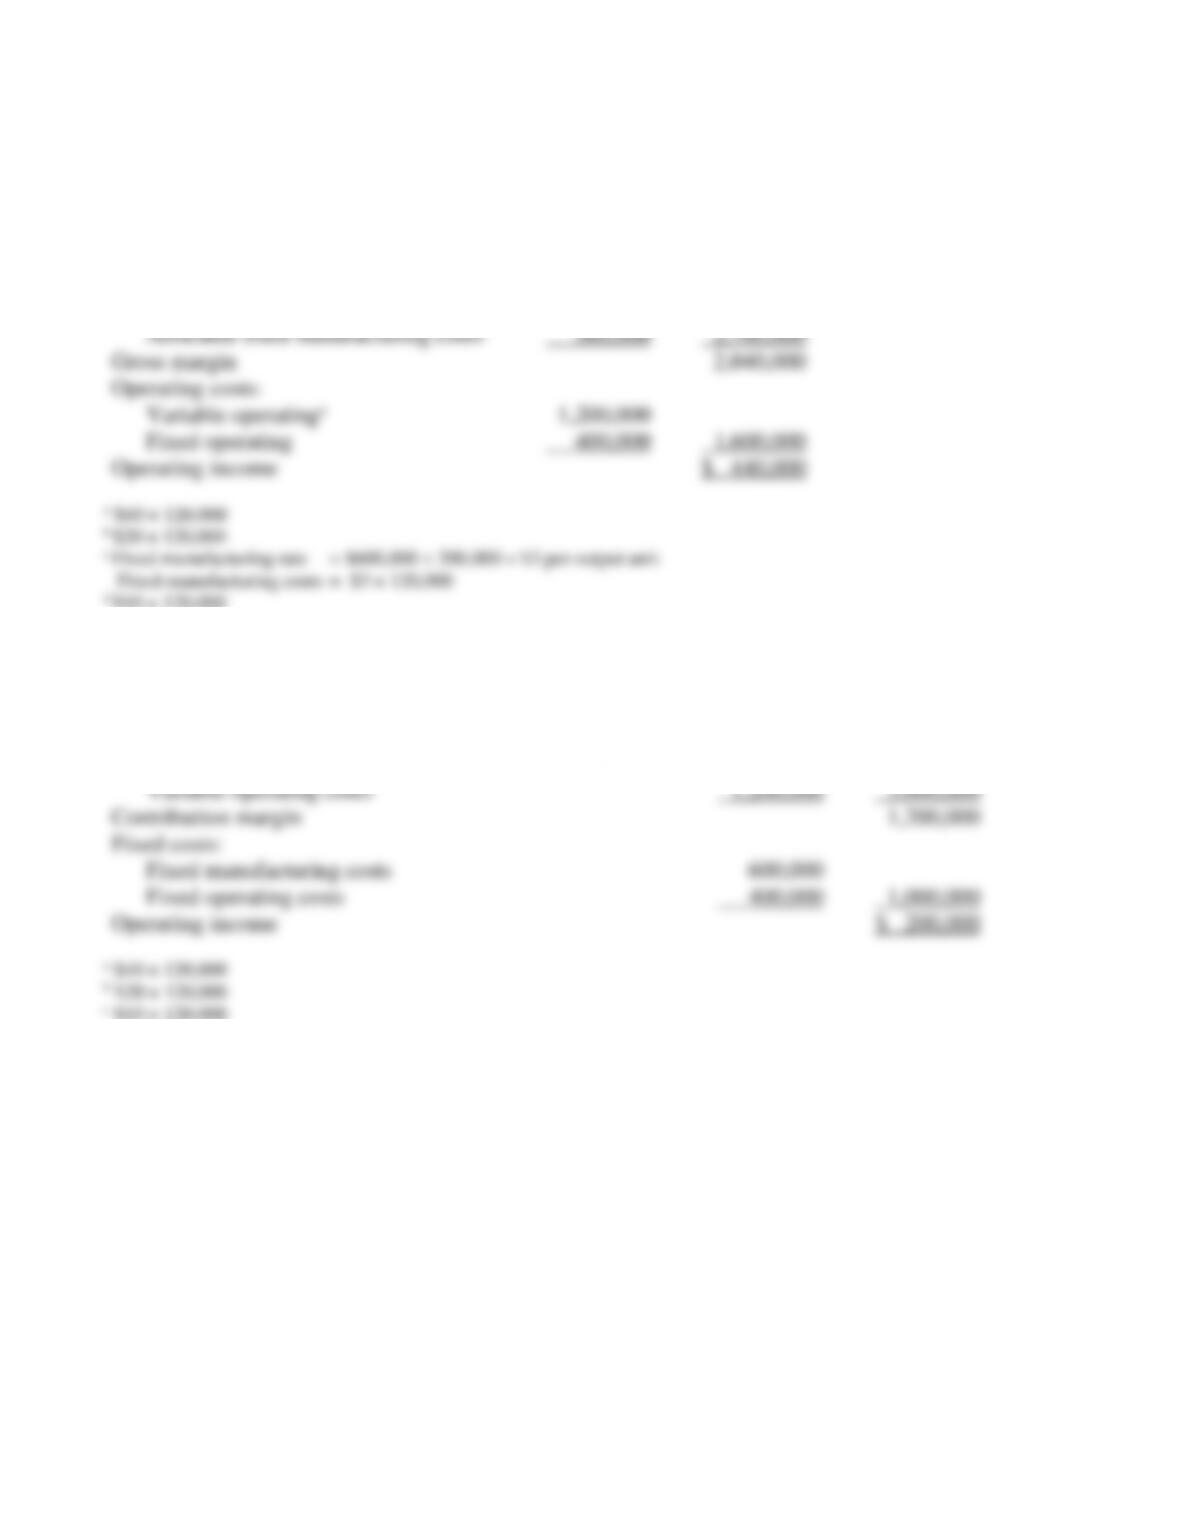
1. Absorption Costing:
Revenuesa
Cost of goods sold:
Variable manufacturing costsb
Allocated fixed manufacturing costsc
Gross margin
$2,400,000
360,000
$4,800,000
2,760,000
2,040,000
Operating costs:
Variable operatingd
Fixed operating
Operating income
1,200,000
400,000
1,600,000
$ 440,000
a $40 × 120,000
b $20 × 120,000
c Fixed manufacturing rate = $600,000 ÷ 200,000 = $3 per output unit
Fixed manufacturing costs = $3 × 120,000
d $10 × 120,000
2. Variable Costing:
Revenuesa
Variable costs:
Variable manufacturing cost of goods soldb
Variable operating costsc
Contribution margin
Fixed costs:
Fixed manufacturing costs
Fixed operating costs
Operating income
$2,400,000
1,200,000
600,000
400,000
$4,800,000
3,600,000
1,200,000
1,000,000
$ 200,000
a $40 × 120,000
b $20 × 120,000
c $10 × 120,000
9-15
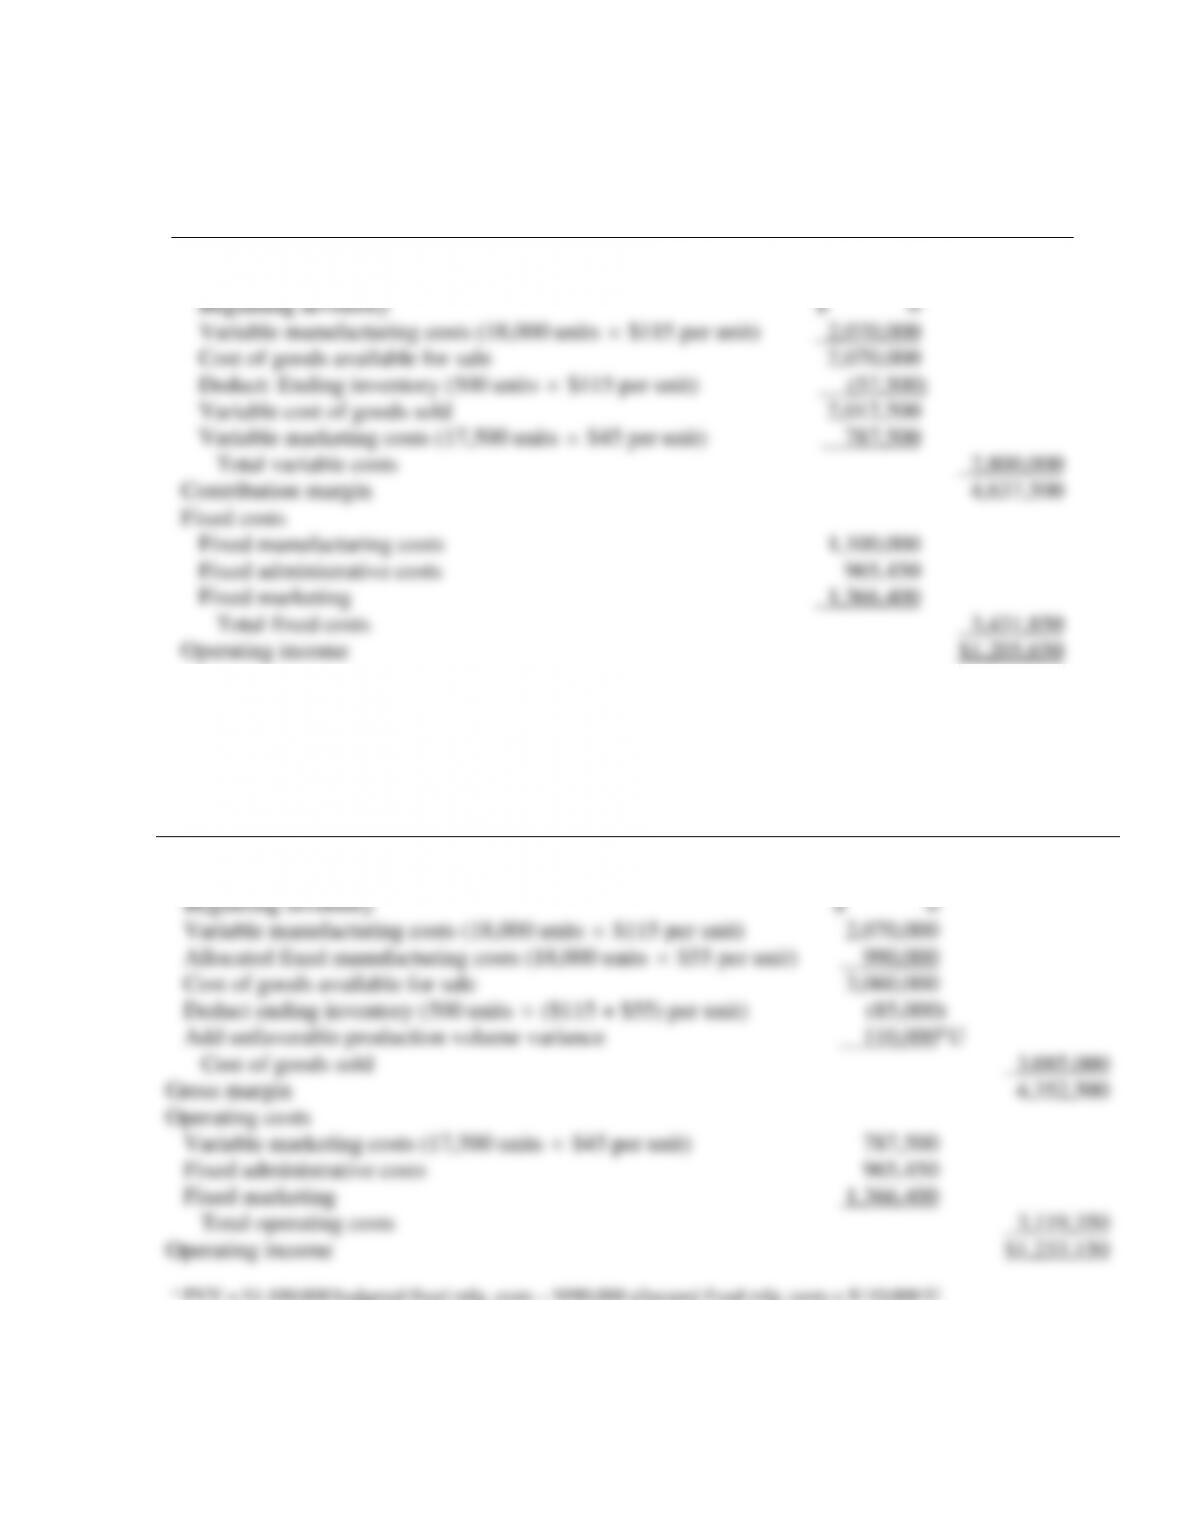
9-22 (40 min) Absorption versus variable costing.
1. The variable manufacturing cost per unit is $30 + $25 + $60 = $115.
2011 Variable-Costing Based Income Statement
Revenues (17,500
$425 per unit)
$7,437,500
Variable costs
Beginning inventory
$ 0
Variable manufacturing costs (18,000 units
$115 per unit)
2,070,000
Cost of goods available for sale
2,070,000
Deduct: Ending inventory (500 units
$115 per unit)
(57,500)
Variable cost of goods sold
2,012,500
Variable marketing costs (17,500 units
$45 per unit)
787,500
Total variable costs
2,800,000
Contribution margin
4,637,500
Fixed costs
Fixed manufacturing costs
1,100,000
Fixed administrative costs
965,450
Fixed marketing
1,366,400
Total fixed costs
3,431,850
Operating income
$1,205,650
2. Fixed manufacturing overhead rate = $1,100,000 / 20,000 units = $55 per unit
2011 Absorption-Costing Based Income Statement
Revenues (17,500 units
$425 per unit)
$7,437,500
Cost of goods sold
Beginning inventory
$ 0
Variable manufacturing costs (18,000 units
$115 per unit)
2,070,000
Allocated fixed manufacturing costs (18,000 units
$55 per unit)
990,000
Cost of goods available for sale
3,060,000
Deduct ending inventory (500 units
($115 + $55) per unit)
(85,000)
Add unfavorable production volume variance
110,000a U
Cost of goods sold
3,085,000
Gross margin
4,352,500
Operating costs
Variable marketing costs (17,500 units
$45 per unit)
787,500
Fixed administrative costs
965,450
Fixed marketing
1,366,400
Total operating costs
3,119,350
Operating income
$1,233,150
a PVV = $1,100,000 budgeted fixed mfg. costs – $990,000 allocated fixed mfg. costs = $110,000 U
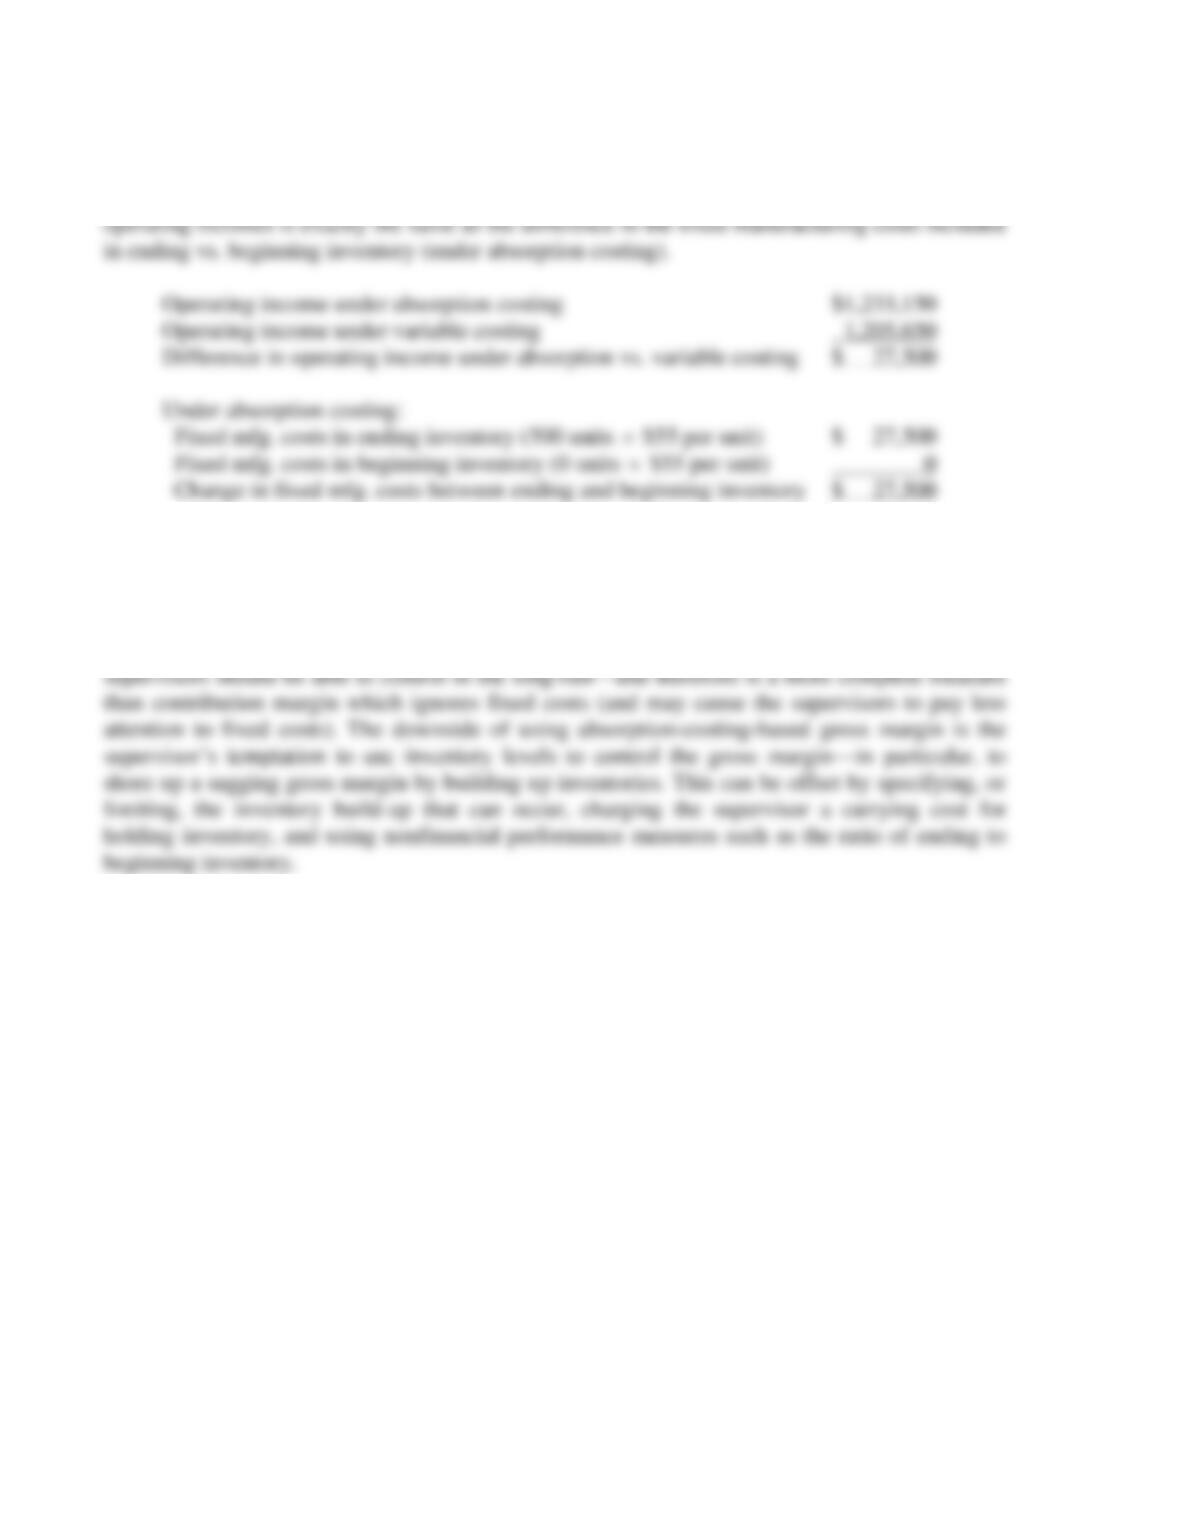
3. 2011 operating income under absorption costing is greater than the operating income
under variable costing because in 2011 inventories increased by 500 units. As a result, under
absorption costing, a portion of the fixed overhead remained in the ending inventory, and led to a
lower cost of goods sold (relative to variable costing). As shown below, the difference in the two
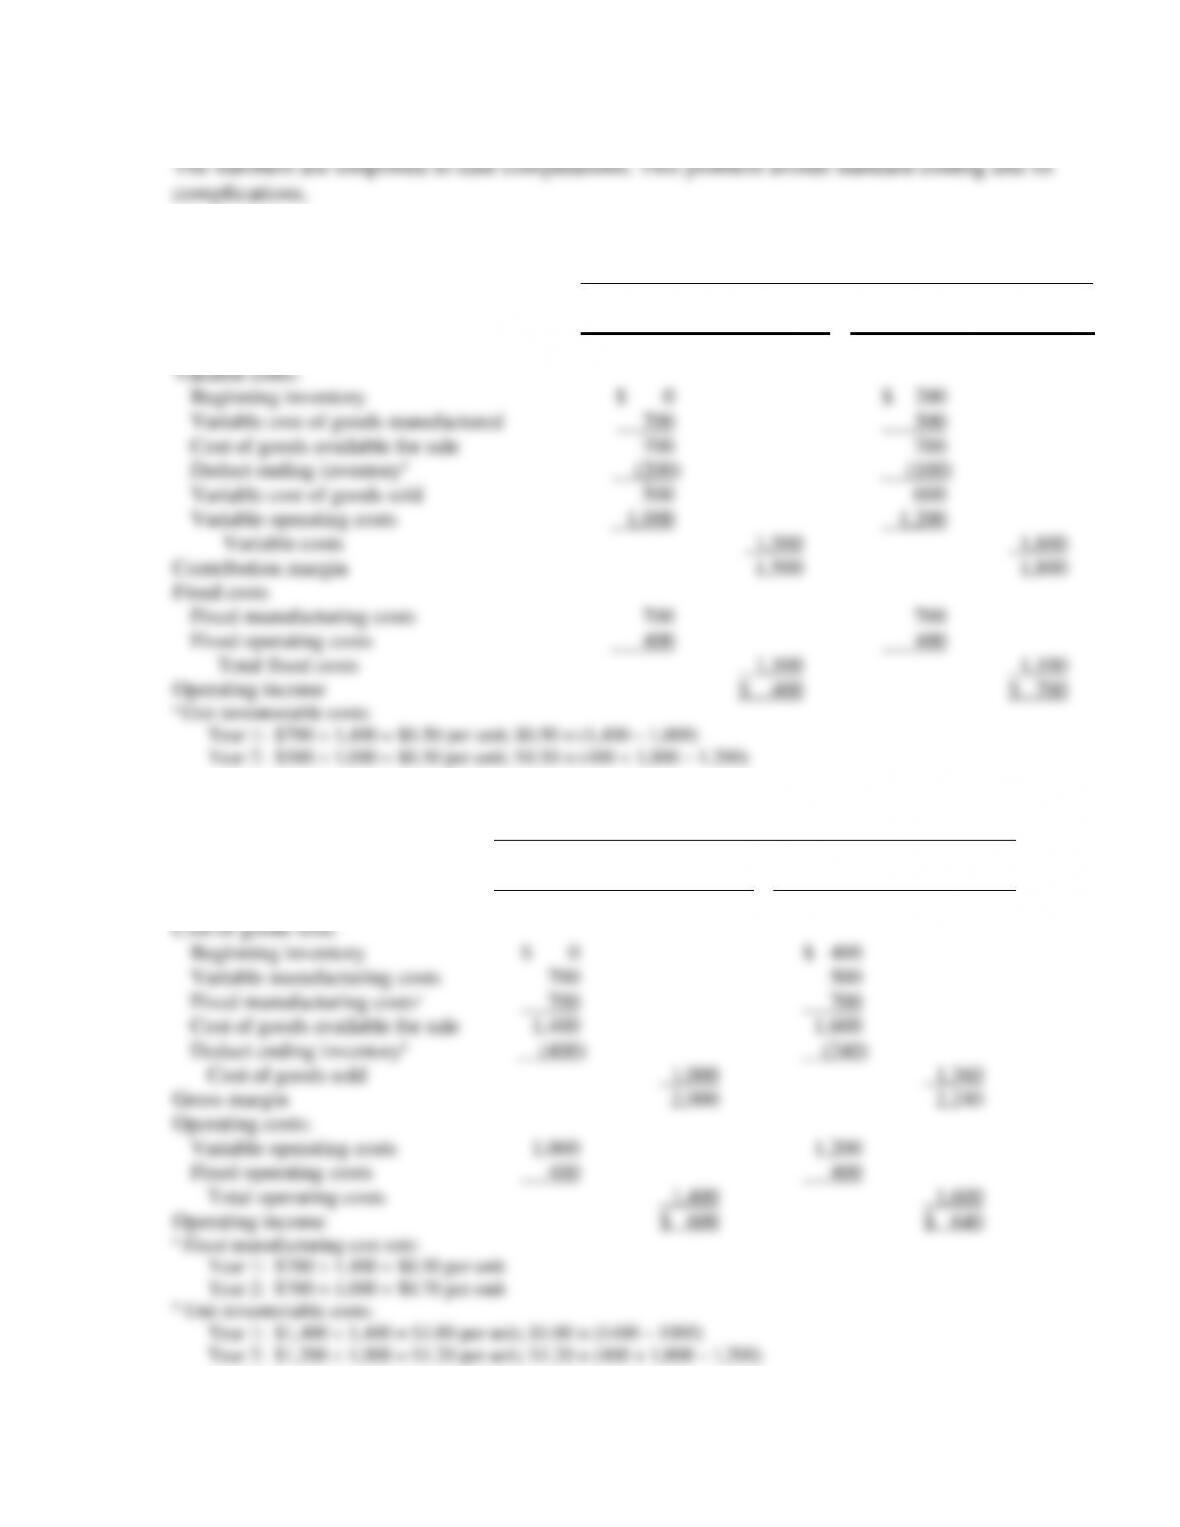
9-23 (20–30 min.) Comparison of actual-costing methods.
1. Variable-costing income statements:
2011
2012
Sales
Production
1,000 units
1,400 units
Sales
Production
1,200 units
1,000 units
Revenues ($3 per unit)
$3,000
$3,600
Variable costs:
Beginning inventory
Variable cost of goods manufactured
Cost of goods available for sale
Deduct ending inventorya
$ 0
700
700
(200)
$ 200
500
700
(100)
Variable cost of goods sold
Variable operating costs
Variable costs
Contribution margin
Fixed costs
Fixed manufacturing costs
Fixed operating costs
Total fixed costs
Operating income
500
1,000
700
400
1,500
1,500
1,100
$ 400
600
1,200
700
400
1,800
1,800
1,100
$ 700
2. Absorption-costing income statements:
2011
2012
Sales
Production
1,000 units
1,400 units
Sales
Production
1,200 units
1,000 units
Revenues ($3 per unit)
Cost of goods sold:
Beginning inventory
Variable manufacturing costs
Fixed manufacturing costsa
Cost of goods available for sale
Deduct ending inventoryb
$ 0
700
700
1,400
(400)
$3,000
$ 400
500
700
1,600
(240)
$3,600
Cost of goods sold
Gross margin
Operating costs:
Variable operating costs
Fixed operating costs
Total operating costs
Operating income
1,000
400
1,000
2,000
1,400
$ 600
1,200
400
1,360
2,240
1,600
$ 640
a Fixed manufacturing cost rate:
Year 1: $700 ÷ 1,400 = $0.50 per unit
Year 2: $700 ÷ 1,000 = $0.70 per unit
b Unit inventoriable costs:
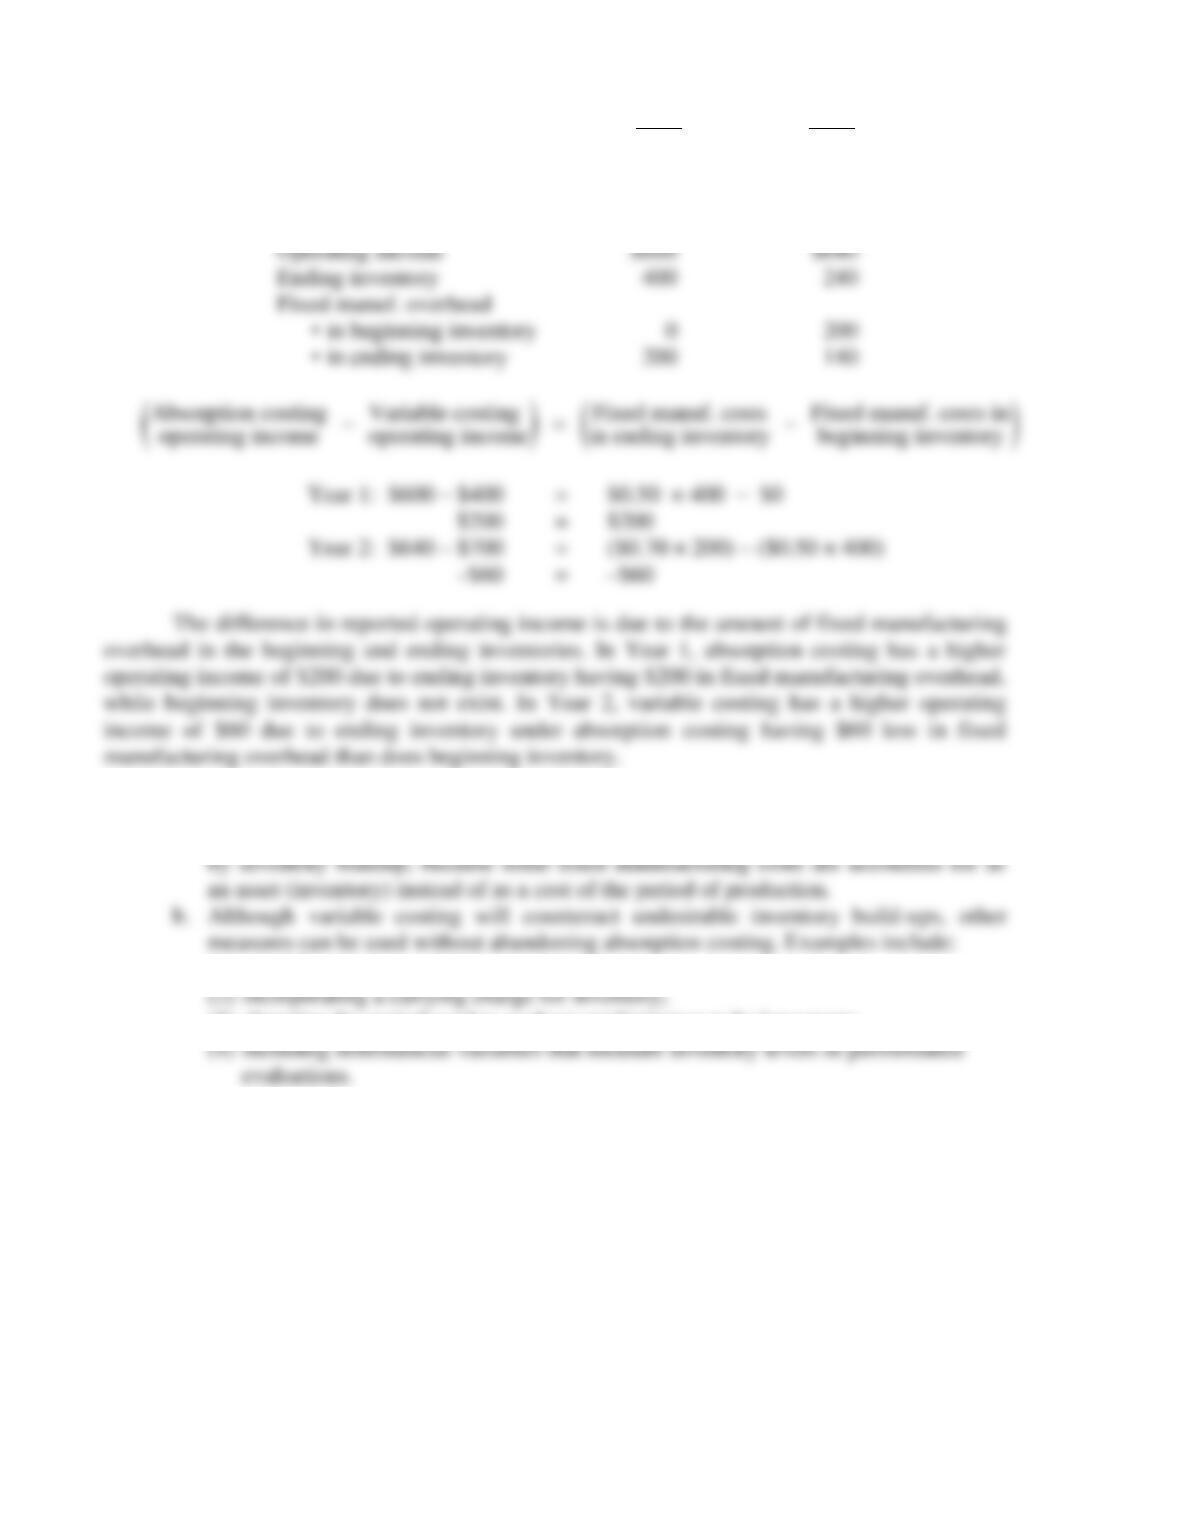
9-18
3. 2011 2012
Variable Costing:
Operating income $400 $700
Ending inventory 200 100
Absorption Costing:
4. a. Absorption costing is more likely to lead to inventory build-ups than variable costing.
Under absorption costing, operating income in a given accounting period is increased
(1) careful budgeting and inventory planning;
(3) changing the period used to evaluate performance to be long-term;
9-19
1. Helmetsmart’s annual fixed manufacturing costs are $1,078,000. It allocates $22 of fixed
manufacturing costs to each unit produced. Therefore, it must be using $1,078,000
$22 =
49,000 units (annually) as the denominator level to allocate fixed manufacturing costs to the
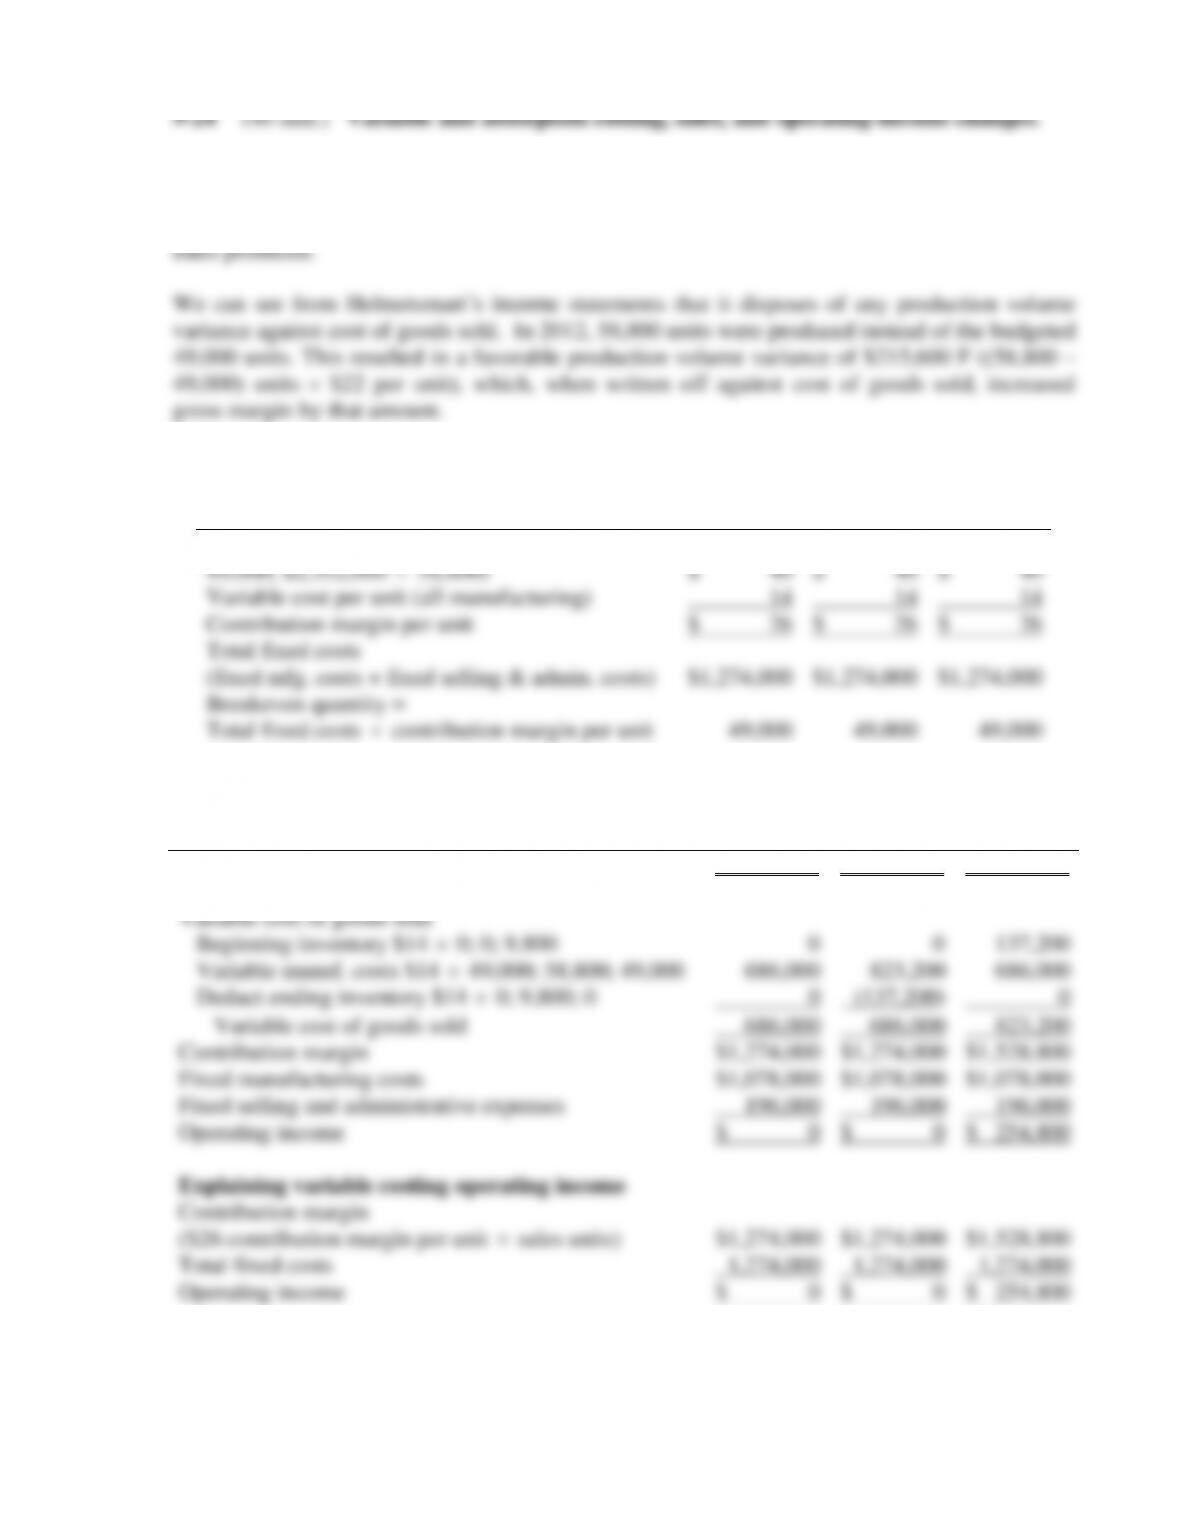
2. The breakeven calculation, same for each year, is shown below:
Calculation of breakeven volume
2011
2012
2013
Selling price ($1,960,000
49,000; $1,960,000
49,000; $2,352,000
58,800)
$ 40
$ 40
$ 40
Variable cost per unit (all manufacturing)
14
14
14
Contribution margin per unit
$ 26
$ 26
$ 26
Total fixed costs
(fixed mfg. costs + fixed selling & admin. costs)
$1,274,000
$1,274,000
$1,274,000
Breakeven quantity =
Total fixed costs
contribution margin per unit
49,000
49,000
49,000
3.
Variable Costing
2011
2012
2013
Sales (units)
49,000
49,000
58,800
Revenues
$1,960,000
$1,960,000
$2,352,000
Variable cost of goods sold
Beginning inventory $14
0; 0; 9,800
0
0
137,200
Variable manuf. costs $14
49,000; 58,800; 49,000
686,000
823,200
686,000
Deduct ending inventory $14
0; 9,800; 0
0
(137,200)
0
Variable cost of goods sold
686,000
686,000
823,200
Contribution margin
$1,274,000
$1,274,000
$1,528,800
Fixed manufacturing costs
$1,078,000
$1,078,000
$1,078,000
Fixed selling and administrative expenses
196,000
196,000
196,000
Operating income
$ 0
$ 0
$ 254,800
Explaining variable costing operating income
Contribution margin
($26 contribution margin per unit
sales units)
$1,274,000
$1,274,000
$1,528,800
Total fixed costs
1,274,000
1,274,000
1,274,000
Operating income
$ 0
$ 0
$ 254,800
9-20
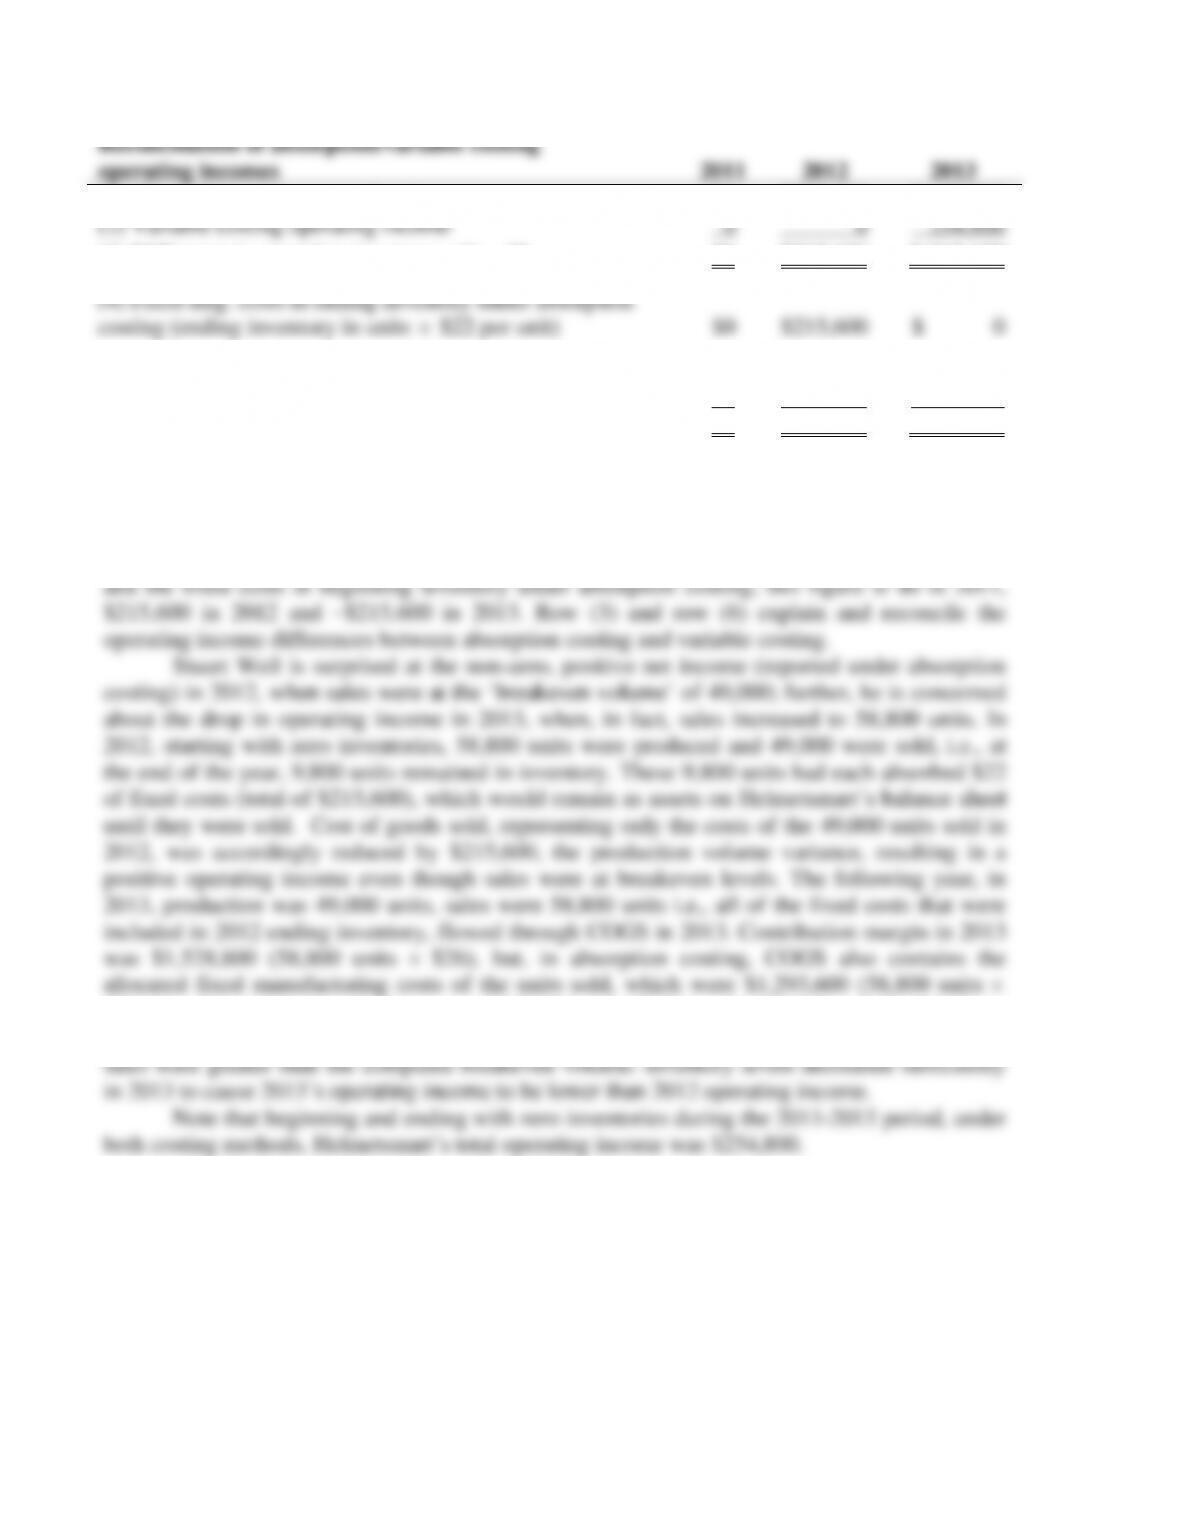
4.
Reconciliation of absorption/variable costing
operating incomes
2011
2012
2013
(1) Absorption costing operating income
$0
$215,600
$ 39,200
(2) Variable costing operating income
0
0
254,800
(3) Difference in operating incomes = (1) – (2)
$0
$215,600
$(215,600)
(4) Fixed mfg. costs in ending inventory under absorption
costing (ending inventory in units
$22 per unit)
$0
$215,600
$ 0
(5) Fixed mfg. costs in beginning inventory under absorption
costing (beginning inventory in units
$22 per unit)
0
0
215,600
(6) Difference = (4) – (5)
$0
$215,600
$(215,600)
In the table above, row (3) shows the difference between the operating income under absorption
costing and the operating income under variable costing, for each of the three years. In 2011, the
difference is $0; in 2012, absorption costing income is greater by $215,600; and in 2013, it is less
by $215,600. Row (6) above shows the difference between the fixed costs in ending inventory
$22), resulting in an operating income of $39,200 = 1,528,800 – $1,293,600 – $196,000 (fixed
sales and admin.) Hence the drop in operating income under absorption costing, even though