7-31
2.
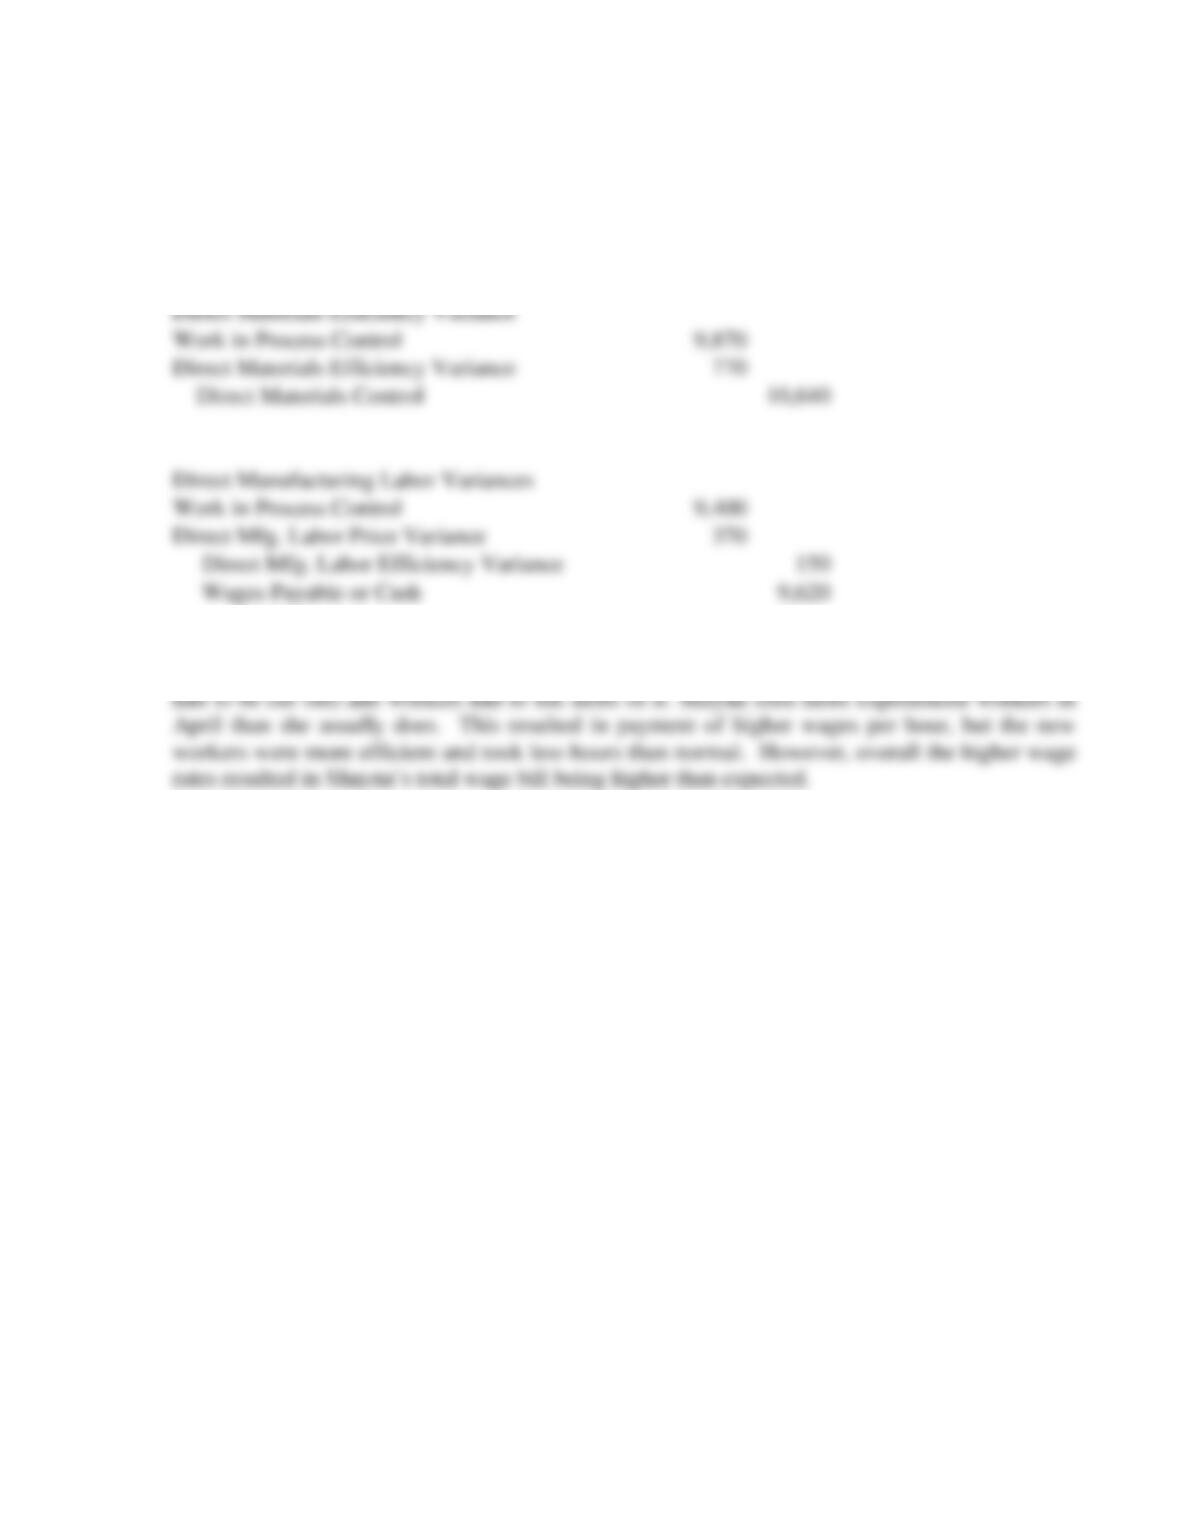
Direct Materials Price Variance (time of purchase = time of use)
Direct Materials Control
10,640
Direct Materials Price Variance
304
Accounts Payable Control or Cash
10,336
Direct Materials Efficiency Variance
Work in Process Control
9,870
Direct Materials Efficiency Variance
770
Direct Materials Control
10,640
Direct Manufacturing Labor Variances
Work in Process Control
9,400
Direct Mfg. Labor Price Variance
370
Direct Mfg. Labor Efficiency Variance
150
Wages Payable or Cash
9,620
3. Plausible explanations for the above variances include:
Shayna paid a little less for the wool, but the wool was lower quality (more knots in the yarn that
7-32
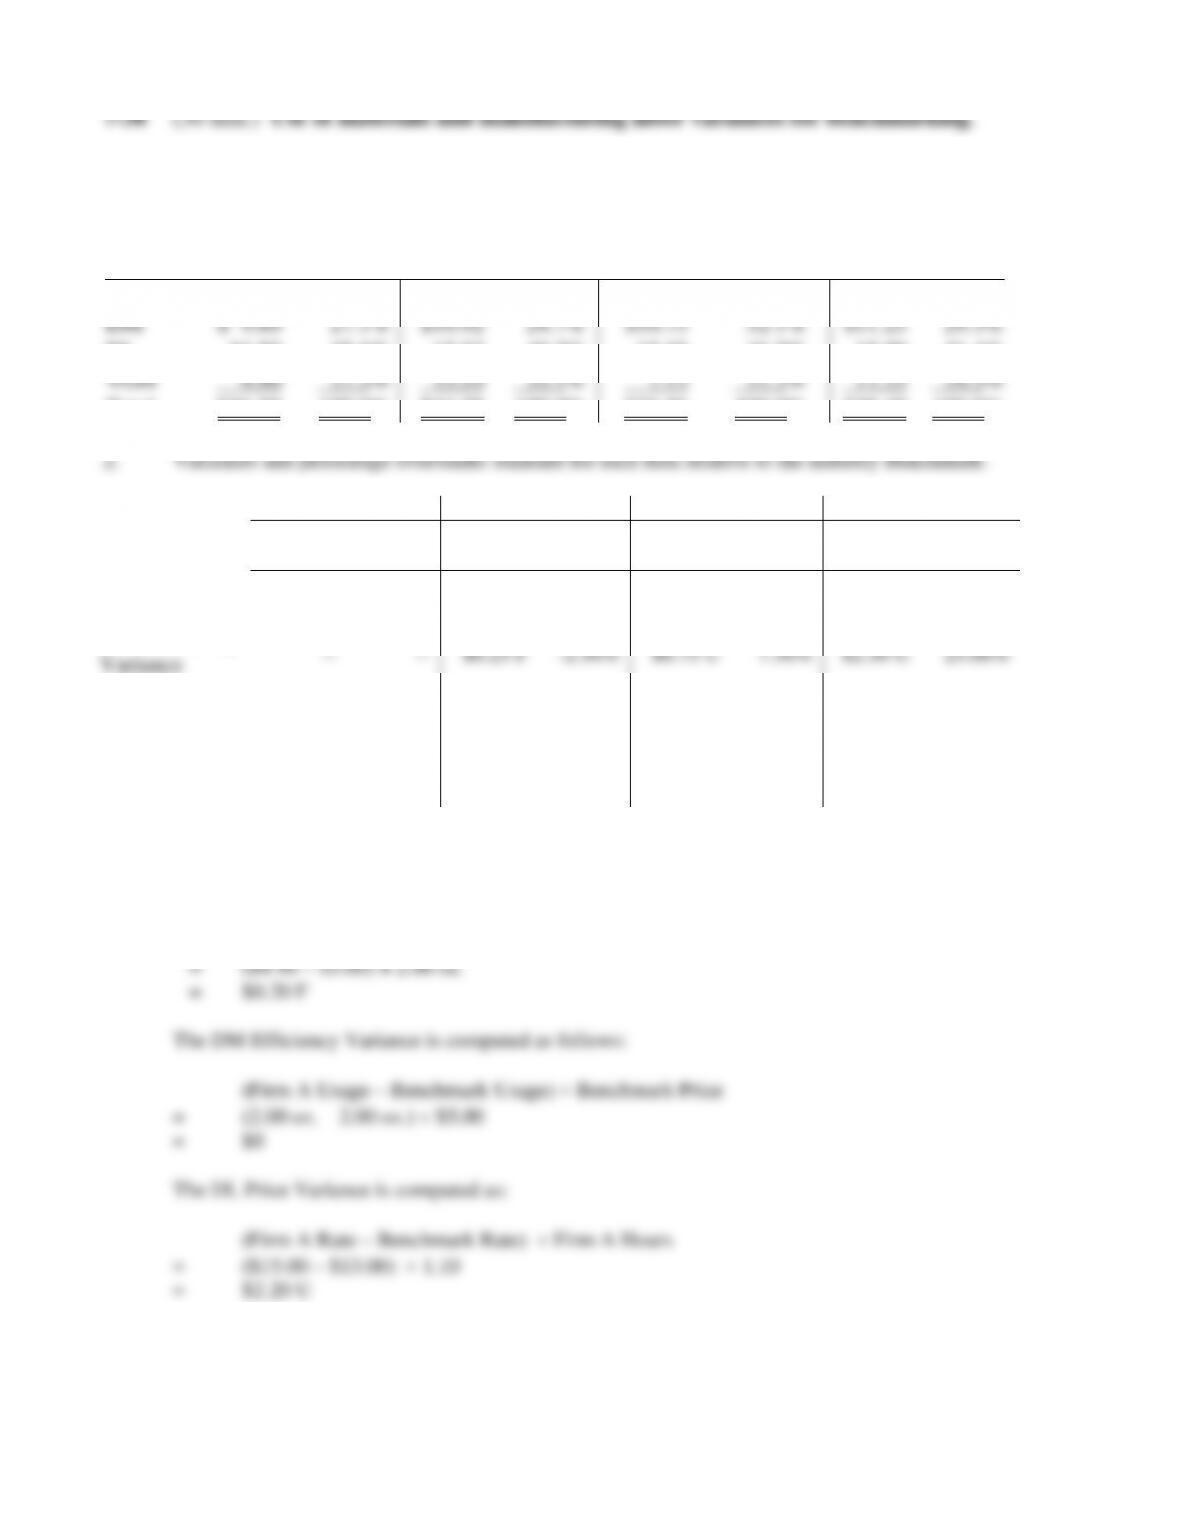
1. Unit variable cost (dollars) and component percentages for each firm:
Firm A
Firm B
Firm C
Firm D
DM
$ 9.80
27.1%
$10.92
24.7%
$10.75
32.1%
$11.25
29.3%
DL
16.50
45.6%
17.83
40.2%
15.68
46.7%
15.90
41.4%
VOH
9.90
27.3%
15.53
35.1%
7.13
21.2%
11.25
29.3%
Total
$36.20
100.0%
$44.28
100.0%
$33.56
100.0%
$38.40
100.0%
Firm A
Firm B
Firm C
Firm D
Variance
% over
standard
Variance
% over
standard
Variance
% over
standard
Variance
% over
standard
DM Price
Variance
$0.20 F
-2.00%
$1.17 U
12.00%
—
—
$1.25 F
-10.00%
DM Efficiency
Variance
—
—
$0.25 F
-2.50%
$0.75 U
7.50%
$2.50 U
25.00%
DL Price
Variance
$2.20 U
15.38%
$2.88 U
19.23%
$3.33 U
26.92%
$2.90 U
22.31%
DL Efficiency
Variance
$1.30 U
10.00%
$1.95 U
15.00%
$0.65 F
-5.00%
—
—
We illustrate these calculations for Firm A.
The DM Price Variance is computed as:
(Firm A Price – Benchmark Price) × Firm A Usage
7-33
The DL Efficiency Variance is computed as follows:
(Firm A Usage – Benchmark Usage) Benchmark Rate
= (1.10 hrs. – 1.00 hrs.) $13.00
3.
To: Boss
From: Junior Accountant
Re: Benchmarking & productivity improvements
Date: March 15, 2011
Benchmarking advantages
7-34
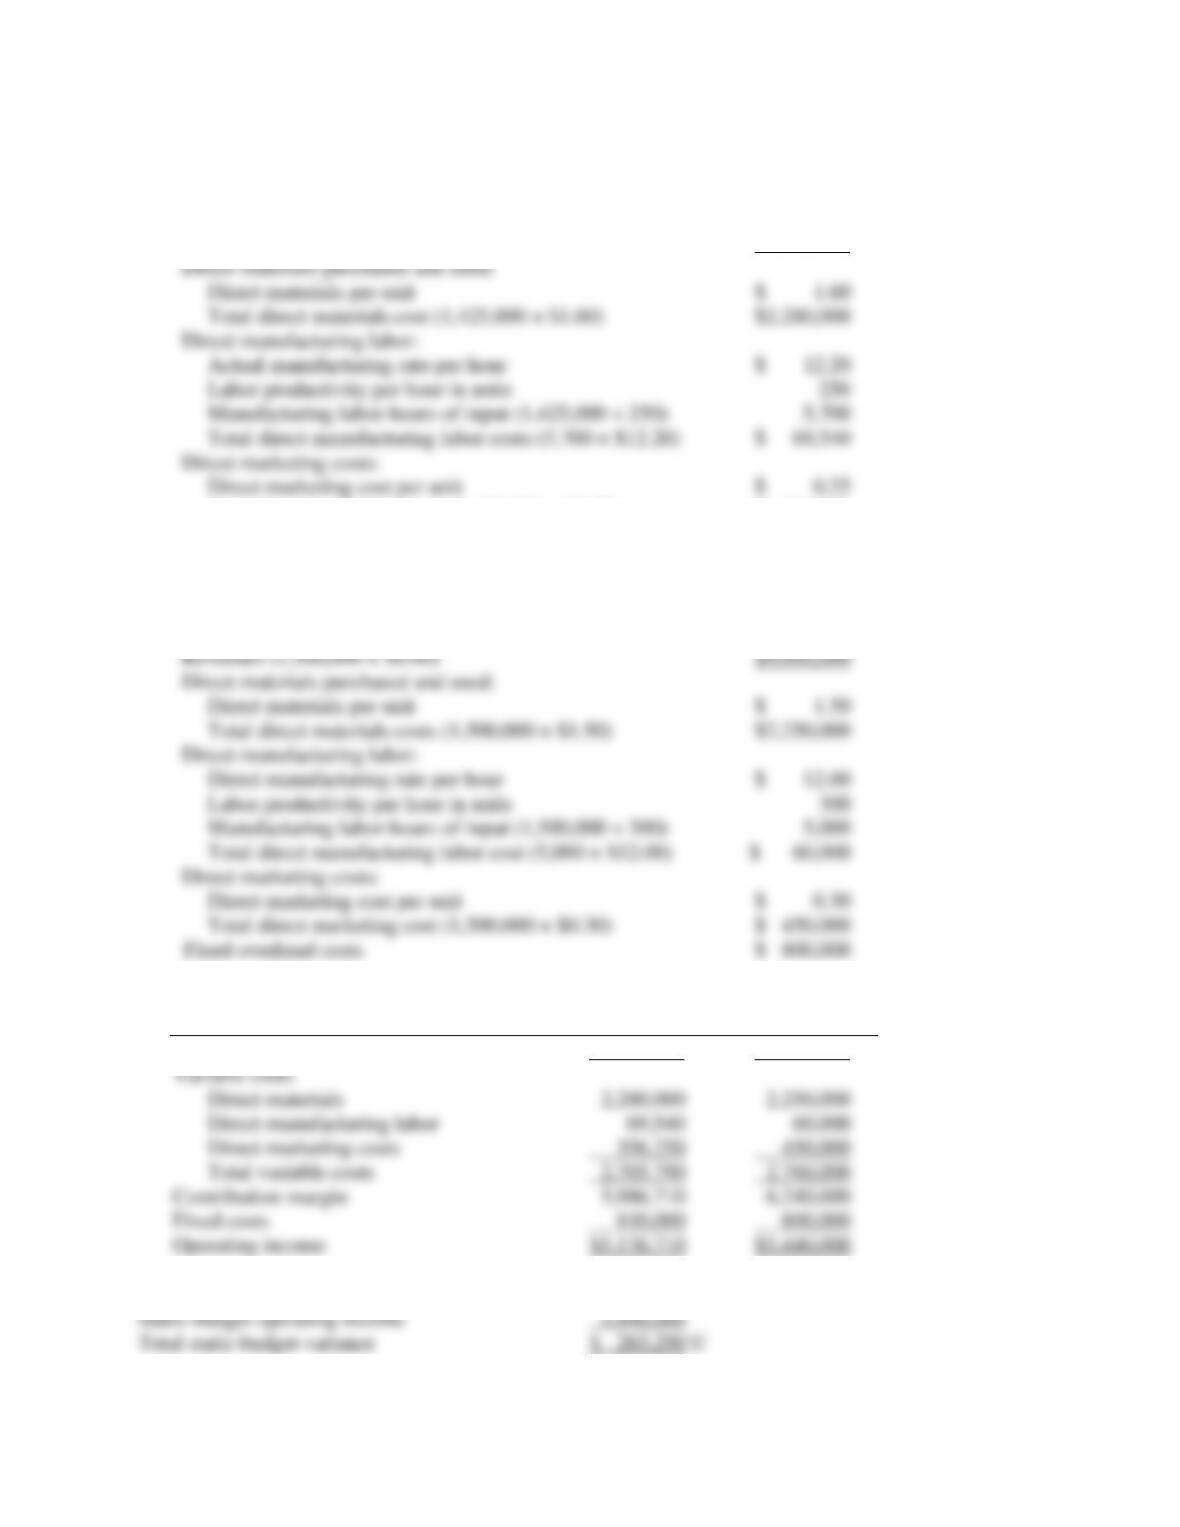
7-39 (60 min.) Comprehensive variance analysis review.
Actual Results
Units sold (95% × 1,500,000) 1,425,000
Selling price per unit $ 6.10
Revenues (1,425,000 × $6.10) $8,692,500
Total direct marketing costs (1,425,000 × $0.25) $ 356,250
Fixed overhead costs ($800,000 + $10,000) $ 810,000
Static Budgeted Amounts
Units sold 1,500,000
Selling price per unit $ 6.00
1. Actual Static-Budget
Results Amounts
Revenues $8,692,500 $9,000,000
2. Actual operating income $5,176,710
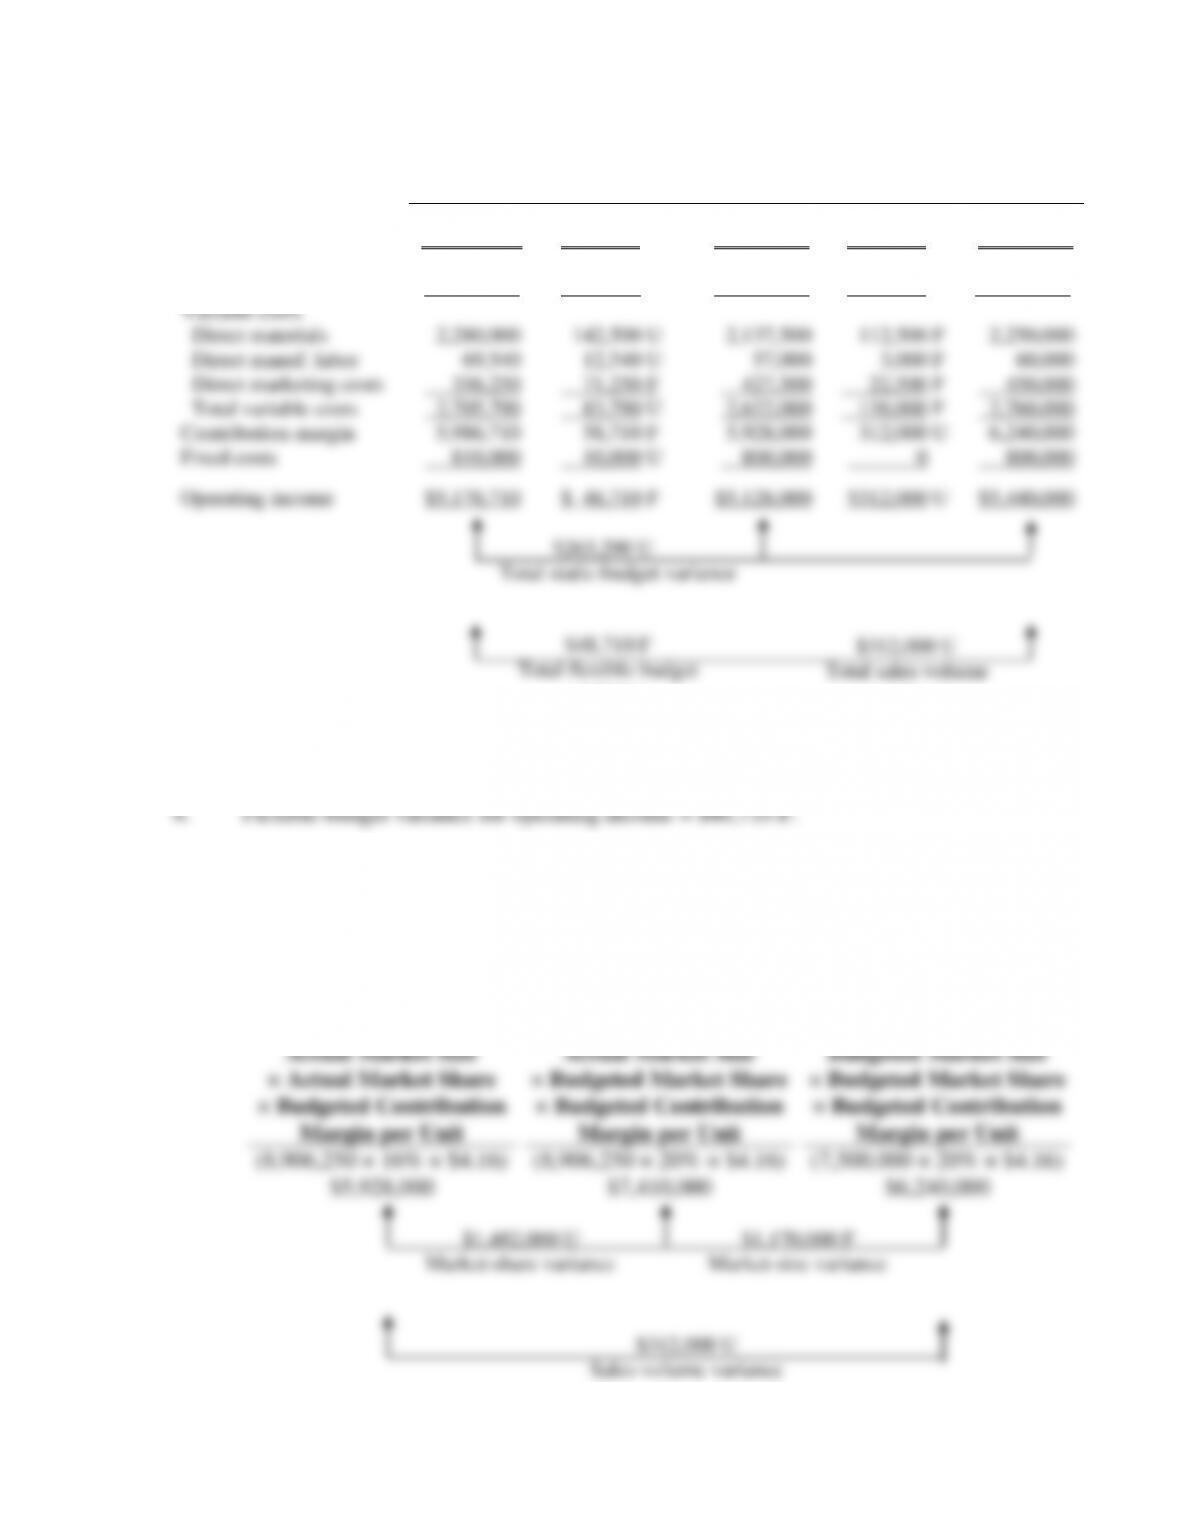
Flexible-budget-based variance analysis for Sonnet, Inc. for March 2011
Actual
Results
Flexible-Budget
Variances
Flexible
Budget
Sales-
Volume
Variances
Static
Budget
Units (diskettes) sold
1,425,000
0
1,425,000
75,000
1,500,000
Revenues
Variable costs
Direct materials
Direct manuf. labor
Direct marketing costs
Total variable costs
$8,692,500
2,280,000
69,540
356,250
2,705,790
$142,500 F
142,500 U
12,540 U
71,250 F
83,790 U
$8,550,000
2,137,500
57,000
427,500
2,622,000
$450,000 U
112,500 F
3,000 F
22,500 F
138,000 F
$9,000,000
2,250,000
60,000
450,000
2,760,000
Contribution margin
5,986,710
58,710 F
5,928,000
312,000 U
6,240,000
Fixed costs
810,000
10,000 U
800,000
0
800,000
Operating income
$5,176,710
$ 48,710 F
$5,128,000
$312,000 U
$5,440,000
3. Flexible-budget operating income = $5,128,000.
5. Sales-volume variance for operating income = $312,000 U.
6. Budgeted market share = 1,500,000 ÷ 7,500,000 = 20%
Actual market share = 1,425,000 ÷ 8,906,250 = 16%
Budgeted contribution margin per unit = $6,240,000 ÷ 1,500,000 = $4.16 per unit
Actual Market Size
× Actual Market Share
× Budgeted Contribution
Margin per Unit
Actual Market Size
× Budgeted Market Share
× Budgeted Contribution
Margin per Unit
Static Budget:
Budgeted Market Size
× Budgeted Market Share
× Budgeted Contribution
Margin per Unit
(8,906,250 × 16% × $4.16)
$5,928,000
(8,906,250 × 20% × $4.16)
$7,410,000
(7,500,000 × 20% × $4.16)
$6,240,000
$1,482,000 U $1,170,000 F
Market-share variance Market-size variance
$312,000 U
Total sales-volume
variance
$48,710 F
Total flexible-budget
variance
$263,290 U
Total static-budget variance
$312,000 U
Sales-volume variance
7-36
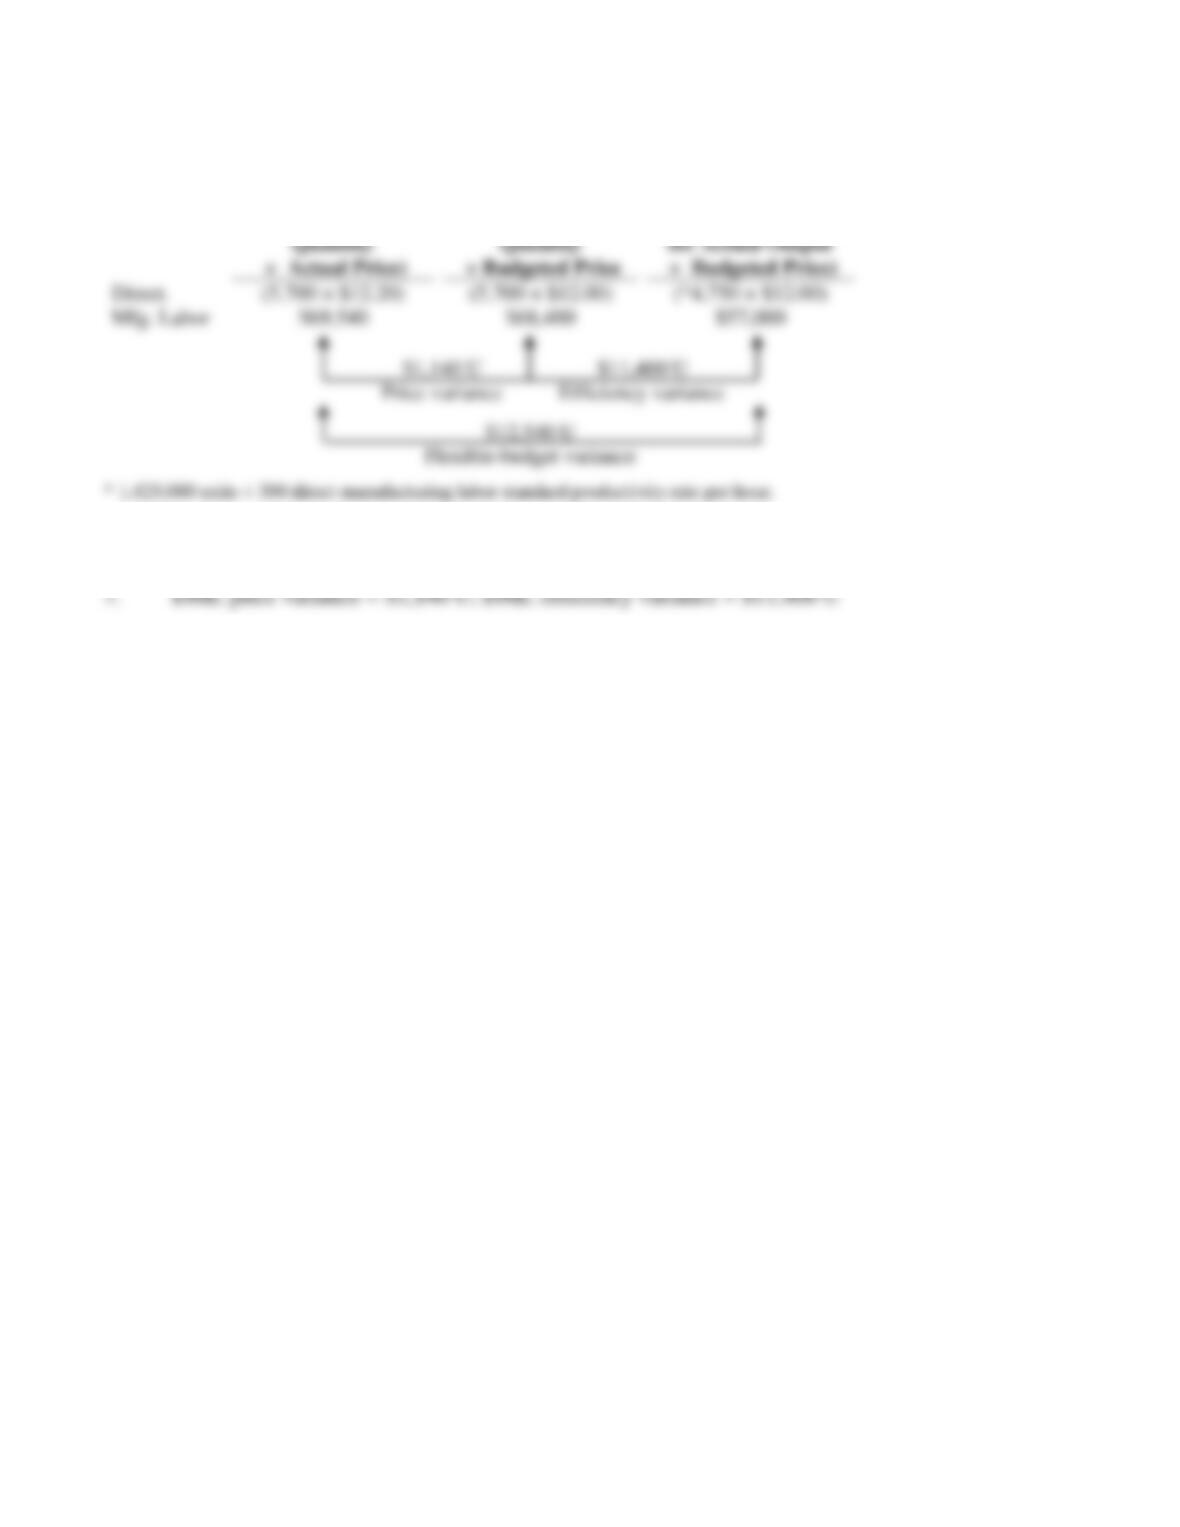
Analysis of direct mfg. labor flexible-budget variance for Sonnet, Inc. for March 2011
Actual Costs
Incurred
(Actual Input
Quantity
× Actual Price)
Actual Input
Quantity
× Budgeted Price
Flexible Budget
(Budgeted Input
Quantity Allowed
for Actual Output
× Budgeted Price)
Direct.
Mfg. Labor
(5,700 × $12.20)
$69,540
(5,700 × $12.00)
$68,400
(*4,750 × $12.00)
$57,000
$1,140 U $11,400 U
Price variance Efficiency variance
* 1,425,000 units ÷ 300 direct manufacturing labor standard productivity rate per hour.
8. DML flexible-budget variance = $12,540U
$12,540 U
Flexible-budget variance