6-40
11.
Nonmanufacturing Costs Budget
For the Year Ending December 31, 2011
Variable
Fixed
Total
Marketing
$14,100
$60,000
$74,100
Distribution
0
780
780
Total
$14,100
$60,780
$74,880
12.
Budgeted Income Statement
For the Year Ending December 31, 2011
Revenue
$352,000
Cost of goods sold
264,164
Gross margin
87,836
Operating (nonmanufacturing) costs
74,880
Operating income
$12,956
6-41
1. The standards proposed by Wert are not challenging. In fact, he set the target at the level his
department currently achieves.
2. Wert probably chose these standards so that his department would be able to make the goal
and receive any resulting reward. With a little effort, his department can likely beat these goals.
3. As discussed in the chapter, benchmarking might be used to highlight the easy targets set by
Wert. Perhaps the organization has multiple plant locations that could be used as comparisons.
1. The manager of Hair Suite III has the best style, because this manager is involving the
workers in a decision that directly affects their work.
2. The workers will most likely be upset or even angry with the manager of Hair Suite I.
The manager is not a stylist, and yet is changing the schedule for the stylists, assuming
they can work faster and need less rest between customers, without discussing this
change with them or asking for input or suggestions.
3. Of course the manager of Hair Suite III could implement one of the plans of the other
salons. That is, workers could shorten their appointment times per customer, or lengthen
6-42
make, so they will be more likely to agree to make changes since they are involved in the
decision.
Other things they may do:
• The manager may let individual stylists set their own schedules. It is possible that
not all customers need an hour each, and the stylists can individually book
4. A stretch target is supposed to be challenging but achievable. The manager of Hair Suite
I is asking the stylists to reduce per customer service time by 20 minutes, or a 20/60 =
33% reduction in service time. Even if this reduction is achievable, the other part of the
6-43
6-41 (60 min.) Comprehensive budgeting problem; activity-based costing, operating and
financial budgets.
1a.
Revenues Budget
For the Month of June, 2012
Units
Selling Price
Total Revenues
Regular
2,000
$80
$160,000
Deluxe
3,000
130
390,000
Total
$550,000
b.
Production Budget
For the Month of June, 2012
Product
Regular
Deluxe
Budgeted unit sales
2,000
3,000
Add: target ending finished goods inventory
400
600
Total required units
2,400
3,600
Deduct: beginning finished goods inventory
250
650
Units of finished goods to be produced
2,150
2,950
c.
Direct Material Usage Budget in Quantity and Dollars
For the Month of June, 2012
Material
Cloth
Wood
Total
Physical Units Budget
Direct materials required for
Regular (2,150 units × 1.3 yd.; 0 bd-ft)
2,795 yds.
0
Deluxe (2,950 units × 1.5 yds.; 2 bd-ft)
4,425 yds.
5,900
Total quantity of direct materials to be used
7,720 yds.
5,900
Cost Budget
Available from beginning direct materials inventory
(under a FIFO cost-flow assumption)
$ 2,146
$ 4,040
To be purchased this period
Cloth: (7720 yd. – 610 yd.) × $3.50 per yd.
24,885
Wood: (5,900 – 800) × $5 per bd-ft
_ ___
25,500
Direct materials to be used this period
$27,031
$29,540
$56,571
6-44
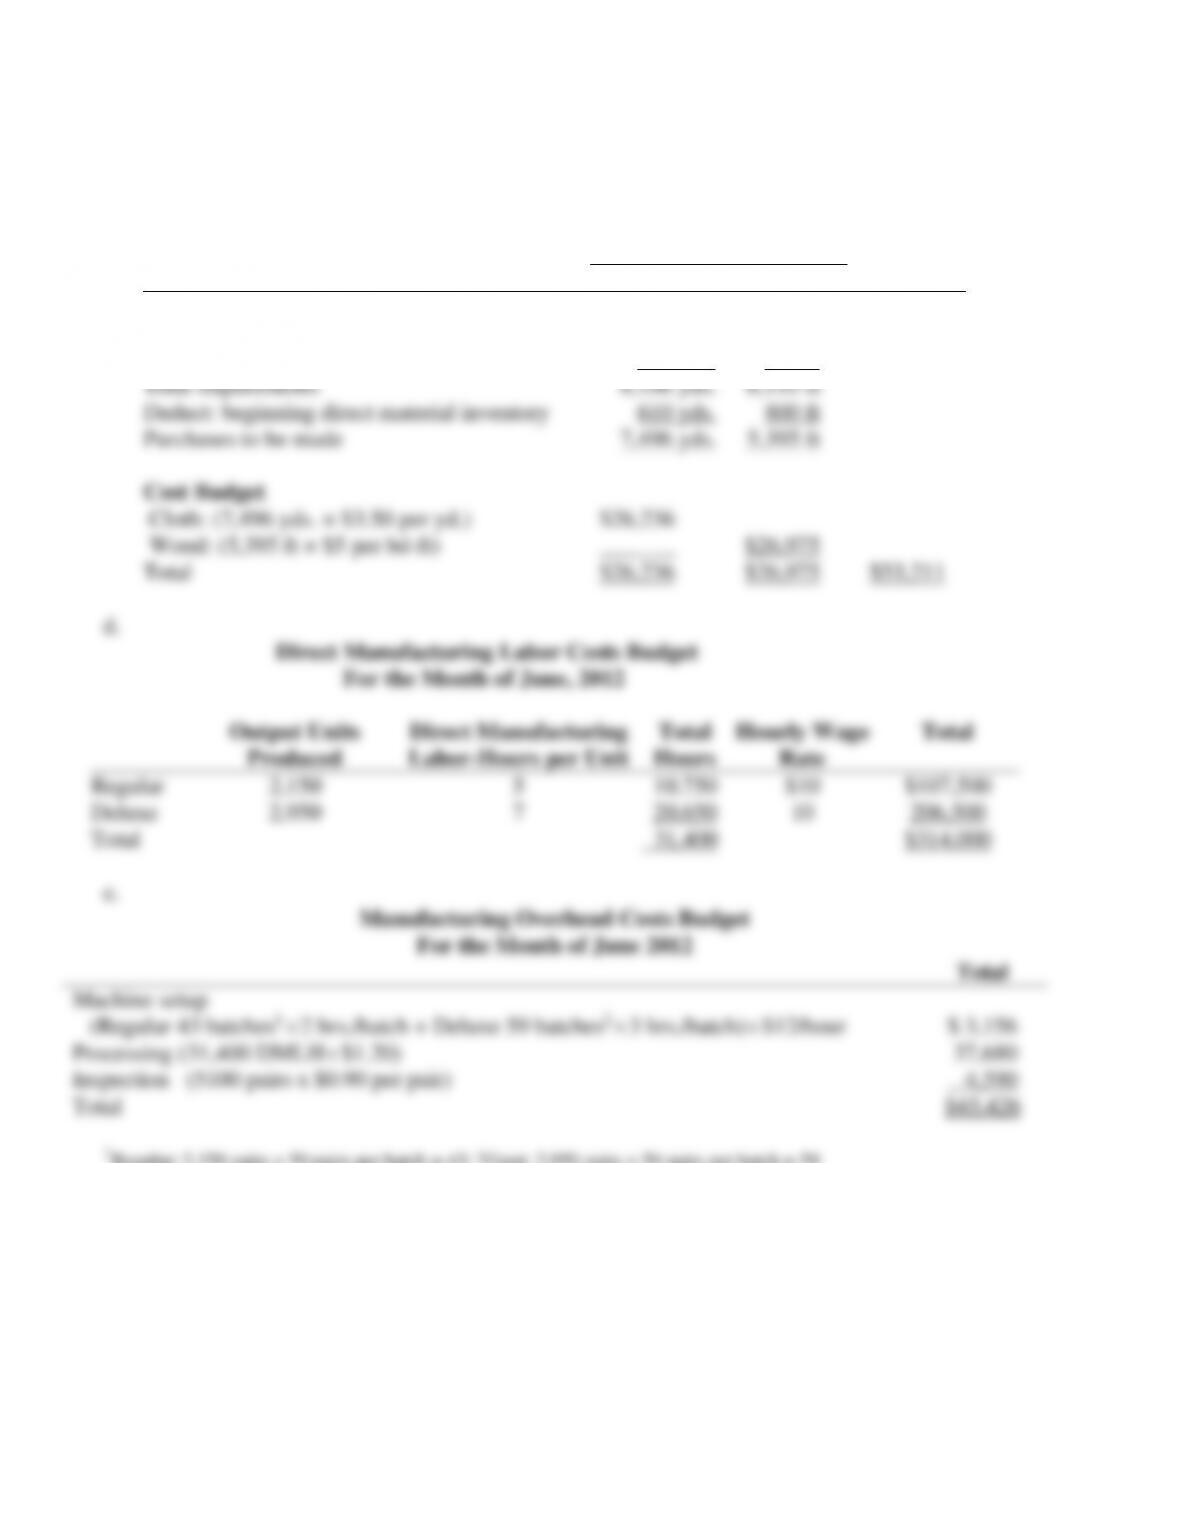
Direct Materials Purchases Budget
For the Month of June, 2012
Material
Cloth
Wood
Total
Physical Units Budget
To be used in production
7,720 yds.
5,900 ft
Add: Target ending direct material inventory
386 yds.
295 ft
Total requirements
8,106 yds.
6,195 ft
Deduct: beginning direct material inventory
610 yds.
800 ft
Purchases to be made
7,496 yds.
5,395 ft
Cost Budget
Cloth: (7,496 yds. × $3.50 per yd.)
$26,236
Wood: (5,395 ft × $5 per bd-ft)
___ _
$26,975
Total
$26,236
$26,975
$53,211
d.
Direct Manufacturing Labor Costs Budget
For the Month of June, 2012
Output Units
Direct Manufacturing
Total
Hourly Wage
Total
Produced
Labor-Hours per Unit
Hours
Rate
Regular
2,150
5
10,750
$10
$107,500
Deluxe
2,950
7
20,650
10
206,500
Total
31,400
$314,000
e.
Manufacturing Overhead Costs Budget
For the Month of June 2012
Total
Machine setup
(Regular 43 batches1
2 hrs./batch + Deluxe 59 batches2
3 hrs./batch)
$12/hour
$ 3,156
Processing (31,400 DMLH
$1.20)
37,680
Inspection (5100 pairs x $0.90 per pair)
4,590
Total
$45,426
1Regular: 2,150 pairs ÷ 50 pairs per batch = 43; 2Giant: 2,950 pairs ÷ 50 pairs per batch = 59
6-45
f.
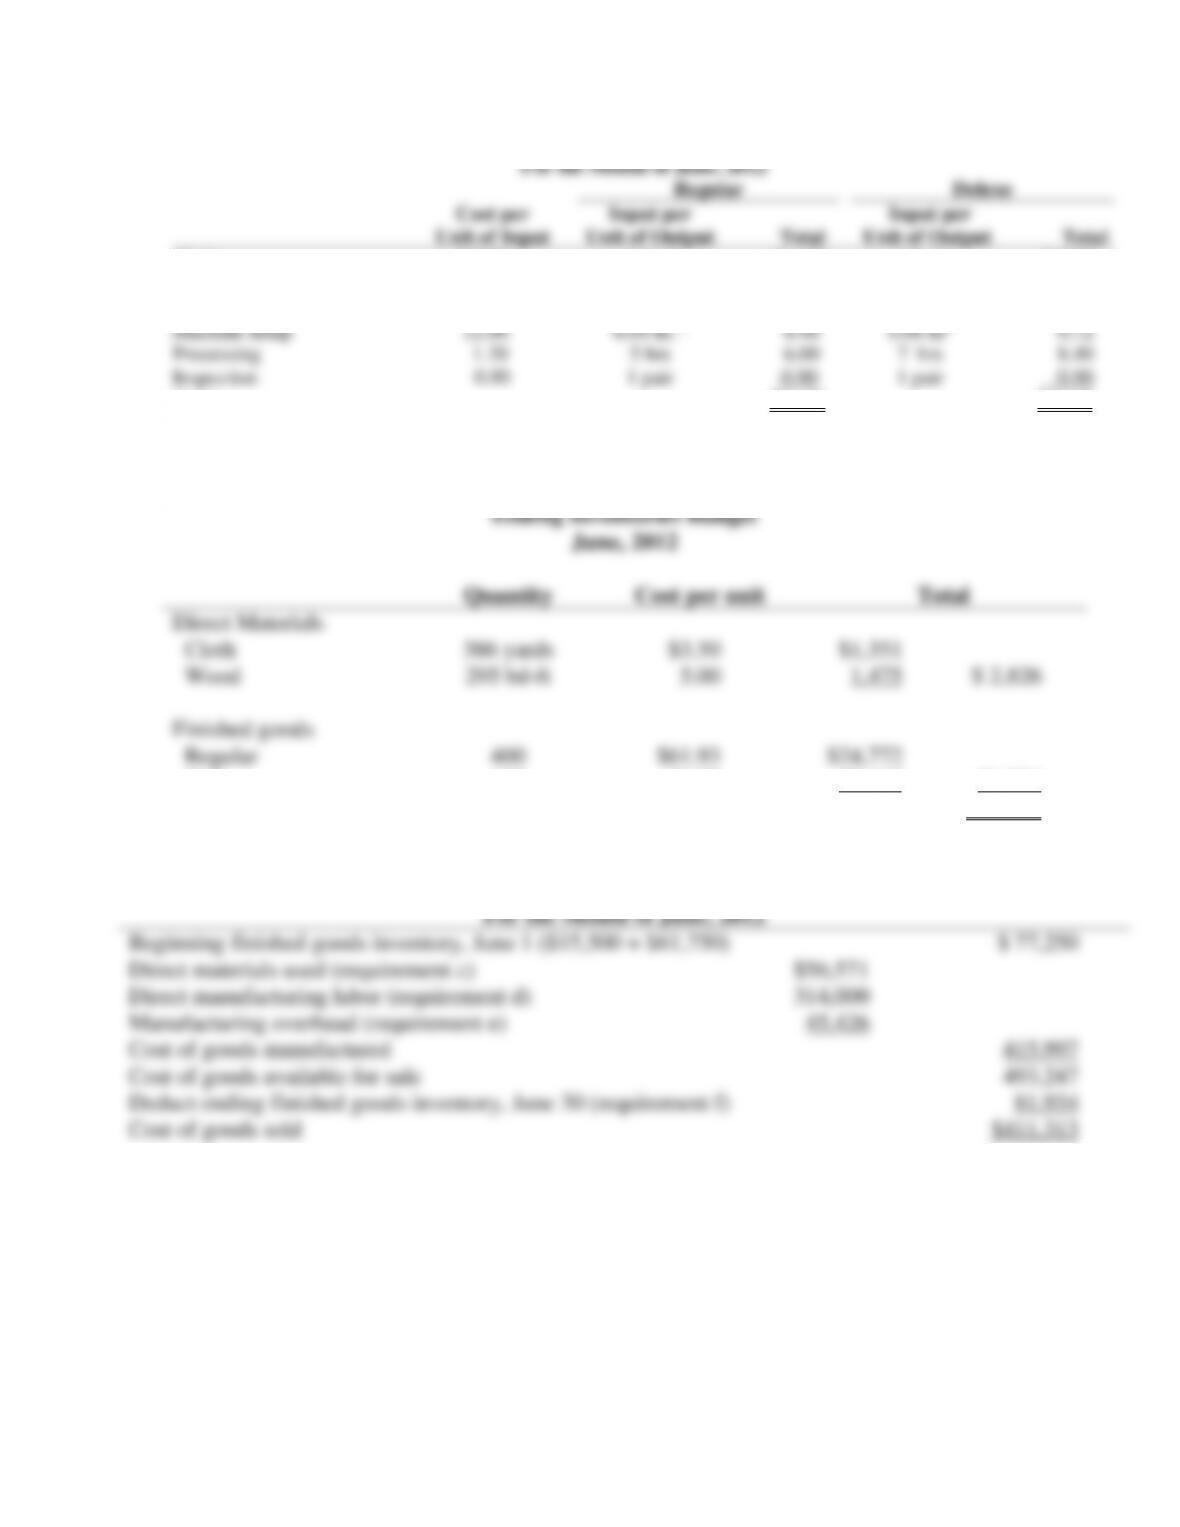
Unit Costs of Ending Finished Goods Inventory
For the Month of June, 2012
Regular
Deluxe
Cost per
Unit of Input
Input per
Unit of Output
Total
Input per
Unit of Output
Total
Cloth
$ 3.50
1.3 yd
$ 4.55
1.5 yd
$ 5.25
Wood
5.00
0
0
2 bd-ft
10.00
Direct manufacturing labor
10.00
5 hr.
50.00
7 hrs
70.00
Machine setup
12.00
0.04 hr. 1
0.48
0.06 hr1
0.72
Processing
1.20
5 hrs
6.00
7 hrs
8.40
Inspection
0.90
1 pair
0.90
1 pair
0.90
Total
$61.93
$95.27
1 2 hours per setup ÷ 50 pairs per batch = 0.04 hr. per unit;
3 hours per setup ÷ 50 pairs per batch = 0.06 hr. per unit.
Ending Inventories Budget
June, 2012
Quantity
Cost per unit
Total
Direct Materials
Cloth
386 yards
$3.50
$1,351
Wood
295 bd-ft
5.00
1,475
$ 2,826
Finished goods
Regular
400
$61.93
$24,772
Deluxe
600
95.27
57,162
81,934
Total ending inventory
$84,760
g.
Cost of Goods Sold Budget
For the Month of June, 2012
Beginning finished goods inventory, June 1 ($15,500 + $61,750)
$ 77,250
Direct materials used (requirement c)
$56,571
Direct manufacturing labor (requirement d)
314,000
Manufacturing overhead (requirement e)
45,426
Cost of goods manufactured
415,997
Cost of goods available for sale
493,247
Deduct ending finished goods inventory, June 30 (requirement f)
81,934
Cost of goods sold
$411,313
6-46
h.
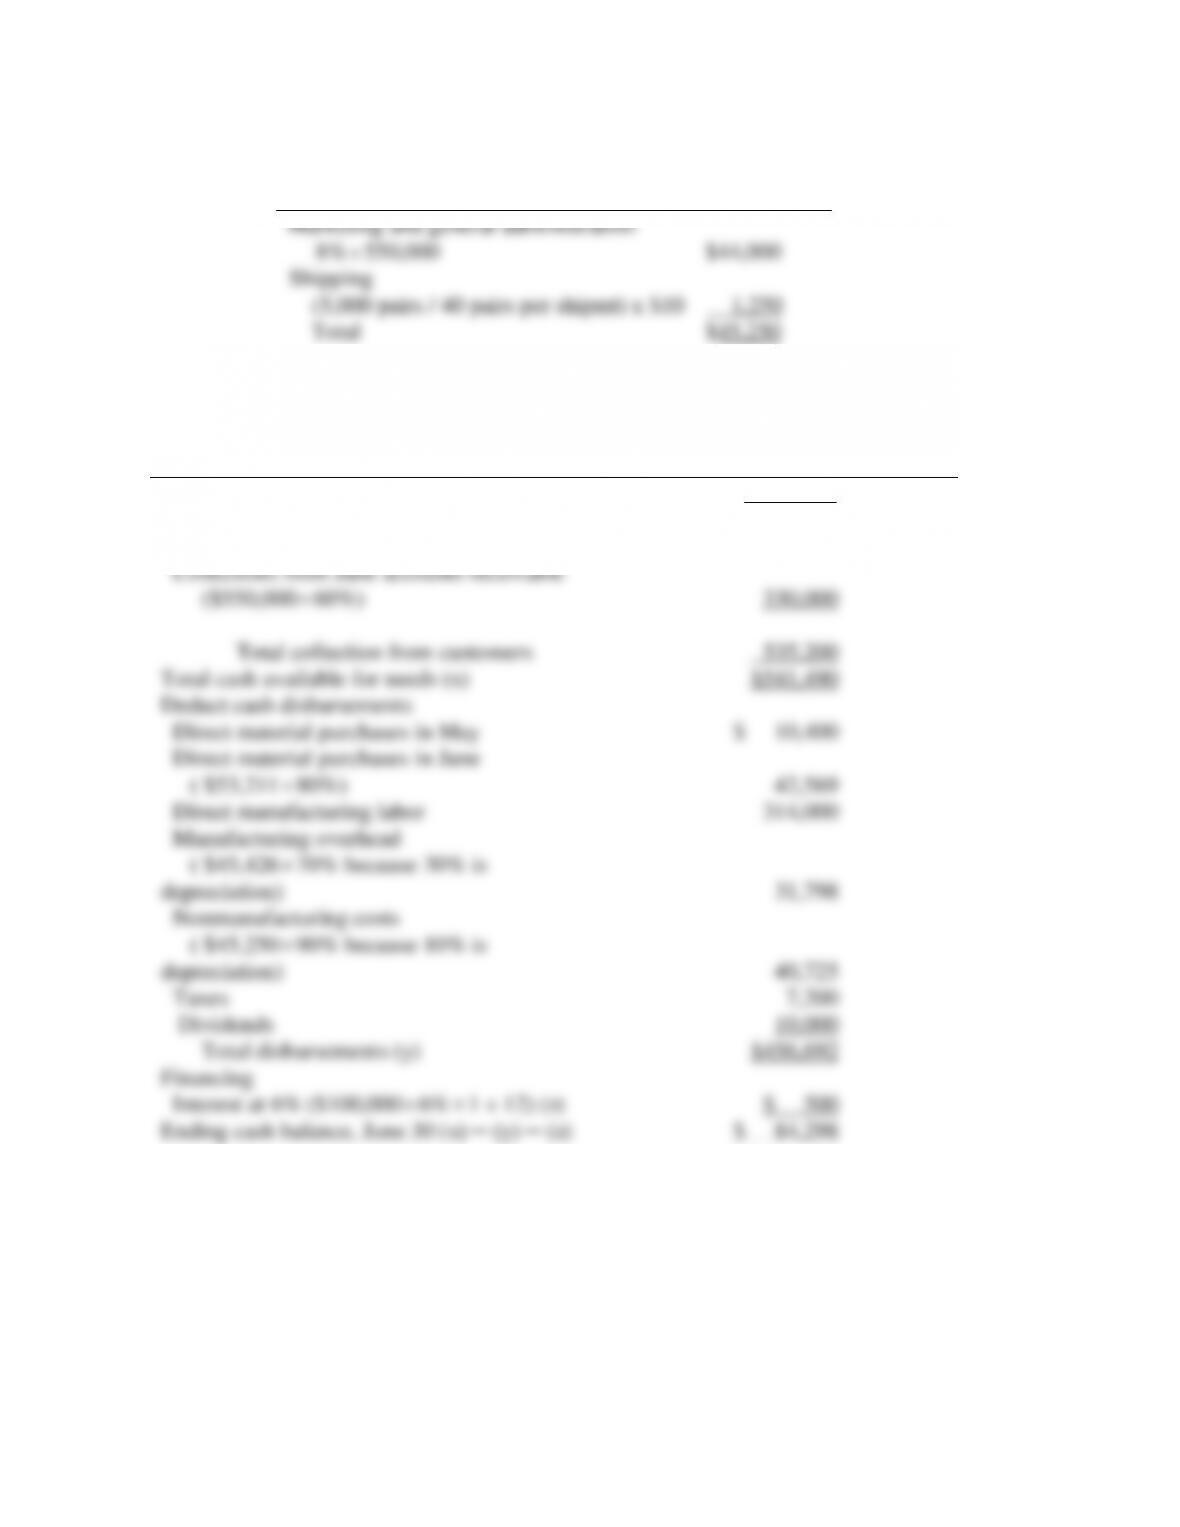
Nonmanufacturing Costs Budget
For the Month of June, 2012
Total
Marketing and general administration
8%
550,000
$44,000
Shipping
(5,000 pairs / 40 pairs per shipmt) x $10 1,250
Total $45,250
2.
Cash Budget
June 30, 2012
Cash balance, June 1 (from Balance Sheet)
$ 6,290
Add receipts
Collections from May accounts receivable
205,200
Collections from June accounts receivable
($550,000
60%)
330,000
Total collection from customers
535,200
Total cash available for needs (x)
$541,490
Deduct cash disbursements
Direct material purchases in May
$ 10,400
Direct material purchases in June
( $53,211
80%)
42,569
Direct manufacturing labor
314,000
Manufacturing overhead
( $45,426
70% because 30% is
depreciation)
31,798
Nonmanufacturing costs
( $45,250
90% because 10% is
depreciation)
40,725
Taxes
Dividends
7,200
10,000
Total disbursements (y)
$456,692
Financing
Interest at 6% ($100,000
6%
1 ÷ 12) (z)
$ 500
Ending cash balance, June 30 (x) ─ (y) ─ (z)
$ 84,298
3.
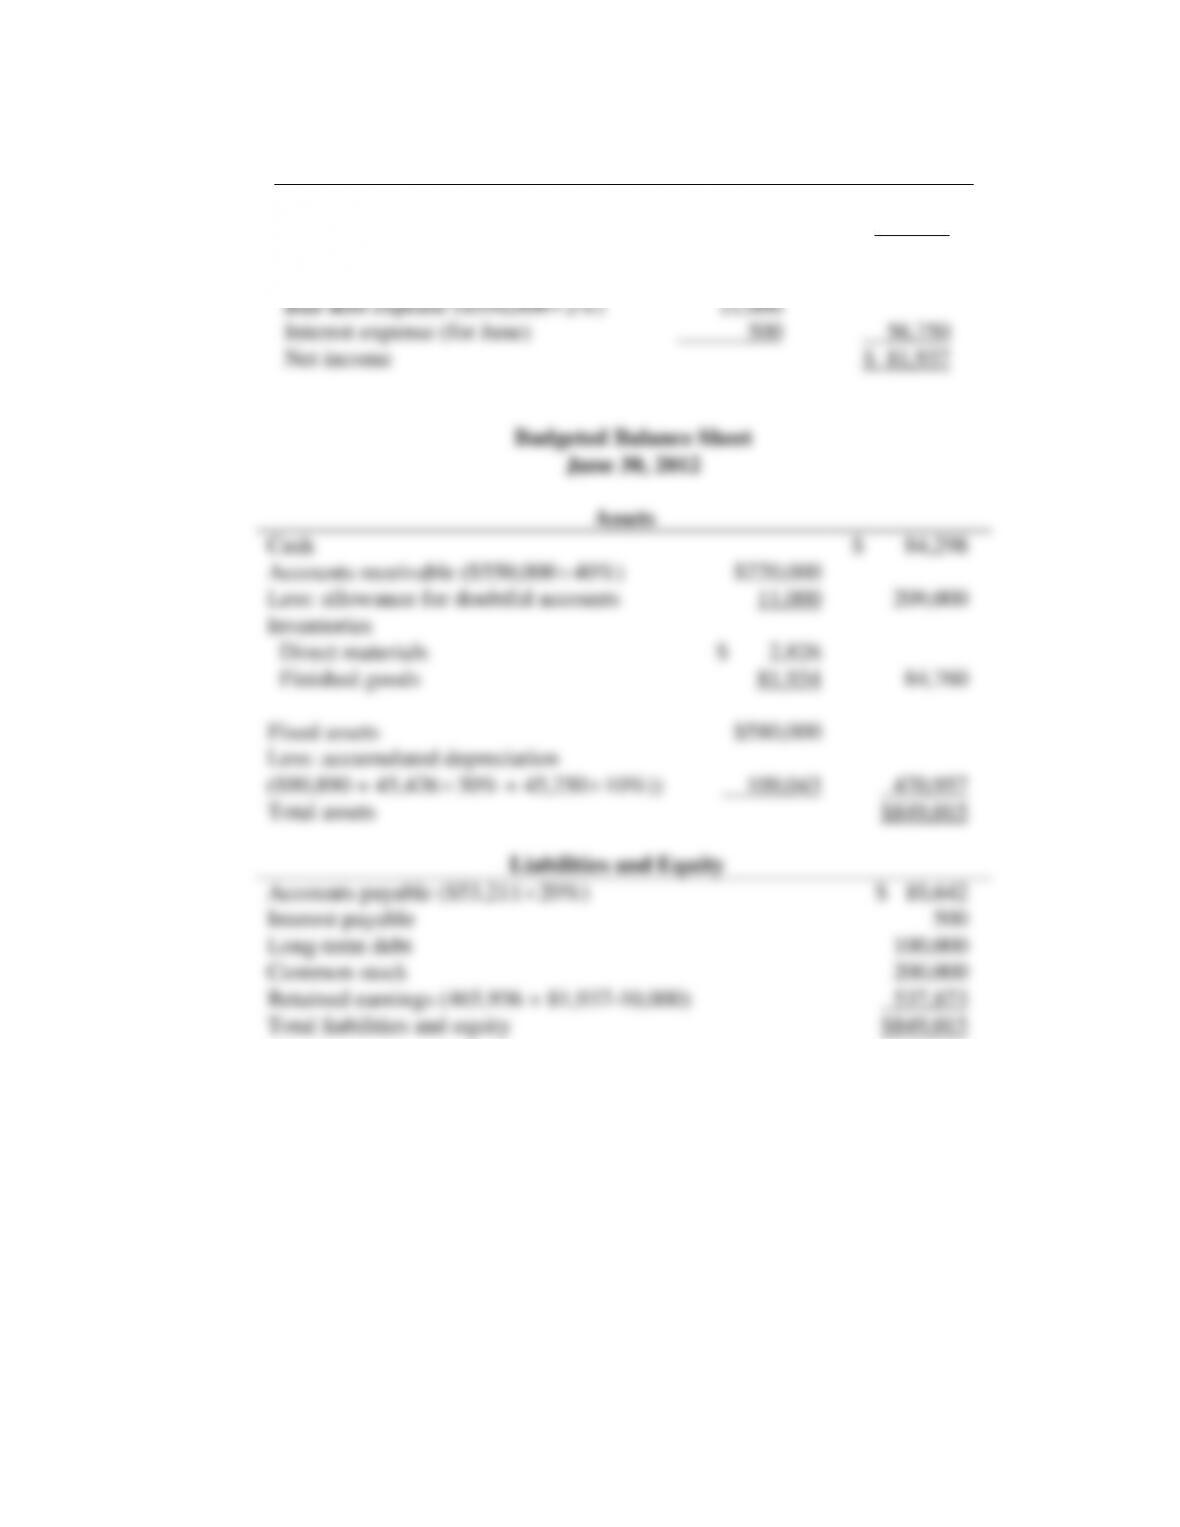
Budgeted Income Statement
For the Month of June, 2012
Revenues
$550,000
Cost of goods sold
411,313
Gross margin
$138,687
Operating (nonmanufacturing) costs
$45,250
Bad debt expense ($550,000
2%)
11,000
Interest expense (for June)
500
56,750
Net income
$ 81,937
Cash
Accounts receivable ($550,000
Less: allowance for doubtful accounts
Inventories
Fixed assets
Total assets
Accounts payable ($53,211
Interest payable
Long-term debt
Common stock
Retained earnings (465,936 + 81,937-10,000))
Total liabilities and equity