6-31
6-36 (30 min.) Cash budgeting, chapter appendix.
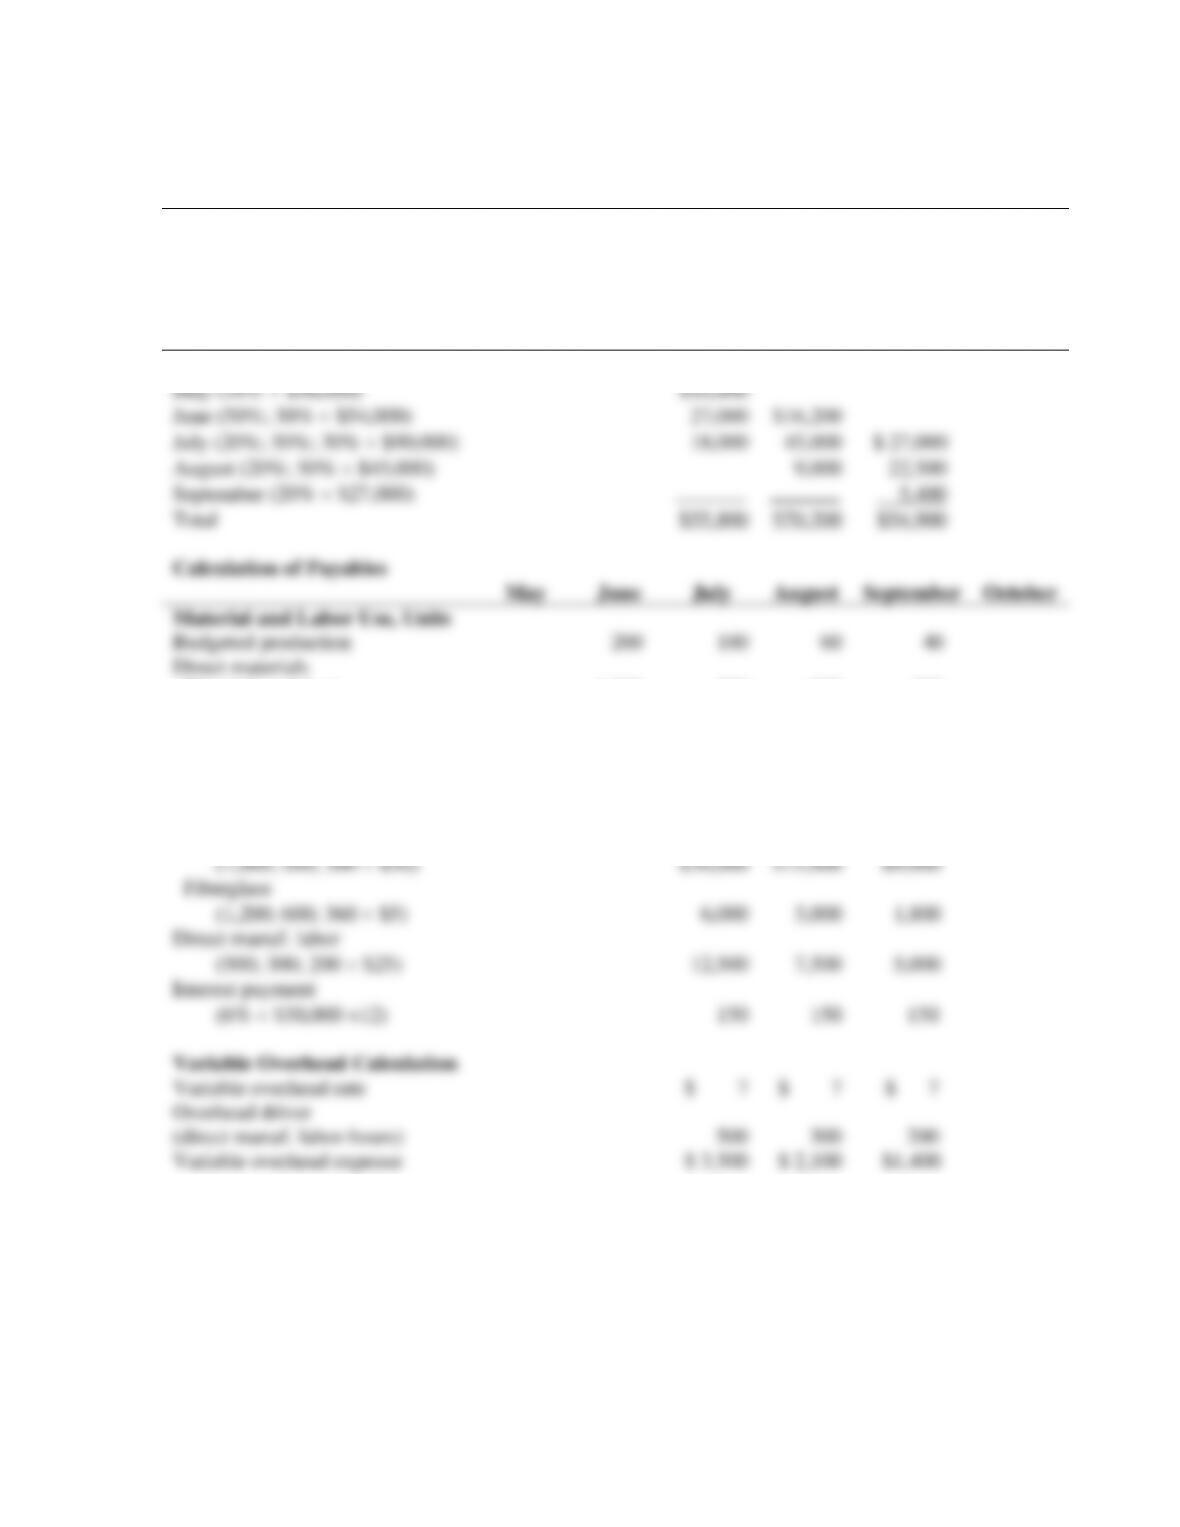
1. Projected Sales
May
June
July
August
September
October
Sales in units
80
120
200
100
60
40
Revenues (Sales in units × $450)
$36,000
$54,000
$90,000
$45,000
$27,000
Collections of Receivables
May
June
July
August
September
October
From sales in:
May (30% $36,000)
$10,800
June (50%; 30% $54,000)
27,000
$16,200
July (20%; 50%; 30% $90,000)
18,000
45,000
$ 27,000
August (20%; 50% $45,000)
9,000
22,500
September (20% $27,000)
5,400
Total
$55,800
$70,200
$54,900
Calculation of Payables
May
June
July
August
September
October
Material and Labor Use, Units
Budgeted production
200
100
60
40
Direct materials
Wood (board feet)
1,000
500
300
200
Fiberglass (yards)
1,200
600
360
240
Direct manuf. labor (hours)
1,000
500
300
200
Disbursement of Payments
Direct materials
Wood
(1,000; 500; 300 $30)
$30,000
$15,000
$9,000
Fiberglass
(1,200; 600; 360 $5)
6,000
3,000
1,800
Direct manuf. labor
(500; 300; 200 $25)
12,500
7,500
5,000
Interest payment
(6% $30,000 ÷12)
150
150
150
Variable Overhead Calculation
Variable overhead rate
$ 7
$ 7
$ 7
Overhead driver
(direct manuf. labor-hours)
500
300
200
Variable overhead expense
$ 3,500
$ 2,100
$1,400
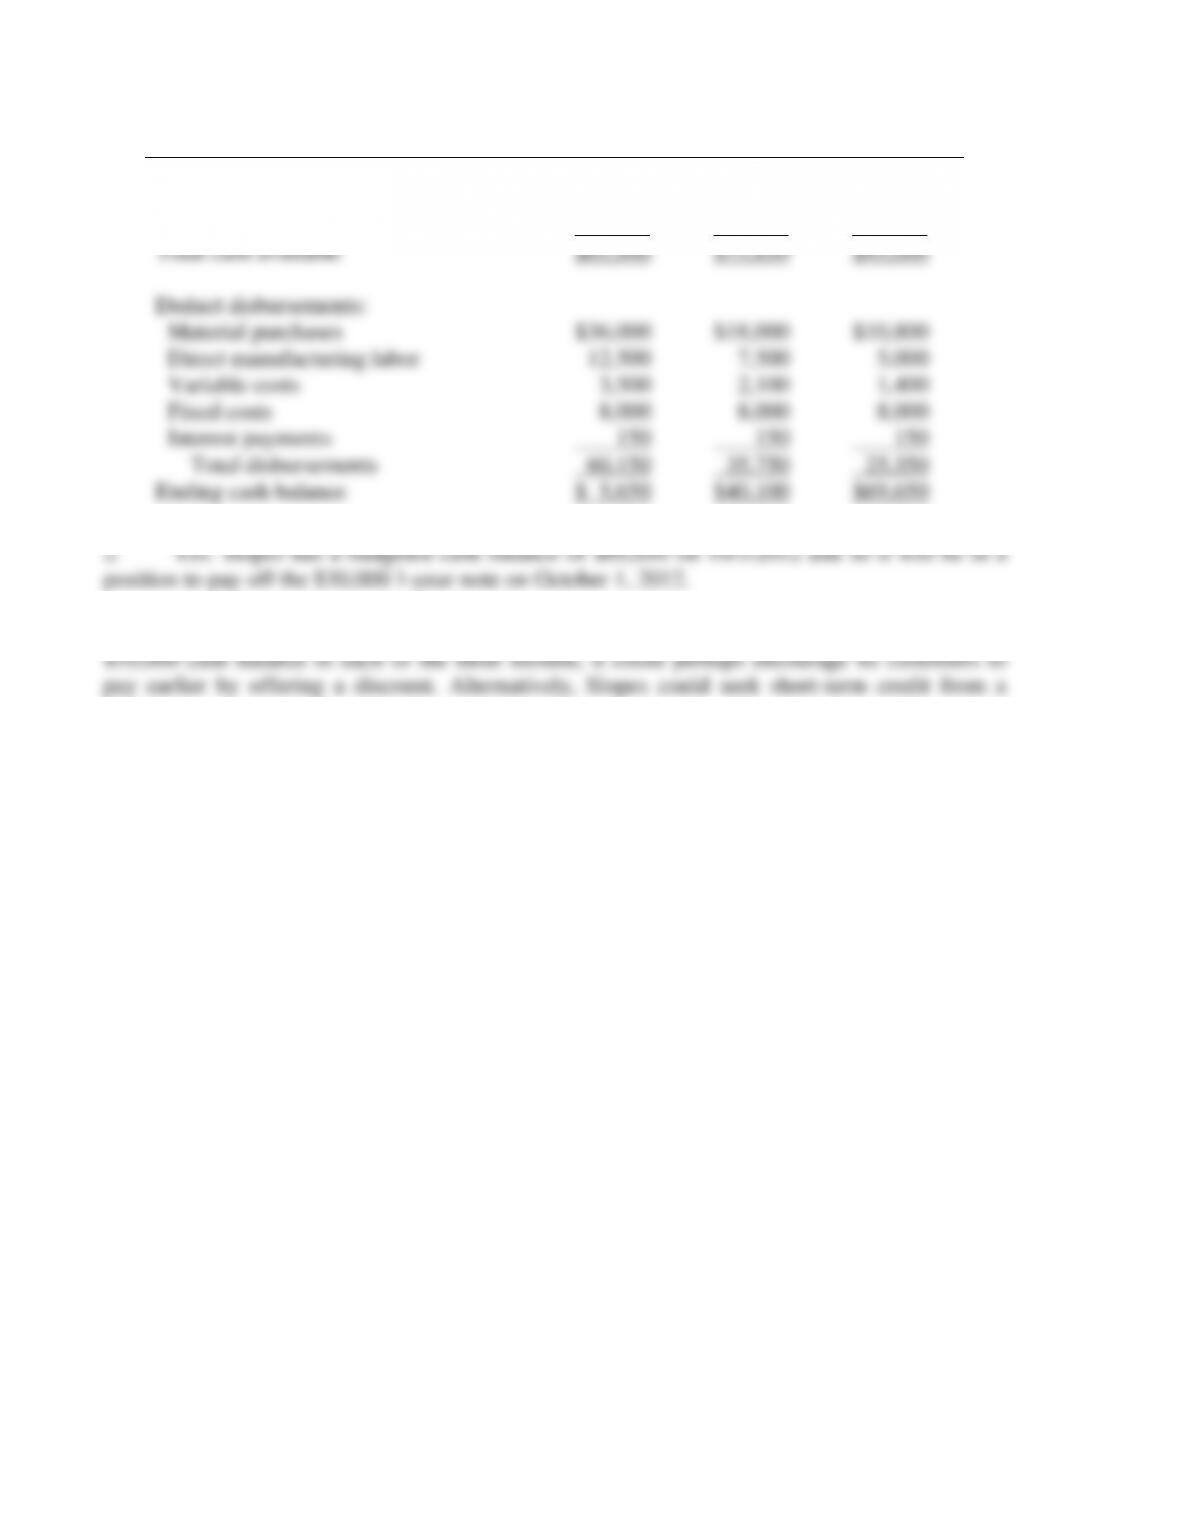
6-32
Cash Budget for the months of July, August, September 2012
July
August
September
Beginning cash balance
$10,000
$ 5,650
$40,100
Add receipts: Collection of receivables
55,800
70,200
54,900
Total cash available
$65,800
$75,850
$95,000
Deduct disbursements:
Material purchases
$36,000
$18,000
$10,800
Direct manufacturing labor
12,500
7,500
5,000
Variable costs
3,500
2,100
1,400
Fixed costs
8,000
8,000
8,000
Interest payments
150
150
150
Total disbursements
60,150
35,750
25,350
Ending cash balance
$ 5,650
$40,100
$69,650
3. No. Slopes does not maintain a $10,000 minimum cash balance in July. To maintain a
bank.
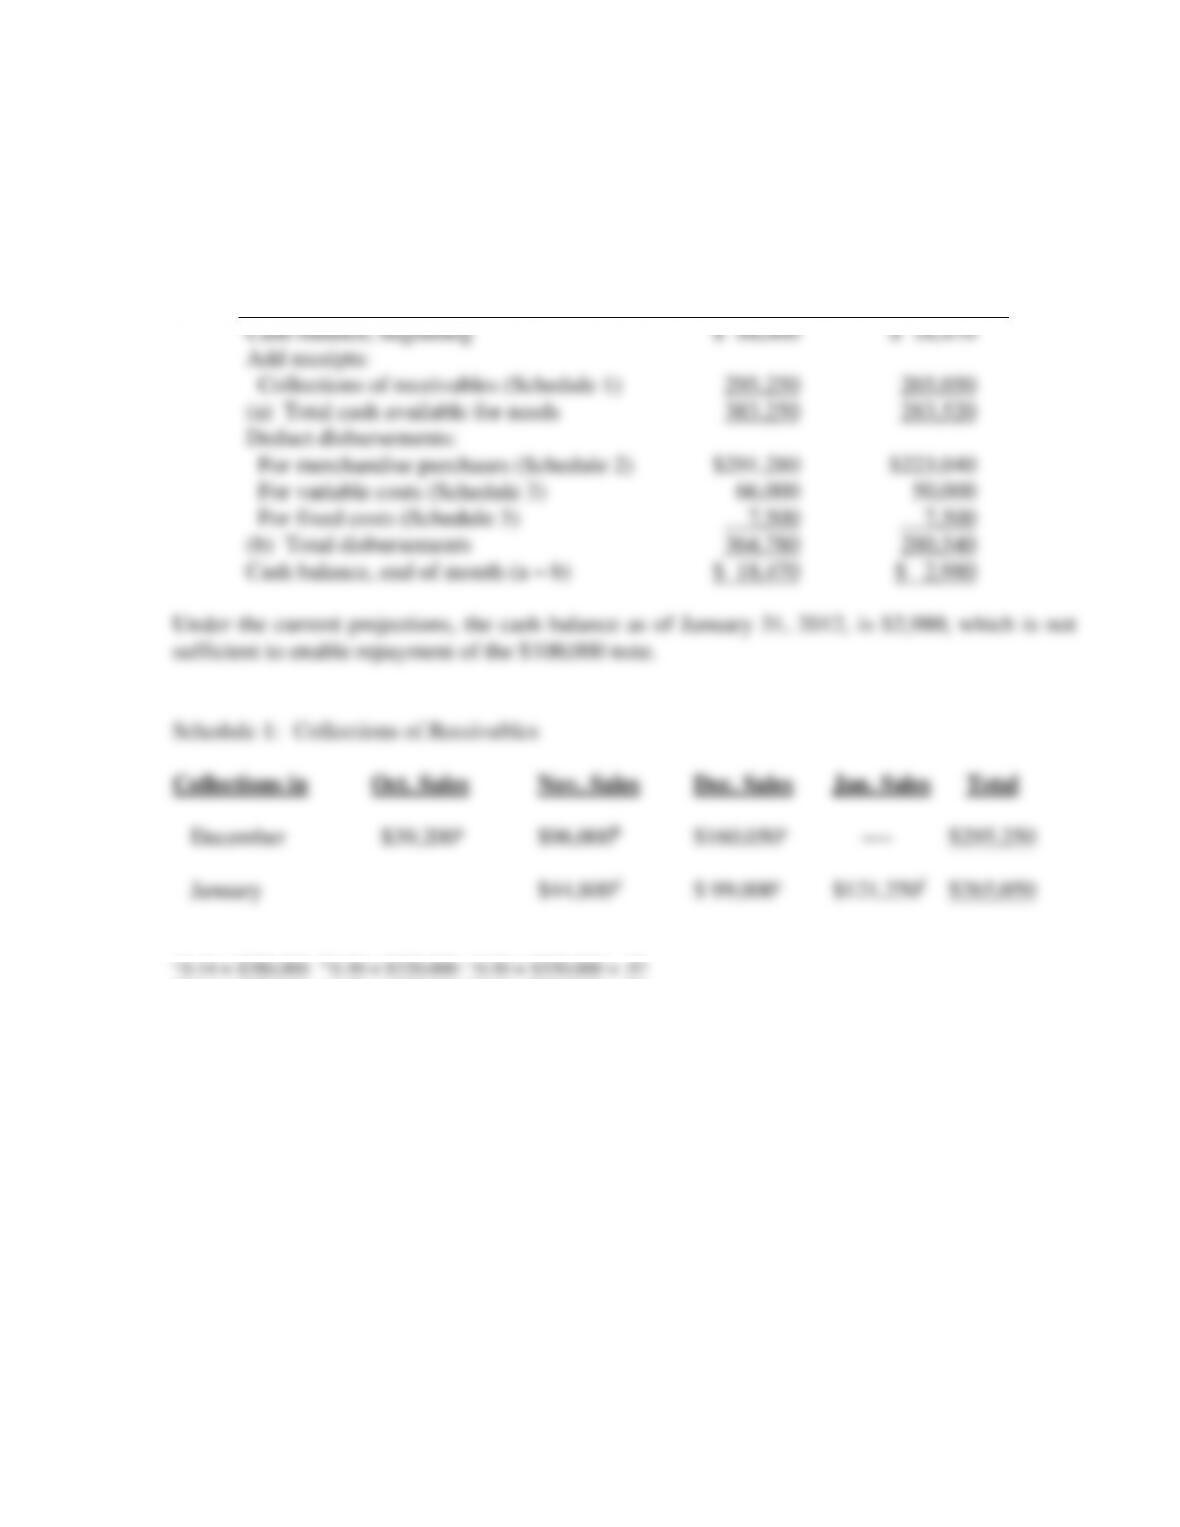
6-33
6-37 (40–50 min.) Cash budgeting.
Itami Wholesale Co.
Statement of Budgeted Cash Receipts and Disbursements
For the Months of December 2011 and January 2012
December 2011
January 2012
Cash balance, beginning
$ 88,000
$ 18,470
Add receipts:
Collections of receivables (Schedule 1)
295,250
265,050
(a) Total cash available for needs
383,250
283,520
Deduct disbursements:
For merchandise purchases (Schedule 2)
$291,280
$223,040
For variable costs (Schedule 3)
66,000
50,000
For fixed costs (Schedule 3)
7,500
7,500
(b) Total disbursements
364,780
280,540
Cash balance, end of month (a – b)
$ 18,470
$ 2,980
Under the current projections, the cash balance as of January 31, 2012, is $2,980, which is not
sufficient to enable repayment of the $100,000 note.
Schedule 1: Collections of Receivables
Collections in Oct. Sales Nov. Sales Dec. Sales Jan. Sales Total
December $39,200a $96,000b $160,050c —- $295,250
January $44,800d $ 99,000e $121,250f $265,050
a 0.14 × $280,000 b 0.30 × $320,000 c 0.50 × $330,000 × .97
d 0.14 × $320,000 e 0.30 × $330,000 f 0.50 × $250,000 × .97
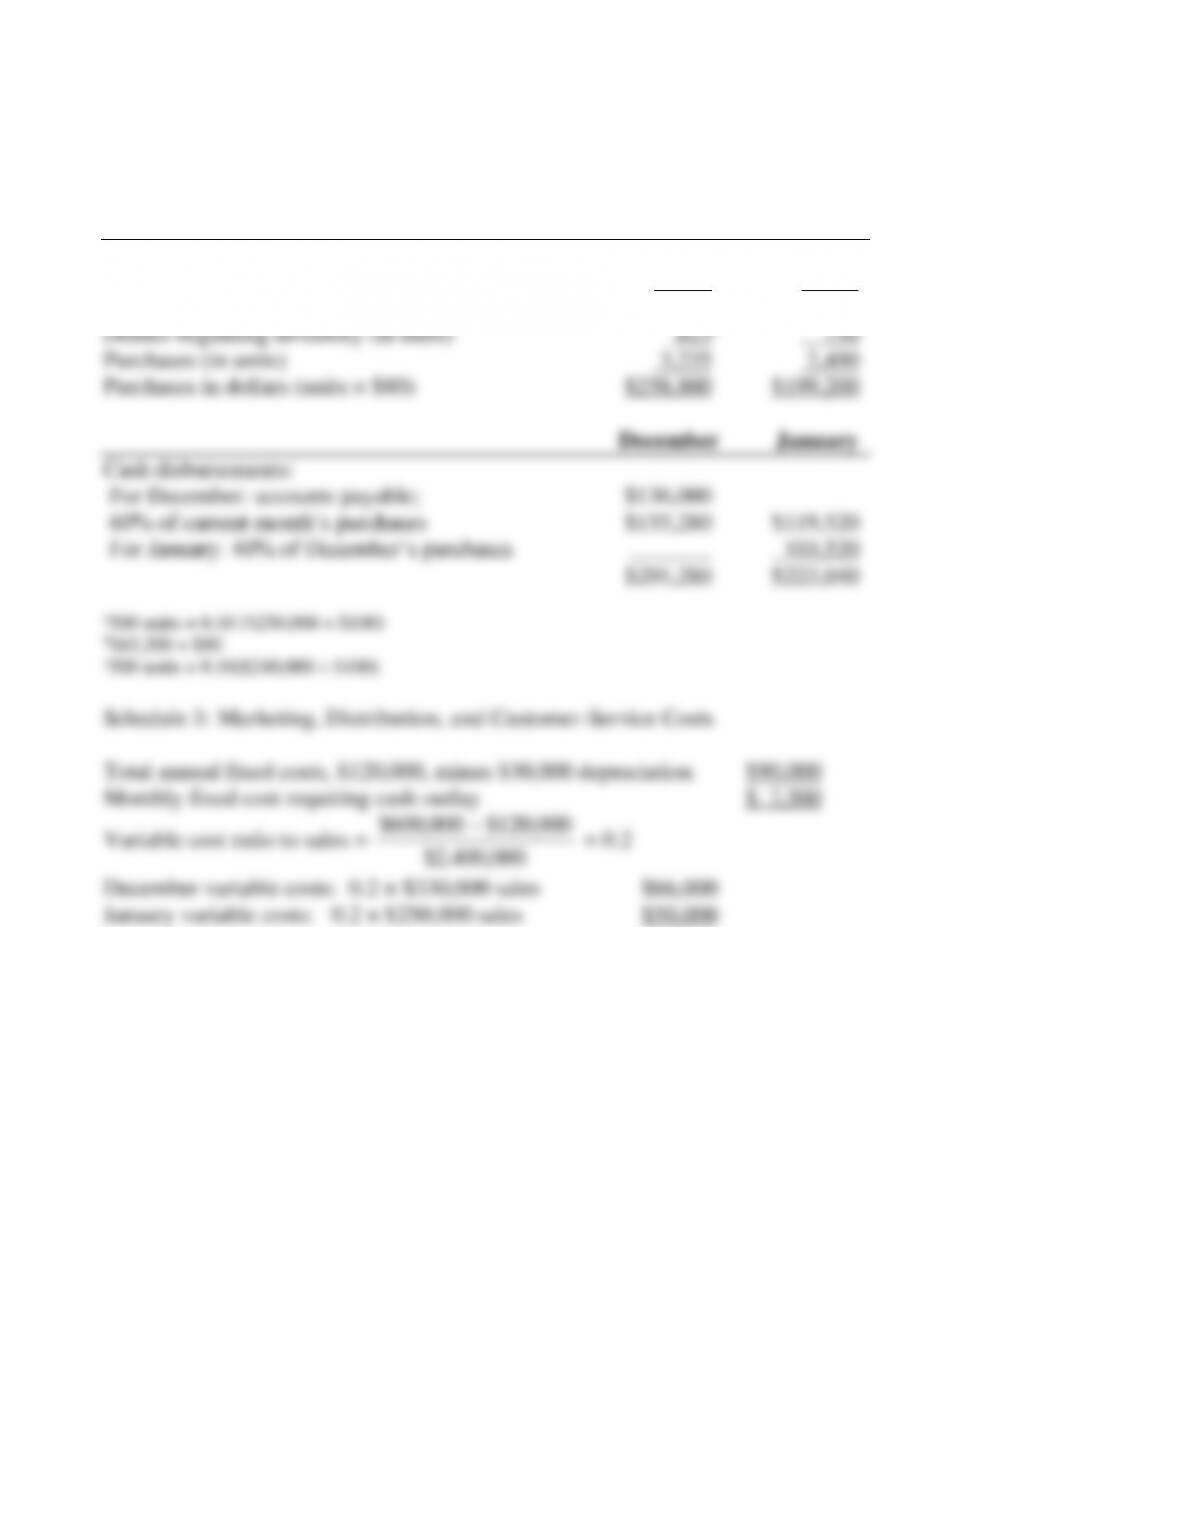
6-34
Schedule 2: Payments for Merchandise
December January
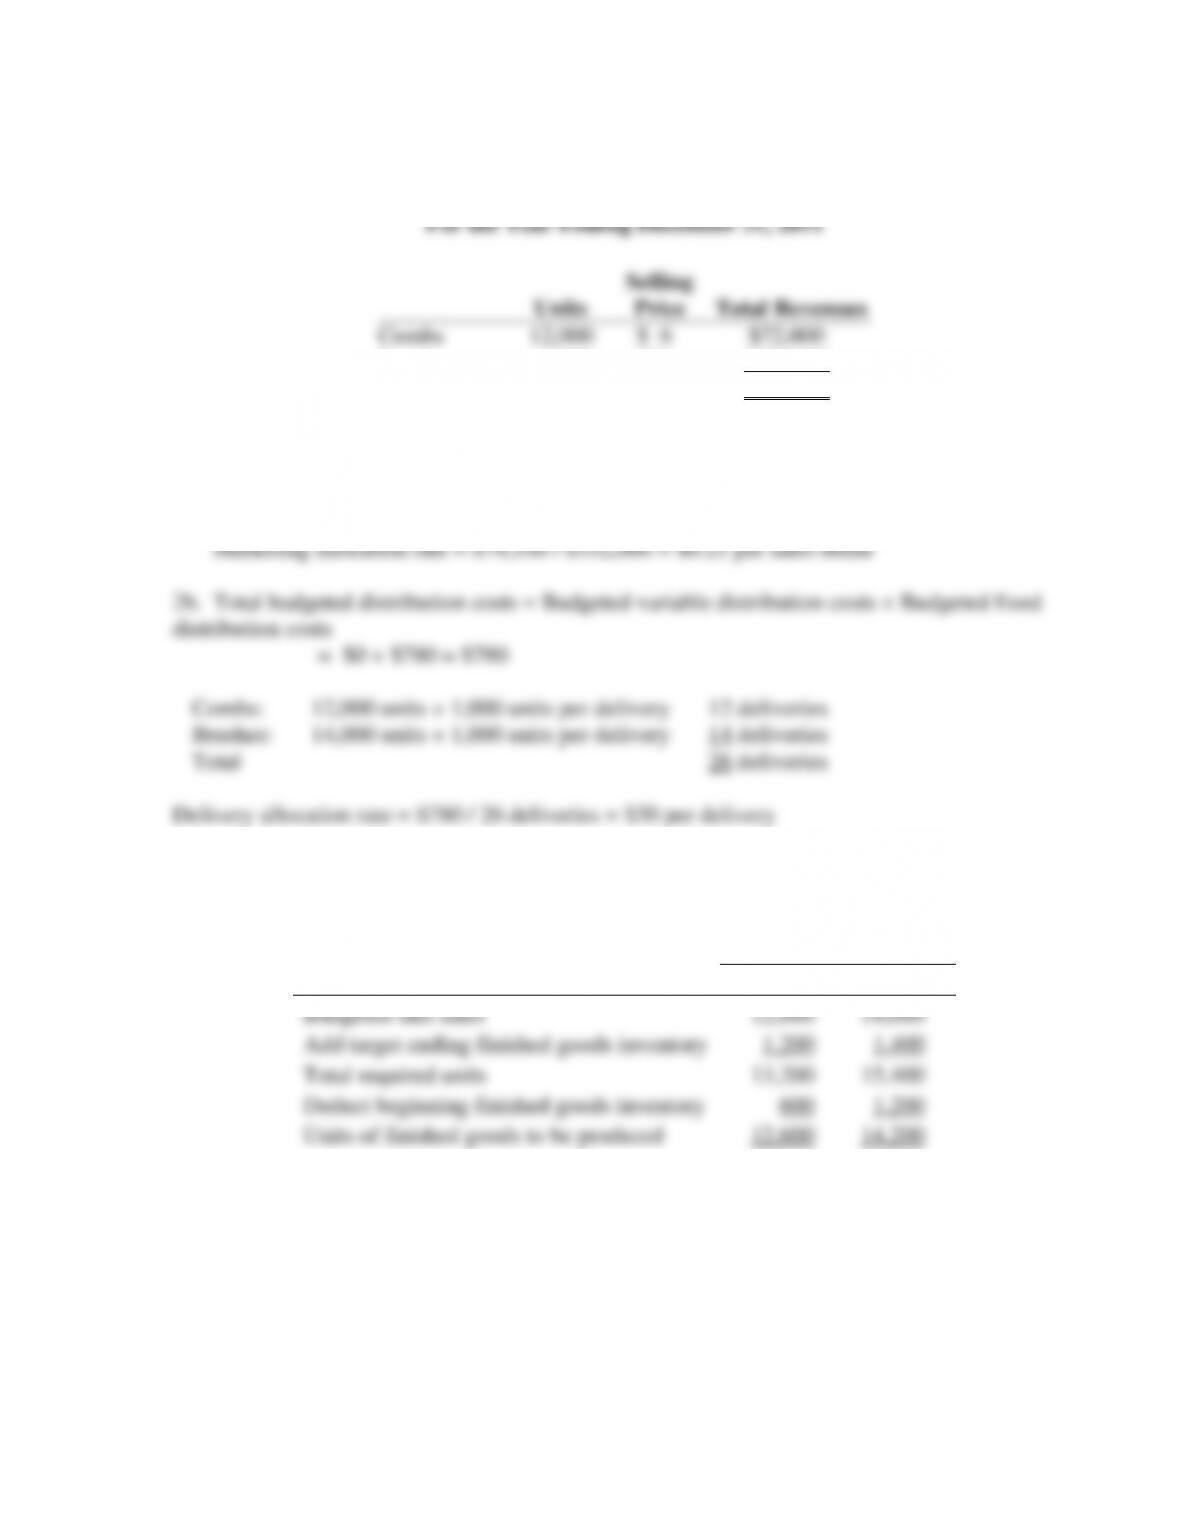
Target ending inventory (in units) 750a 740c
Add units sold (sales ÷ $100) 3,300 2,500
Total requirements 4,050 3,240
6-38 (60 min.) Comprehensive problem; ABC manufacturing, two products.
1.
Revenues Budget
For the Year Ending December 31, 2011
Units
Selling
Price
Total Revenues
Combs
12,000
$ 6
$72,000
Brushes
14.000
$20
$280,000
Total
$352,000
2a. Total budgeted marketing costs = Budgeted variable marketing costs + Budgeted fixed
marketing costs
= $14,100 + $60,000 = $74,100
12,000
14,000
13,200
15,400
12,600
6-36
4a.
Combs
Brushes
Total
Machine setup overhead
Units to be produced
12,600
14,200
Units per batch
÷200
÷100
Number of setups
63
142
Hours to setup per batch
×1/3
×1
Total setup hours
21
142
163
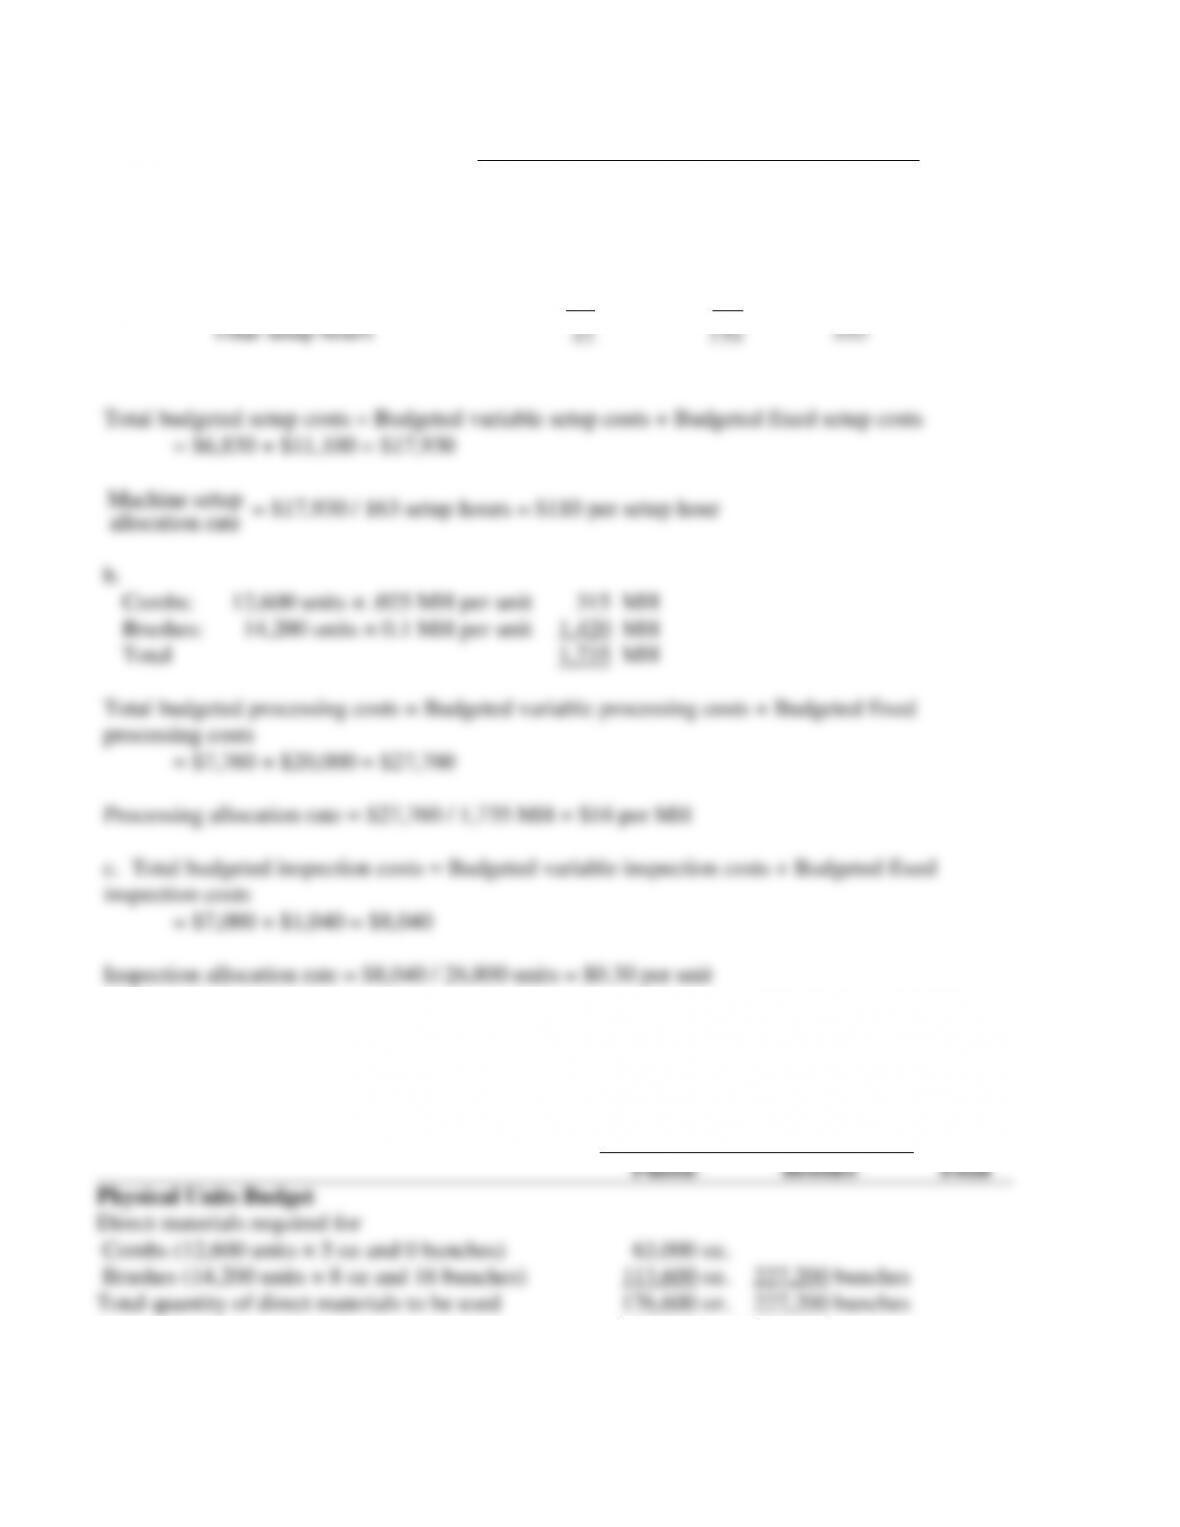
Total budgeted setup costs = Budgeted variable setup costs + Budgeted fixed setup costs
= $6,830 + $11,100 = $17,930
Machine setup
allocation rate
= $17,930 / 163 setup hours = $110 per setup hour
b.
Combs:
12,600 units × .025 MH per unit
315 MH
Brushes:
14,200 units × 0.1 MH per unit
1,420 MH
Total
1,735 MH
5.
Direct Material Usage Budget in Quantity and Dollars
For the Year Ending December 31, 2011
Material
Plastic
Bristles
Total
Physical Units Budget
Direct materials required for
Combs (12,600 units × 5 oz and 0 bunches)
63,000 oz.
Brushes (14,200 units × 8 oz and 16 bunches)
113,600 oz.
227,200 bunches
Total quantity of direct materials to be used
176,600 oz.
227,200 bunches
6-37
Cost Budget
Available from beginning direct materials inventory
(under a FIFO cost-flow assumption)
$ 304
$ 946
To be purchased this period
Plastic: (176,600 oz. ─ 1,600 oz) × $0.20 per oz.
35,000
Bristles: (227,200 bunches ─ 1,820) × $0.5 per bunch
______
112,690
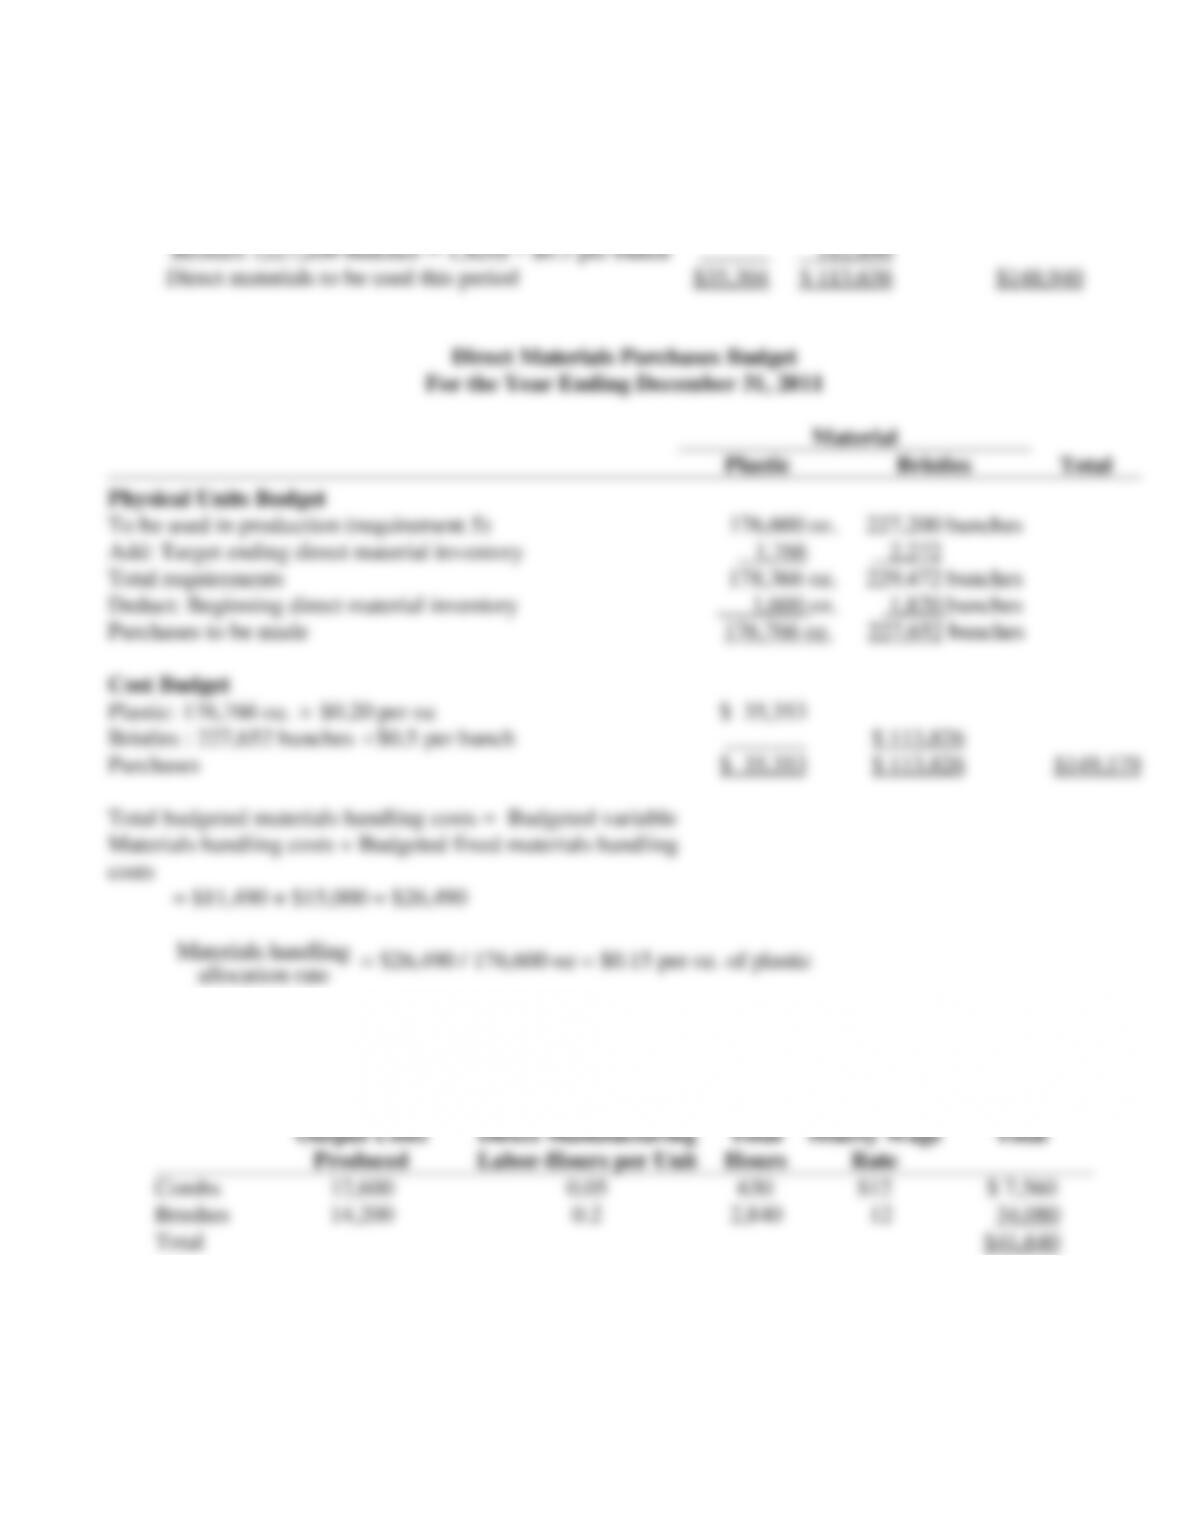
Direct materials to be used this period
$35,304
$ 113,636
$148,940
Direct Materials Purchases Budget
For the Year Ending December 31, 2011
Material
Plastic
Bristles
Total
Physical Units Budget
To be used in production (requirement 5)
176,600 oz.
227,200 bunches
Add: Target ending direct material inventory
1,766
2,272
Total requirements
178,366 oz.
229,472 bunches
Deduct: Beginning direct material inventory
1,600 oz.
1,820 bunches
Purchases to be made
176,766 oz.
227,652 bunches
Cost Budget
Plastic: 176,766 oz.
$0.20 per oz
$ 35,353
Bristles : 227,652 bunches
$0.5 per bunch
_______
$ 113,826
Purchases
$ 35,353
$ 113,826
$149,179
Total budgeted materials handling costs = Budgeted variable
Materials handling costs + Budgeted fixed materials handling
costs
allocation rate
7.
Direct Manufacturing Labor Costs Budget
For the Year Ending December 31, 2011
Output Units
Direct Manufacturing
Total
Hourly Wage
Total
Produced
Labor-Hours per Unit
Hours
Rate
Combs
12,600
0.05
630
$12
$ 7,560
Brushes
14,200
0.2
2,840
12
34,080
Total
$41,640
6-38
8.
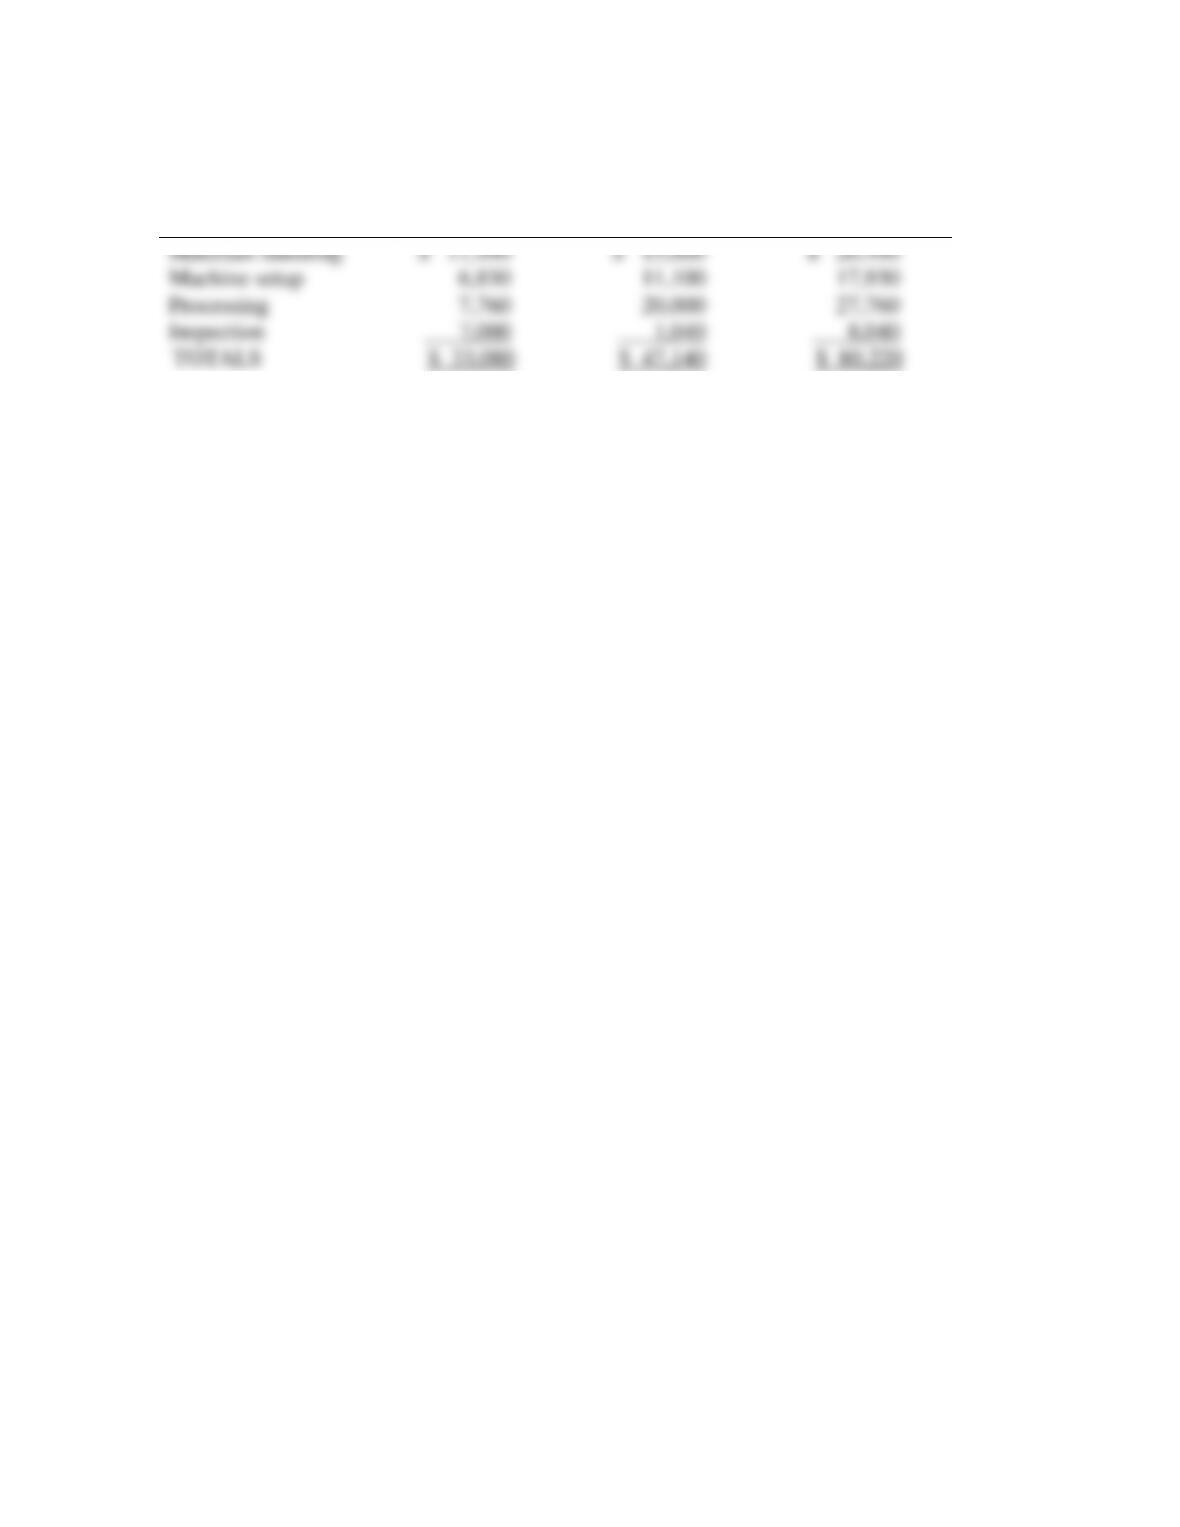
Manufacturing Overhead Cost Budget
For the Year Ending December 31, 2011
Variable
Fixed
Total
Materials handling
$ 11,490
$ 15,000
$ 26,490
Machine setup
6,830
11,100
17,930
Processing
7,760
20,000
27,760
Inspection
7,000
1,040
8,040
TOTALS $ 33,080 $ 47,140 $ 80,220
6-39
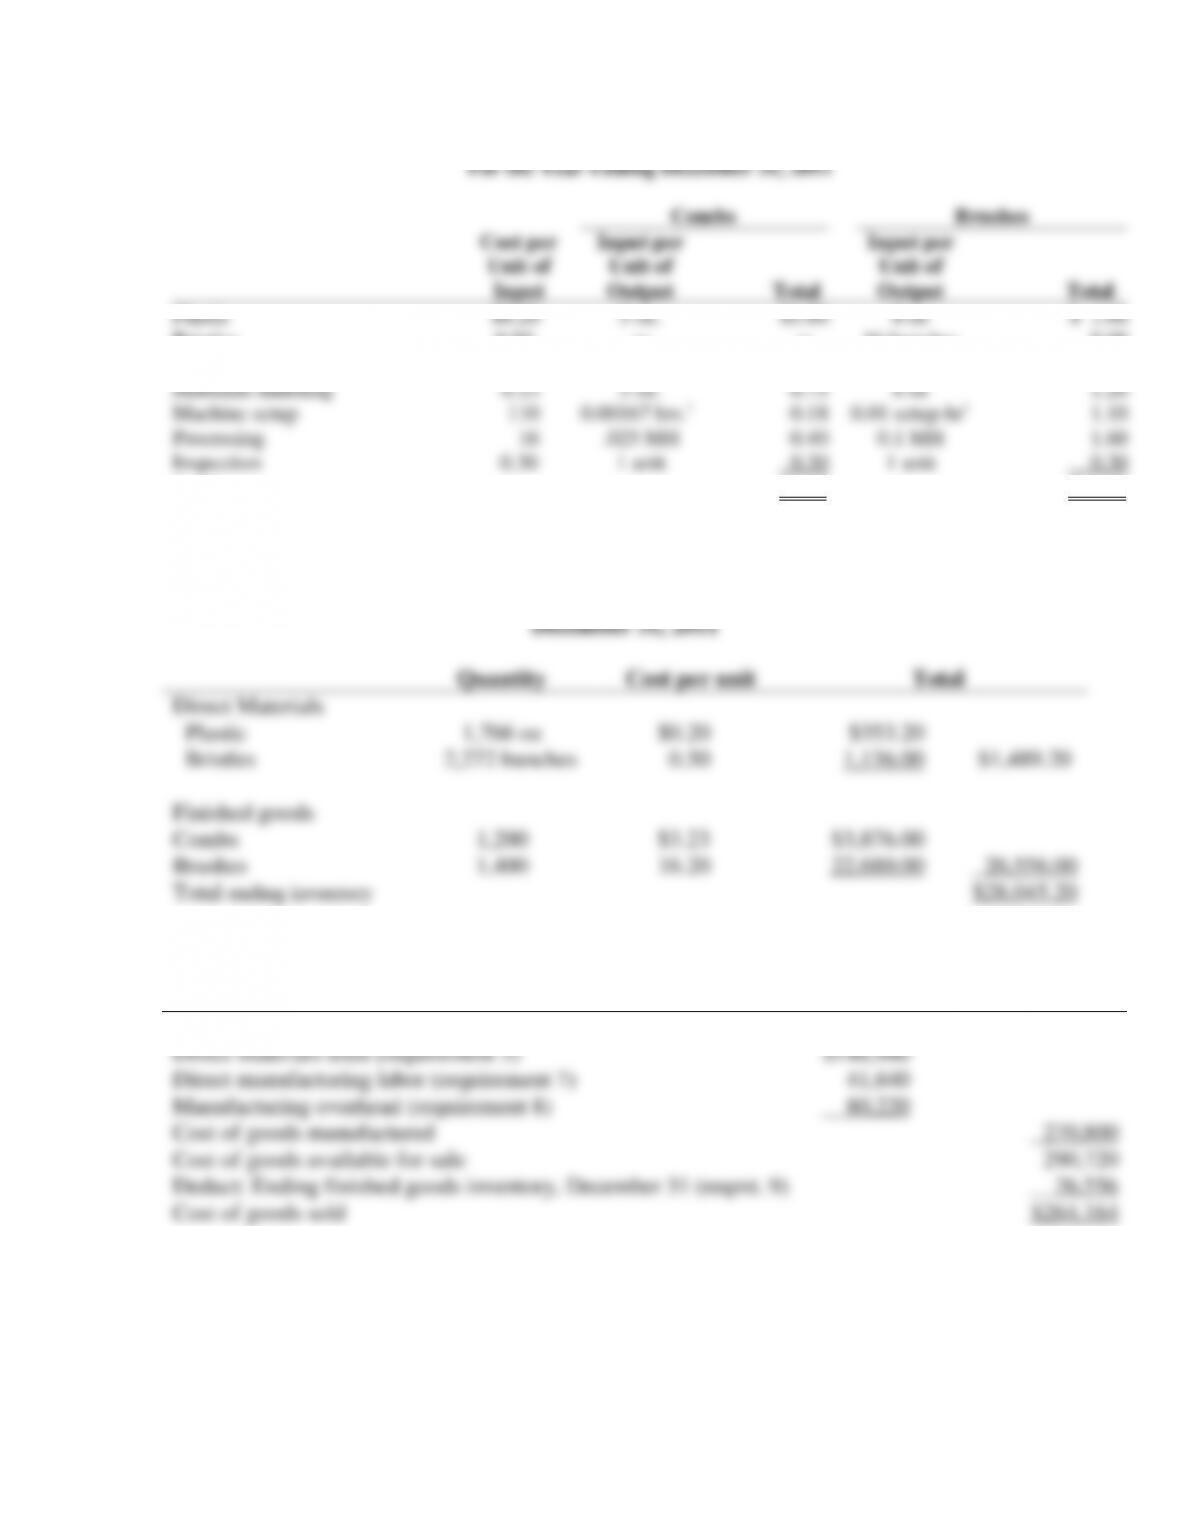
9.
Unit Costs of Ending Finished Goods Inventory
For the Year Ending December 31, 2011
Combs
Brushes
Cost per
Input per
Input per
Unit of
Input
Unit of
Output
Total
Unit of
Output
Total
Plastic
$0.20
5 oz.
$1.00
8 oz
$ 1.60
Bristles
0.50
─
─
16 bunches
8.00
Direct manufacturing labor
12
.05 hrs.
0.60
0.2 hour
2.40
Materials handling
0.15
5 oz.
0.75
8 oz
1.20
Machine setup
110
0.00167 hrs.1
0.18
0.01 setup-hr1
1.10
Processing
16
.025 MH
0.40
0.1 MH
1.60
Inspection
0.30
1 unit
0.30
1 unit
0.30
Totals
$3.23
$16.20
1 21 setup–hours ÷ 12,600 units = 0.00167 hours per unit; 142 setup hours ÷ 14,200 units = 0.01 hours per unit
Ending Inventories Budget
December 31, 2011
Quantity
Cost per unit
Total
Direct Materials
Plastic
1,766 oz
$0.20
$353.20
Bristles
2,272 bunches
0.50
1,136.00
$1,489.20
Finished goods
Combs
1,200
$3.23
$3,876.00
Brushes
1,400
16.20
22,680.00
26,556.00
Total ending inventory
$28,045.20
10.
Cost of Goods Sold Budget
For the Year Ending December 31, 2011
Beginning finished goods inventory, Jan. 1 ($1,800 + $18,120)
$ 19,920
Direct materials used (requirement 5)
$148,940
Direct manufacturing labor (requirement 7)
41,640
Manufacturing overhead (requirement 8)
80,220
Cost of goods manufactured
270,800
Cost of goods available for sale
290,720
Deduct: Ending finished goods inventory, December 31 (reqmt. 9)
26,556
Cost of goods sold
$264,164