6-1
6-1 The budgeting cycle includes the following elements:
a. Planning the performance of the company as a whole as well as planning the performance
6-2 The master budget expresses management’s operating and financial plans for a specified
6-3 Strategy, plans, and budgets are interrelated and affect one another. Strategy specifies
how an organization matches its own capabilities with the opportunities in the marketplace to
plans.
6-4 We agree that budgeted performance is a better criterion than past performance for
6-5 Production and marketing traditionally have operated as relatively independent business
functions. Budgets can assist in reducing conflicts between these two functions in two ways.
6-6 In many organizations, budgets impel managers to plan. Without budgets, managers drift
test.
6-7 A rolling budget, also called a continuous budget, is a budget or plan that is always
6-2
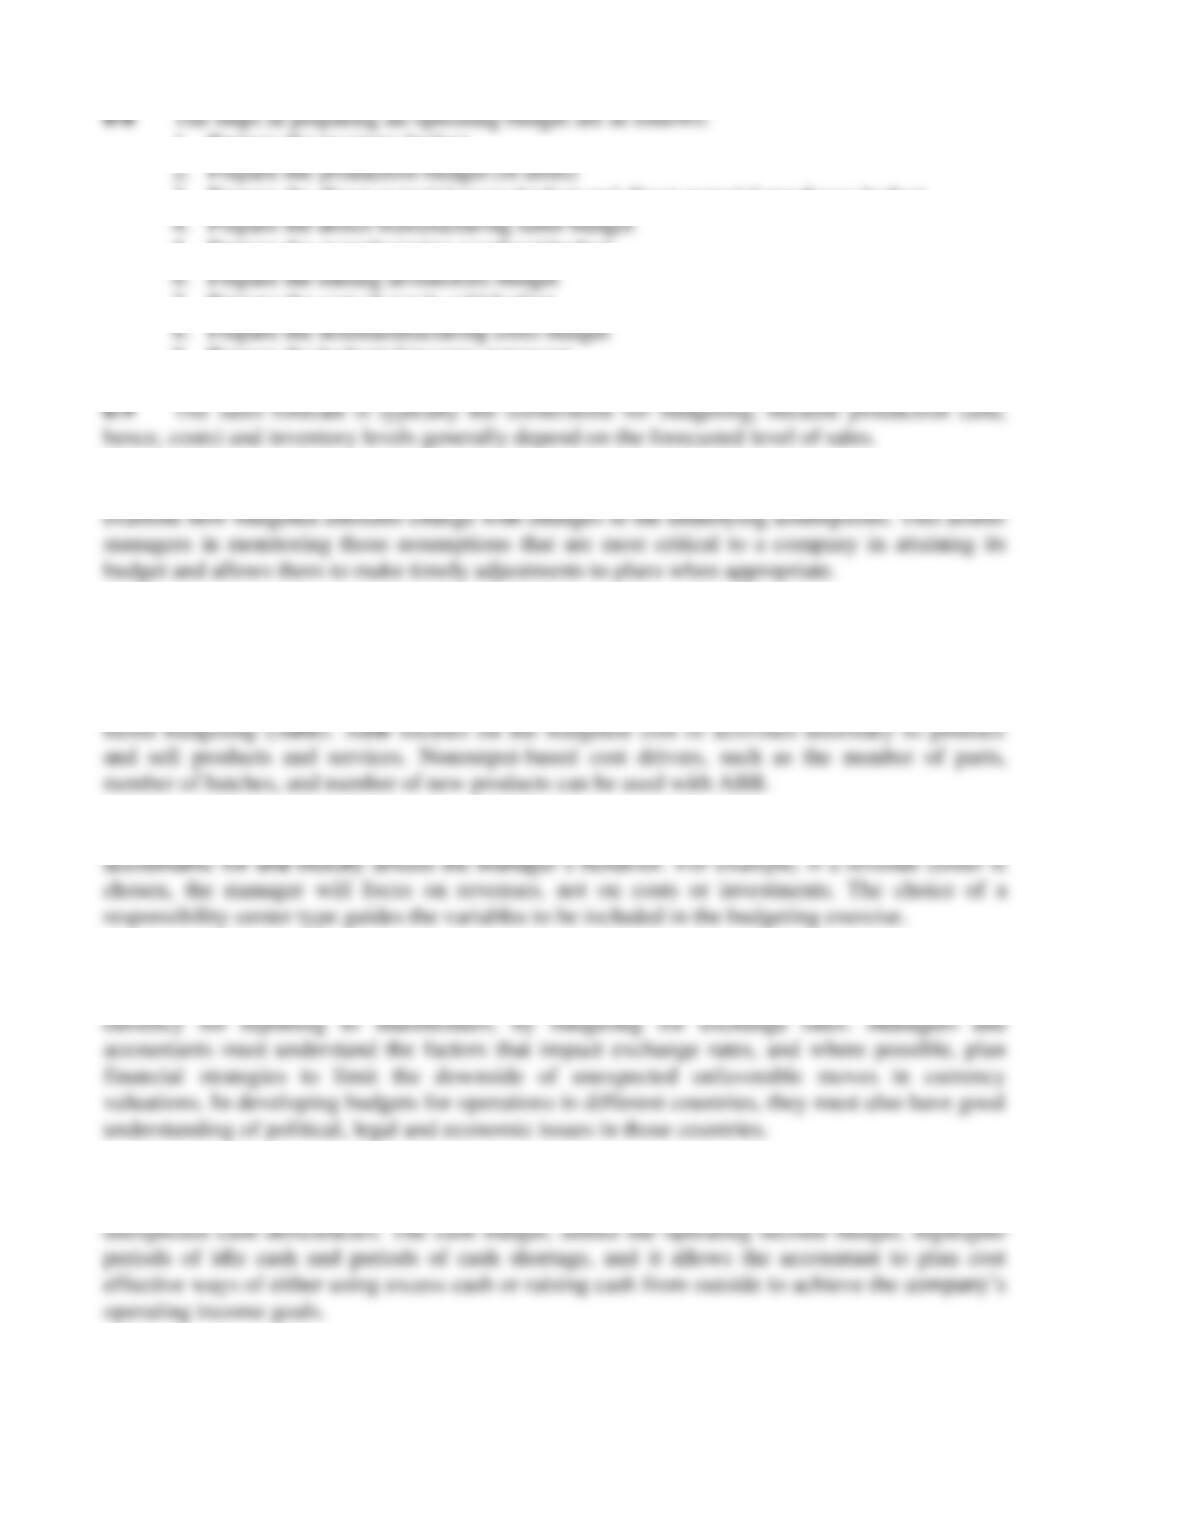
1. Prepare the revenues budget
3. Prepare the direct material usage budget and direct material purchases budget
5. Prepare the manufacturing overhead budget
7. Prepare the cost of goods sold budget
9. Prepare the budgeted income statement
6-10 Sensitivity analysis adds an extra dimension to budgeting. It enables managers to
6-11 Kaizen budgeting explicitly incorporates continuous improvement anticipated during the
budget period into the budget numbers.
6-12 Nonoutput-based cost drivers can be incorporated into budgeting by the use of activity–
6-13 The choice of the type of responsibility center determines what the manager is
6-14 Budgeting in multinational companies may involve budgeting in several different foreign
currencies. Further, management accountants must translate operating performance into a single
6-15 No. Cash budgets and operating income budgets must be prepared simultaneously. In
preparing their operating income budgets, companies want to avoid unnecessary idle cash and
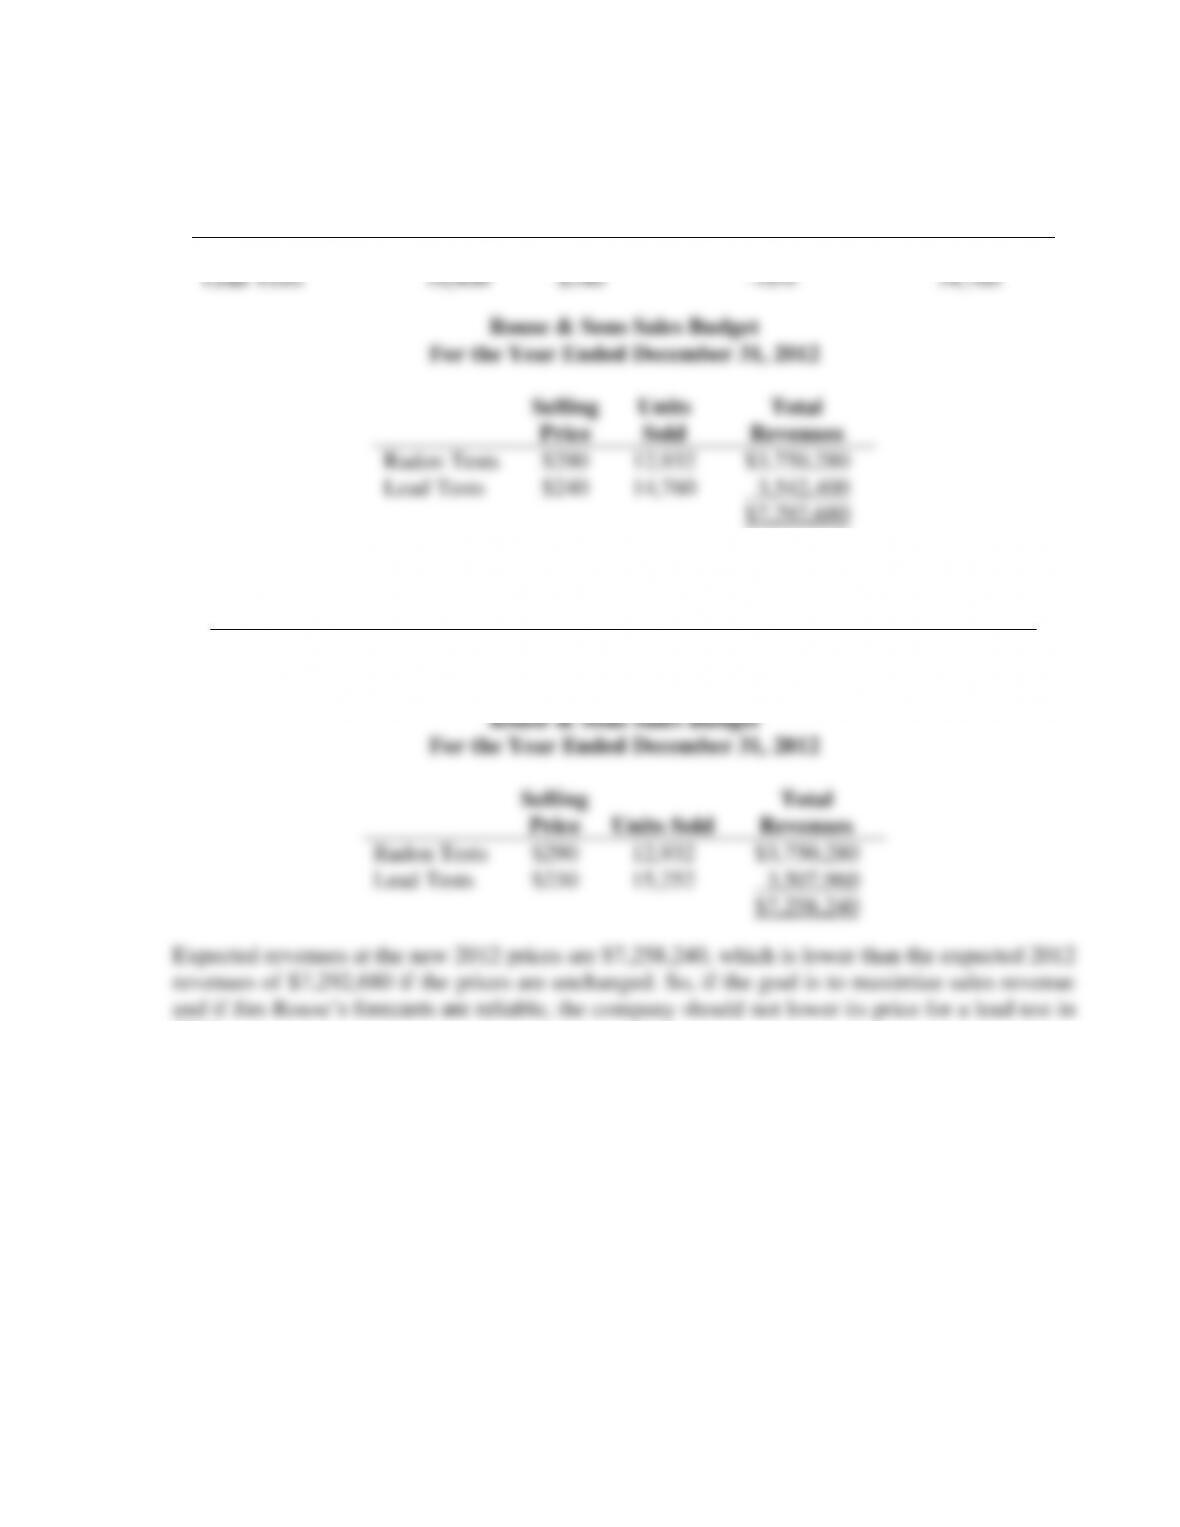
6-16 (15 min.) Sales budget, service setting.
1.
Rouse & Sons
2011
Volume
At 2011
Selling Prices
Expected 2012
Change in Volume
Expected 2012
Volume
Radon Tests
12,200
$290
+6%
12,932
Lead Tests
16,400
$240
-10%
14,760
Radon Tests
$3,750,280
Lead Tests
$7,292,680
2011
Radon Tests
$290
Lead Tests
$230
-7%
Radon Tests
6-4
6-17 (5 min.) Sales and production budget.
Budgeted sales in units 200,000
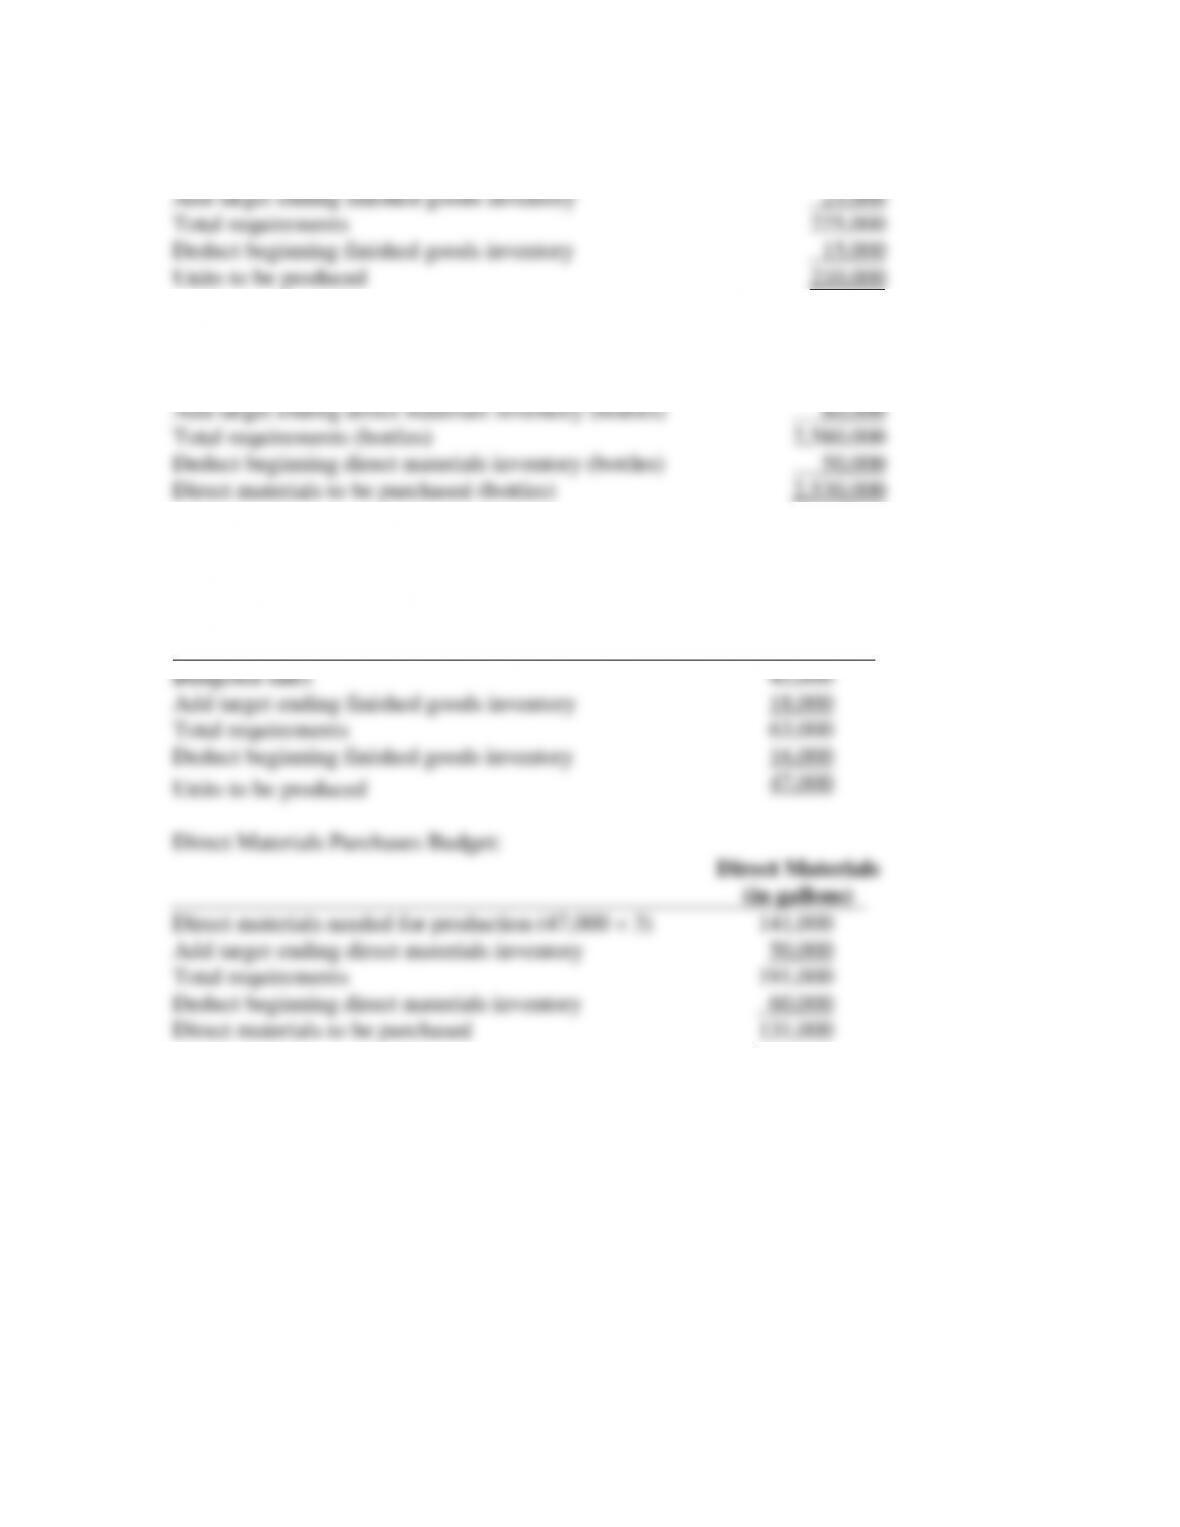
6-18 (5 min.) Direct materials purchases budget.
Direct materials to be used in production (bottles) 2,500,000
6-19 (10 min.) Budgeting material purchases.
Production Budget:
Finished Goods
(units)
6-5
6-20 (30 min.) Revenues and production budget.
1.
Selling
Price
Units
Sold
Total
Revenues
12-ounce bottles
$0.25
4,800,000a
$1,200,000
4-gallon units
1.50
1,200,000b
1,800,000
$3,000,000
a 400,000 × 12 months = 4,800,000
b 100,000 × 12 months = 1,200,000
2. Budgeted unit sales (12-ounce bottles) 4,800,000
Add target ending finished goods inventory 600,000
3.
Beginning Budgeted Target Budgeted
= +
inventory sales ending inventory production
−
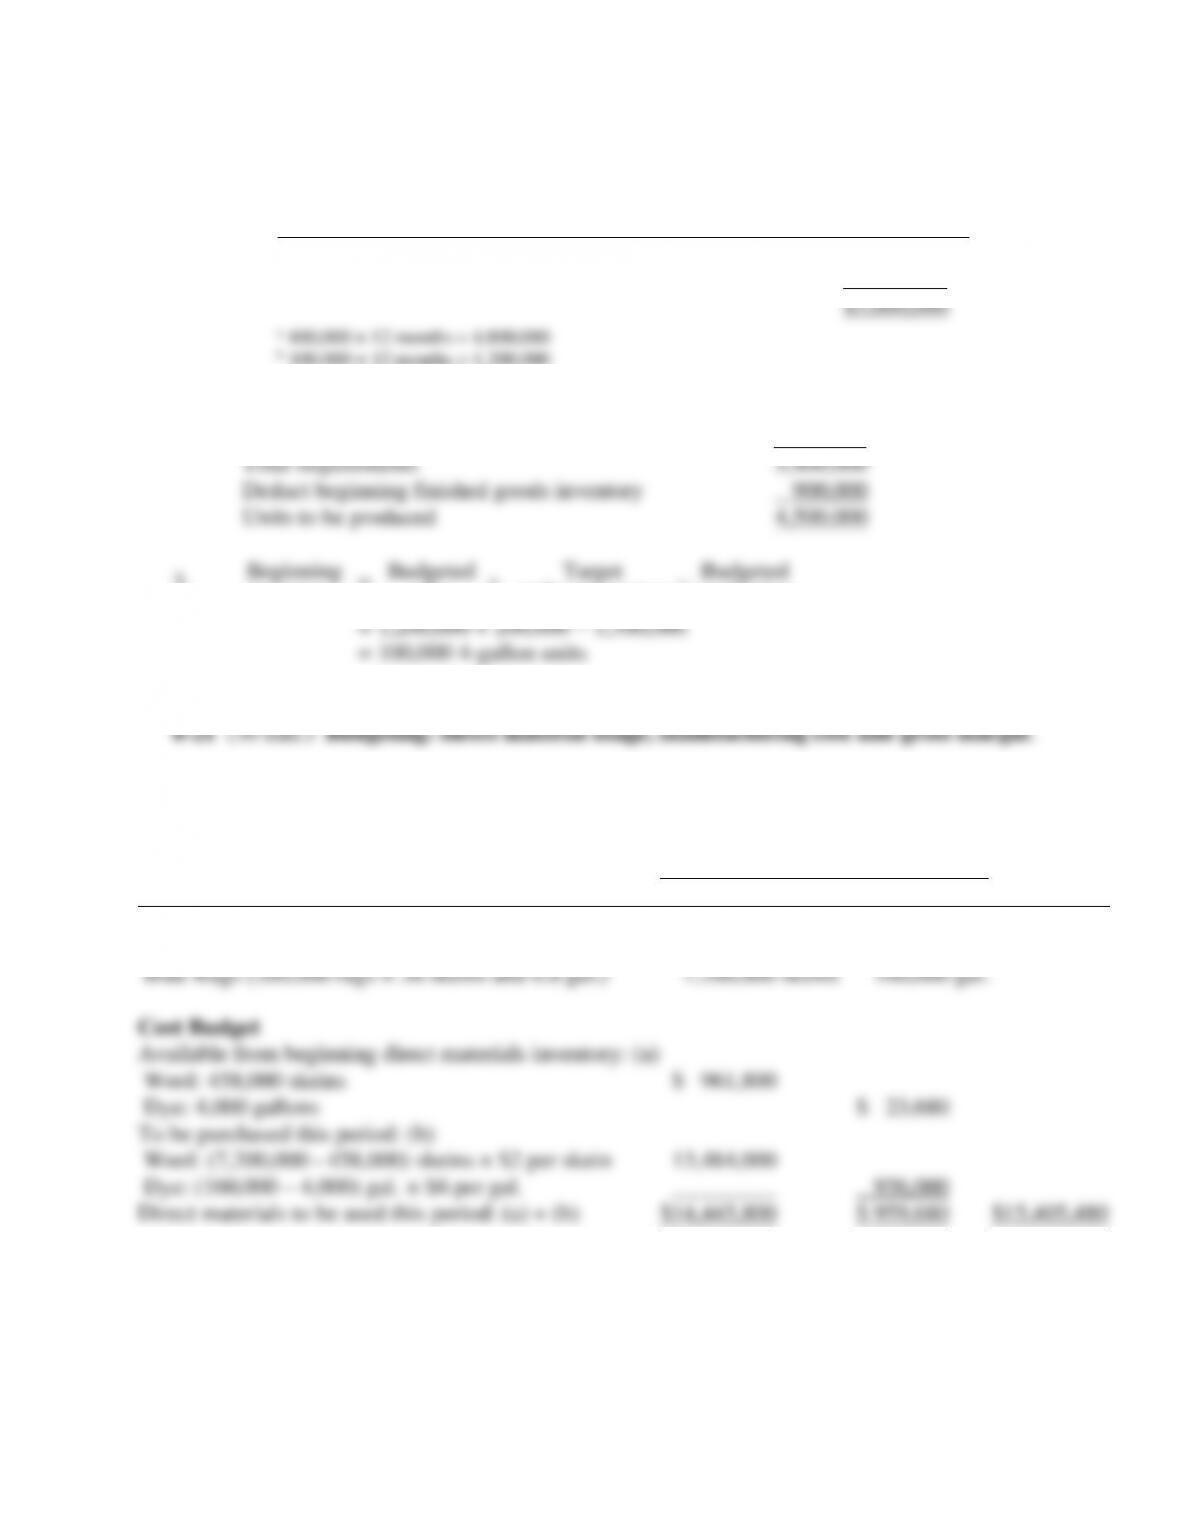
1.
Direct Material Usage Budget in Quantity and Dollars
Material
Wool
Dye
Total
Physical Units Budget
Direct materials required for
Blue Rugs (200,000 rugs × 36 skeins and 0.8 gal.)
7,200,000 skeins
160,000 gal.
Cost Budget
Available from beginning direct materials inventory: (a)
Wool: 458,000 skeins
$ 961,800
Dye: 4,000 gallons
$ 23,680
To be purchased this period: (b)
Wool: (7,200,000 – 458,000) skeins × $2 per skein
13,484,000
Dye: (160,000 – 4,000) gal. × $6 per gal.
_________
936,000
Direct materials to be used this period: (a) + (b)
$14,445,800
$ 959,680
$15,405,480
6-6
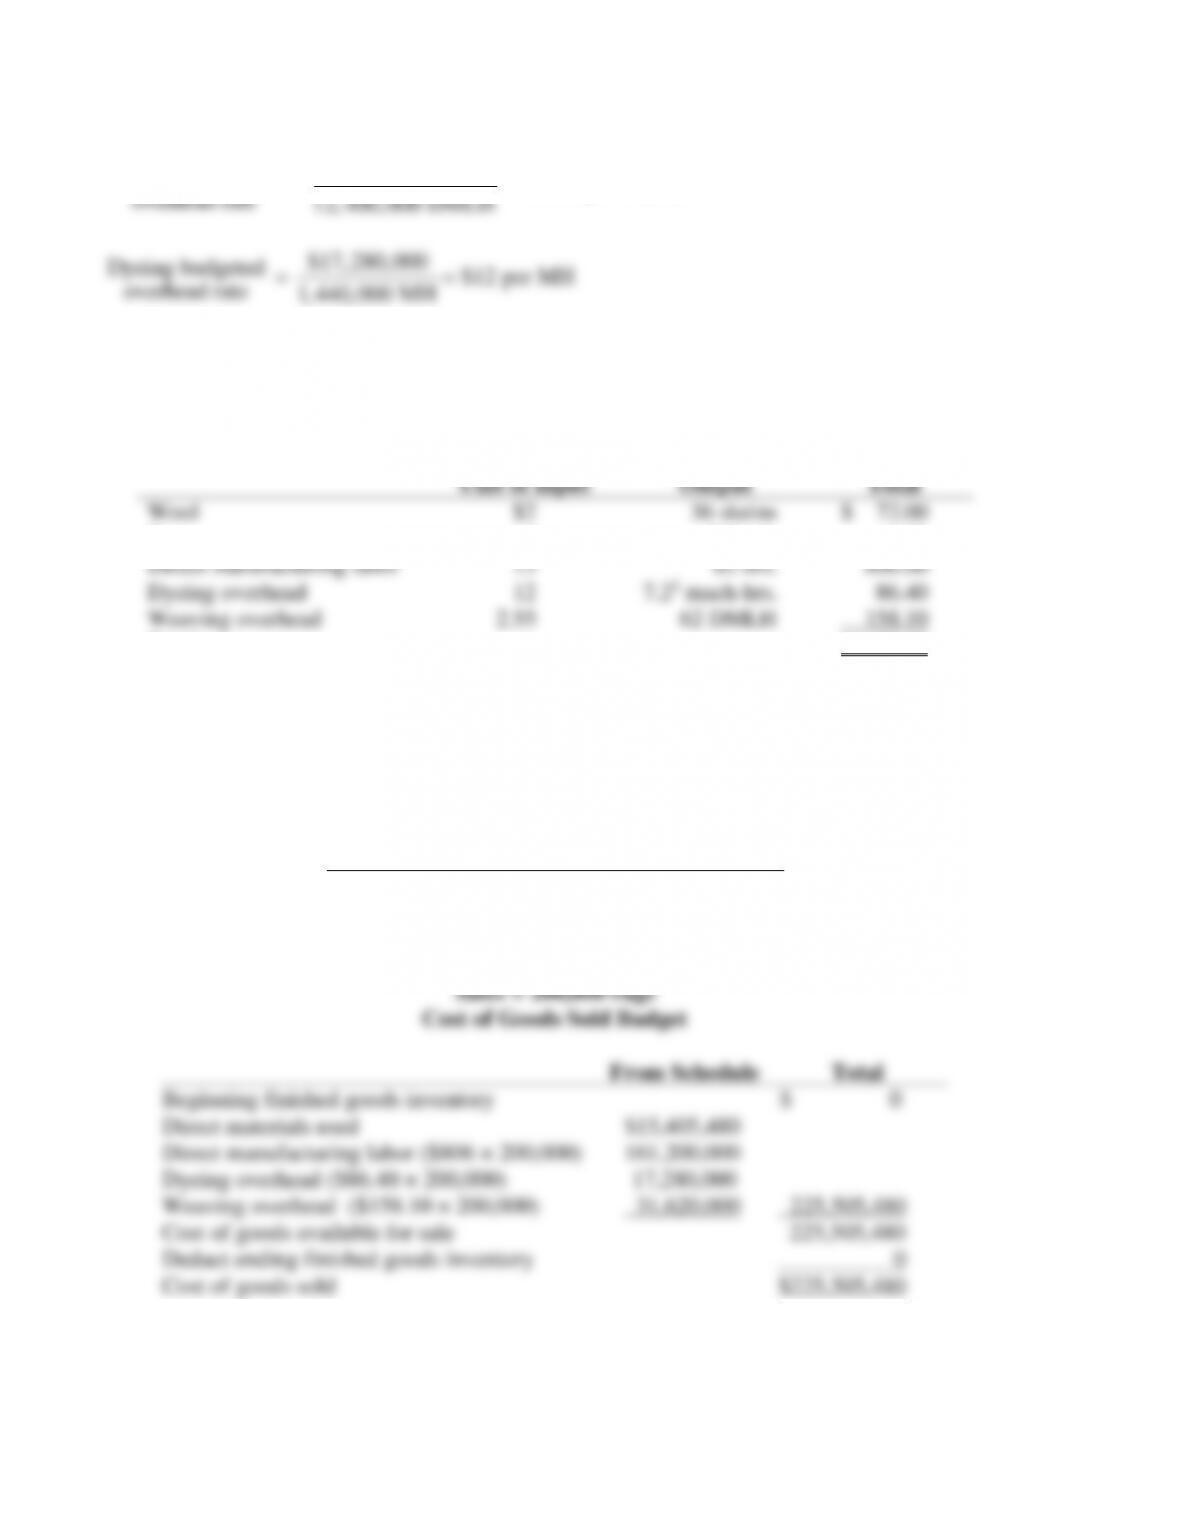
2.
Weaving budgeted
overhead rate
=
$31,620,000
12,400,000 DMLH
= $2.55 per DMLH
overhead rate
1,440,000 MH
3.
Budgeted Unit Cost of Blue Rug
Cost per
Unit of Input
Input per
Unit of
Output
Total
Wool
$2
36 skeins
$ 72.00
Dye
6
0.8 gal.
4.80
Direct manufacturing labor
13
62 hrs.
806.00
Dyeing overhead
12
7.21 mach-hrs.
86.40
Weaving overhead
2.55
62 DMLH
158.10
Total
$1127.30
10.2 machine hour per skein
36 skeins per rug = 7.2 machine-hrs. per rug.
4.
Revenue Budget
Units
Selling
Price
Total Revenues
Blue Rugs
200,000
$2,000
$400,000,000
Blue Rugs
185,000
$2,000
$370,000,000
5a.
Sales = 200,000 rugs
Cost of Goods Sold Budget
From Schedule
Total
Beginning finished goods inventory
$ 0
Direct materials used
$15,405,480
Direct manufacturing labor ($806 × 200,000)
161,200,000
Dyeing overhead ($86.40 × 200,000)
17,280,000
Weaving overhead ($158.10 × 200,000)
31,620,000
225,505,480
Cost of goods available for sale
225,505,480
Deduct ending finished goods inventory
0
Cost of goods sold
$225,505,480
6-7
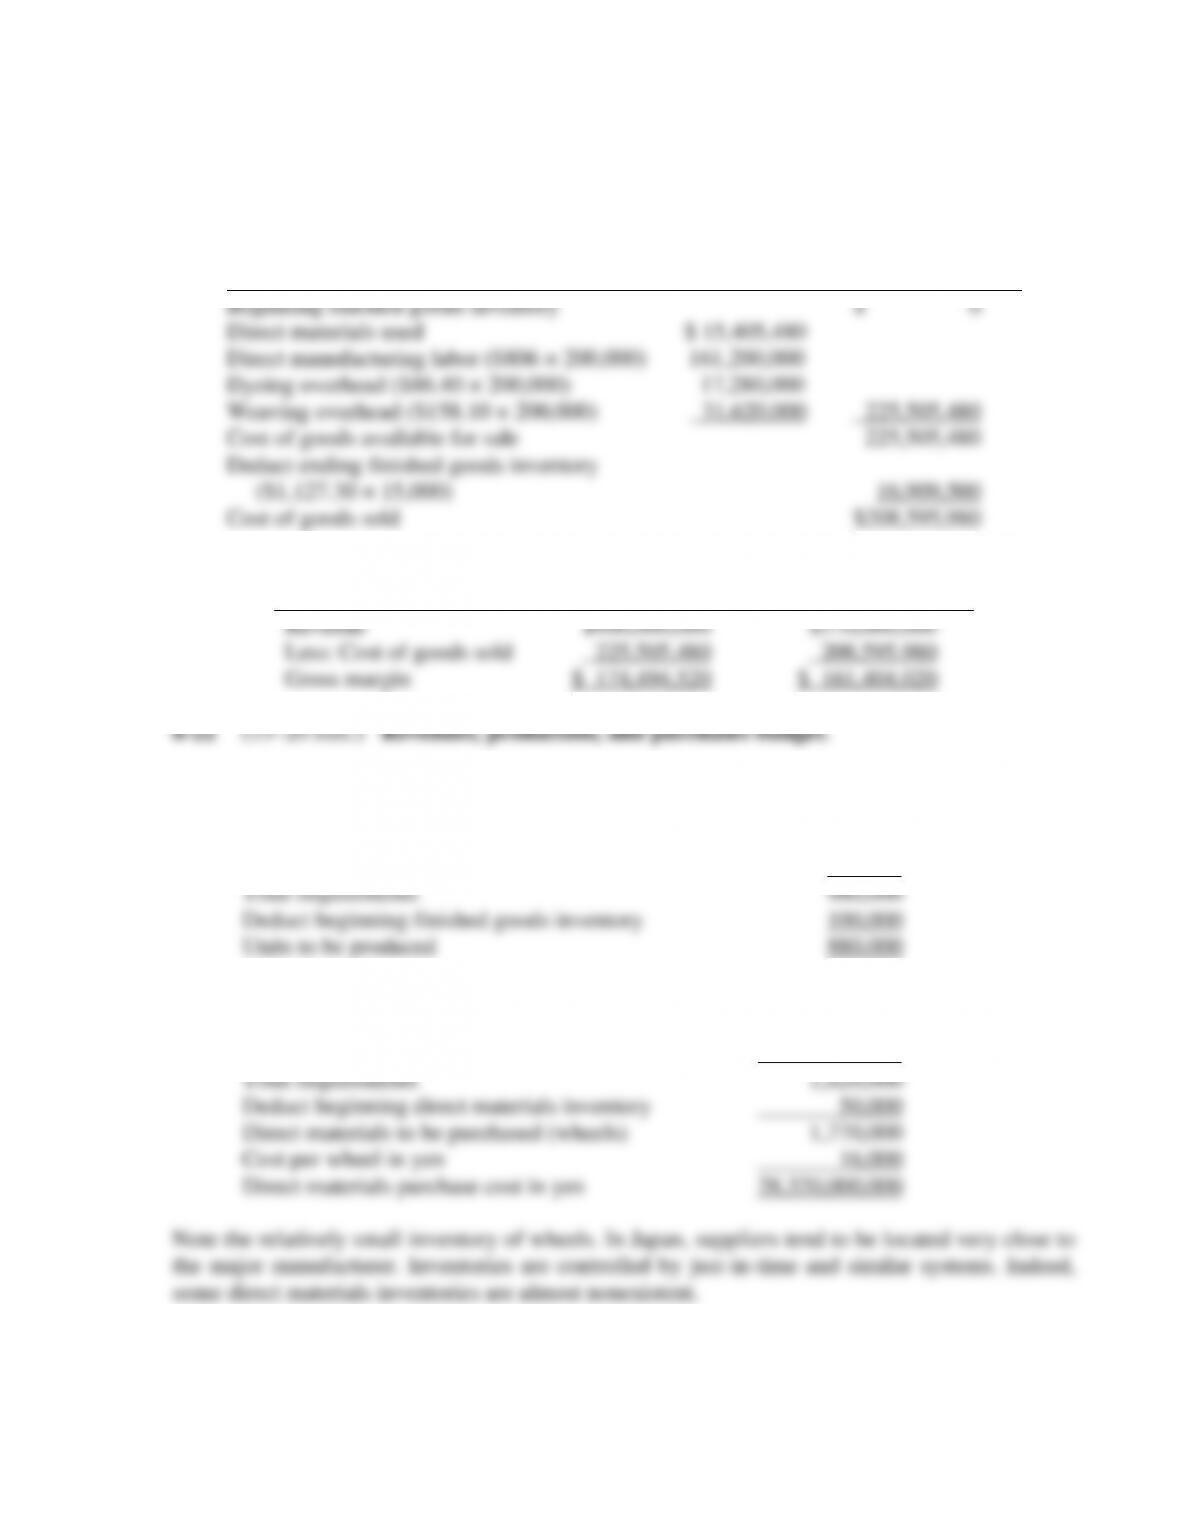
5b.
Sales = 185,000 rugs
Cost of Goods Sold Budget
From Schedule
Total
Beginning finished goods inventory
$ 0
Direct materials used
$ 15,405,480
Direct manufacturing labor ($806 × 200,000)
161,200,000
Dyeing overhead ($86.40 × 200,000)
17,280,000
Weaving overhead ($158.10 × 200,000)
31,620,000
225,505,480
Cost of goods available for sale
225,505,480
Deduct ending finished goods inventory
($1,127.30 × 15,000)
16,909,500
Cost of goods sold
$208,595,980
6.
200,000 rugs sold
185,000 rugs sold
Revenue
$400,000,000
$370,000,000
Less: Cost of goods sold
225,505,480
208,595,980
Gross margin
$ 174,494,520
$ 161,404,020
1. 900,000 motorcycles 400,000 yen = 360,000,000,000 yen
2. Budgeted sales (motorcycles) 900,000
Add target ending finished goods inventory 80,000
3. Direct materials to be used in production,
880,000 × 2 (wheels) 1,760,000
Add target ending direct materials inventory 60,000
6-8
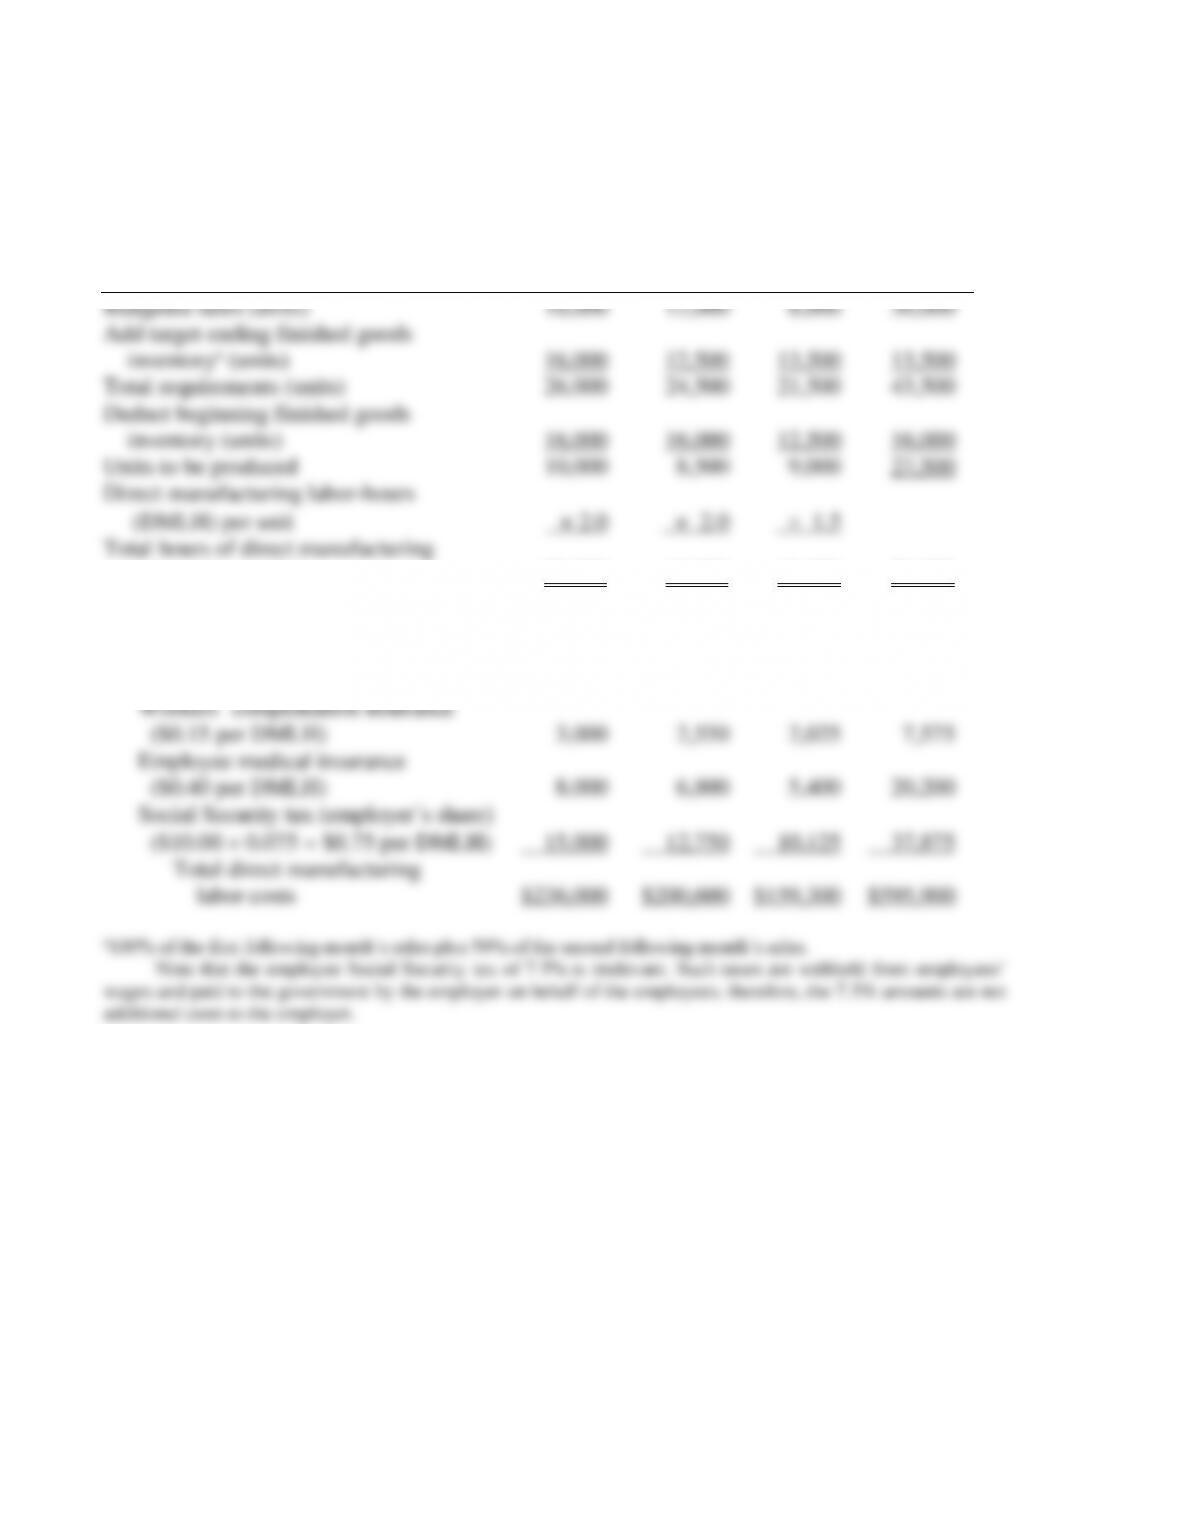
6-23 (15-25 min.) Budgets for production and direct manufacturing labor.
Roletter Company
Budget for Production and Direct Manufacturing Labor
for the Quarter Ended March 31, 2013
January February March Quarter
labor time needed 20,000 17,000 13,500 50,500
Direct manufacturing labor costs:
Wages ($10.00 per DMLH) $200,000 $170,000 $135,000 $505,000
Pension contributions
($0.50 per DMLH) 10,000 8,500 6,750 25,250
1. This question links to the ABC example used in the Problem for Self-Study in Chapter 5
and to Question 5-24 (ABC, retail product-line profitability).
Activity
Cost
Hierarchy
Soft
Drinks
Fresh
Produce
Packaged
Food
Total
Ordering
$90 14; 24; 14
Delivery
$82 12; 62; 19
Shelf-stocking
$21 16; 172; 94
Customer support
$0.18 4,600; 34,200; 10,750
Total budgeted indirect costs
Percentage of total indirect costs
Batch-level
Batch-level
Output-unit-
level
Output-unit-
level
$1,260
984
336
828
$3,408
12.5%
$ 2,160
5,084
3,612
6,156
$17,012
62.7%
$1,260
1,558
1,974
1,935
$6,727
24.8%
$ 4,680
7,626
5,922
8,919
$27,147
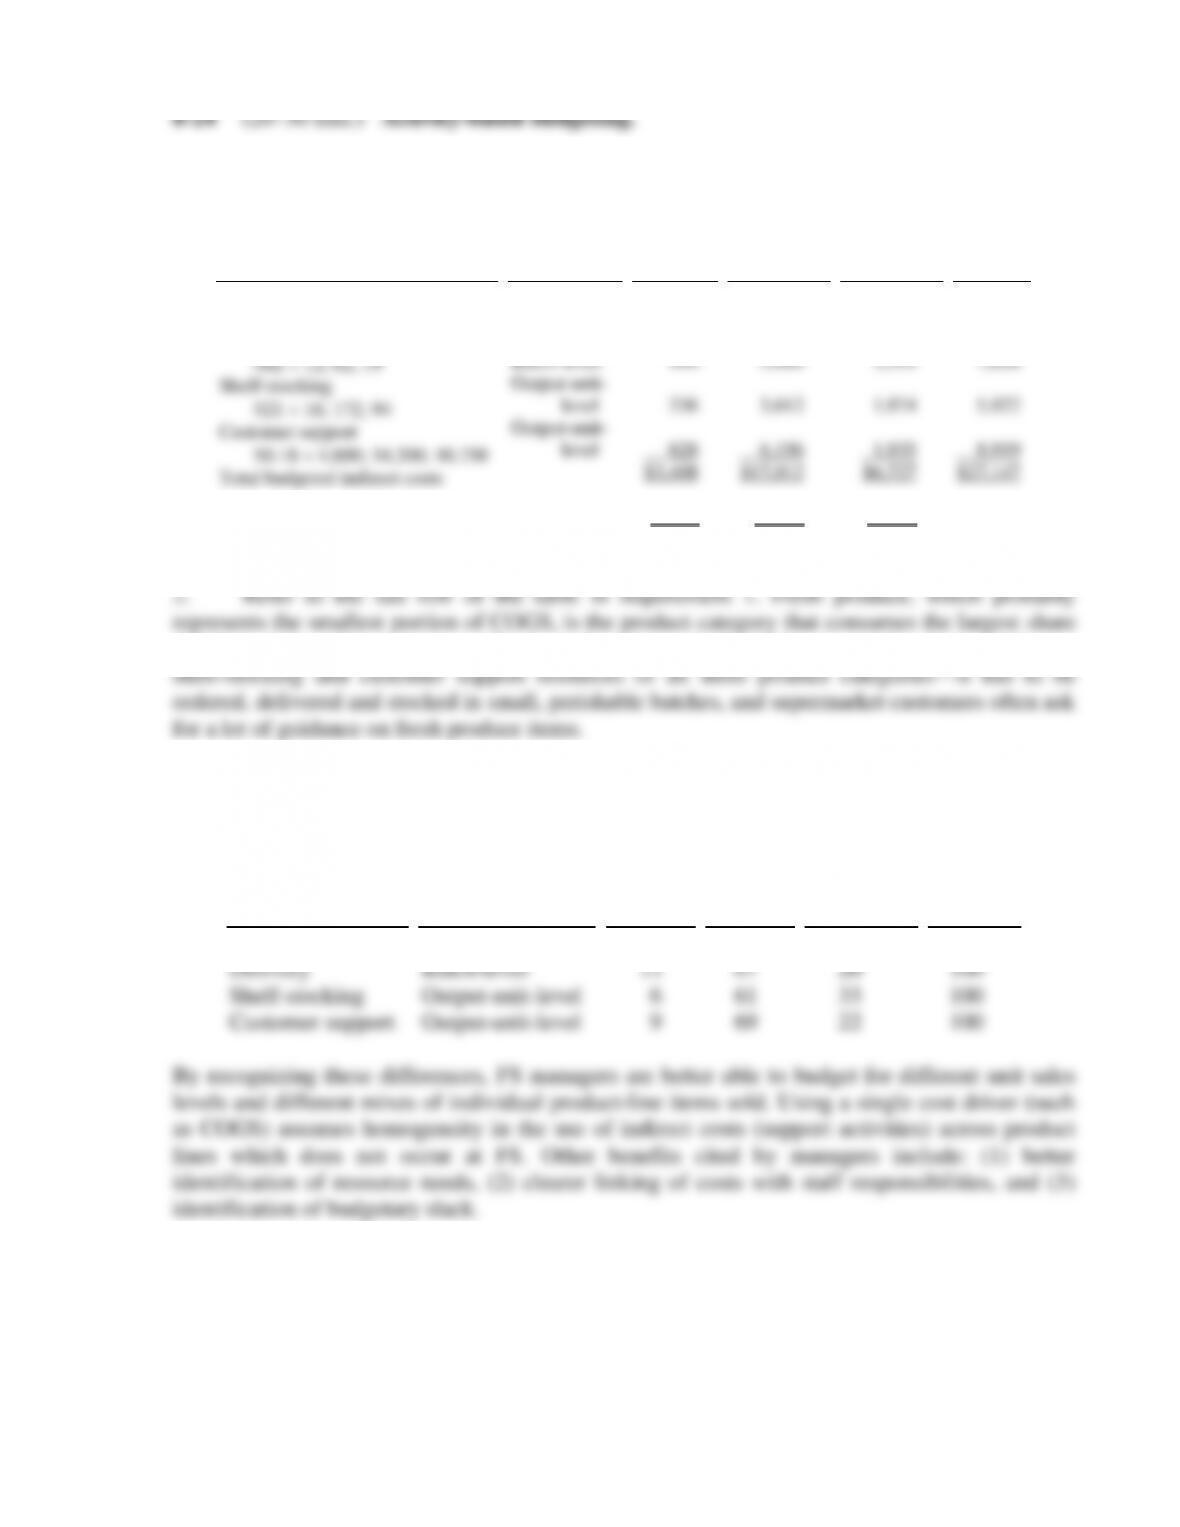
(62.7%) of the indirect resources. Fresh produce demands the highest level of ordering, delivery,
3. An ABB approach recognizes how different products require different mixes of support
activities. The relative percentage of how each product area uses the cost driver at each activity
area is:
Activity
Cost
Hierarchy
Soft
Drinks
Fresh
Produce
Packaged
Food
Total
Ordering
Delivery
Shelf-stocking
Customer support
Batch-level
Batch-level
Output-unit-level
Output-unit-level
27%
13
6
9
46%
67
61
69
27%
20
33
22
100%
100
100
100
By recognizing these differences, FS managers are better able to budget for different unit sales
levels and different mixes of individual product-line items sold. Using a single cost driver (such
as COGS) assumes homogeneity in the use of indirect costs (support activities) across product
lines which does not occur at FS. Other benefits cited by managers include: (1) better
identification of resource needs, (2) clearer linking of costs with staff responsibilities, and (3)
identification of budgetary slack.
6-10
1.
Budgeted Cost-Driver Rates
Activity
Cost Hierarchy
January
February
March
Ordering
Delivery
Shelf-stocking
Customer support
Batch-level
Batch-level
Output-unit-level
Output-unit-level
$90.00
82.00
21.00
0.18
$89.6400
81.6720
20.9160
0.1793
$89.2814
81.3453
20.8323
0.1786
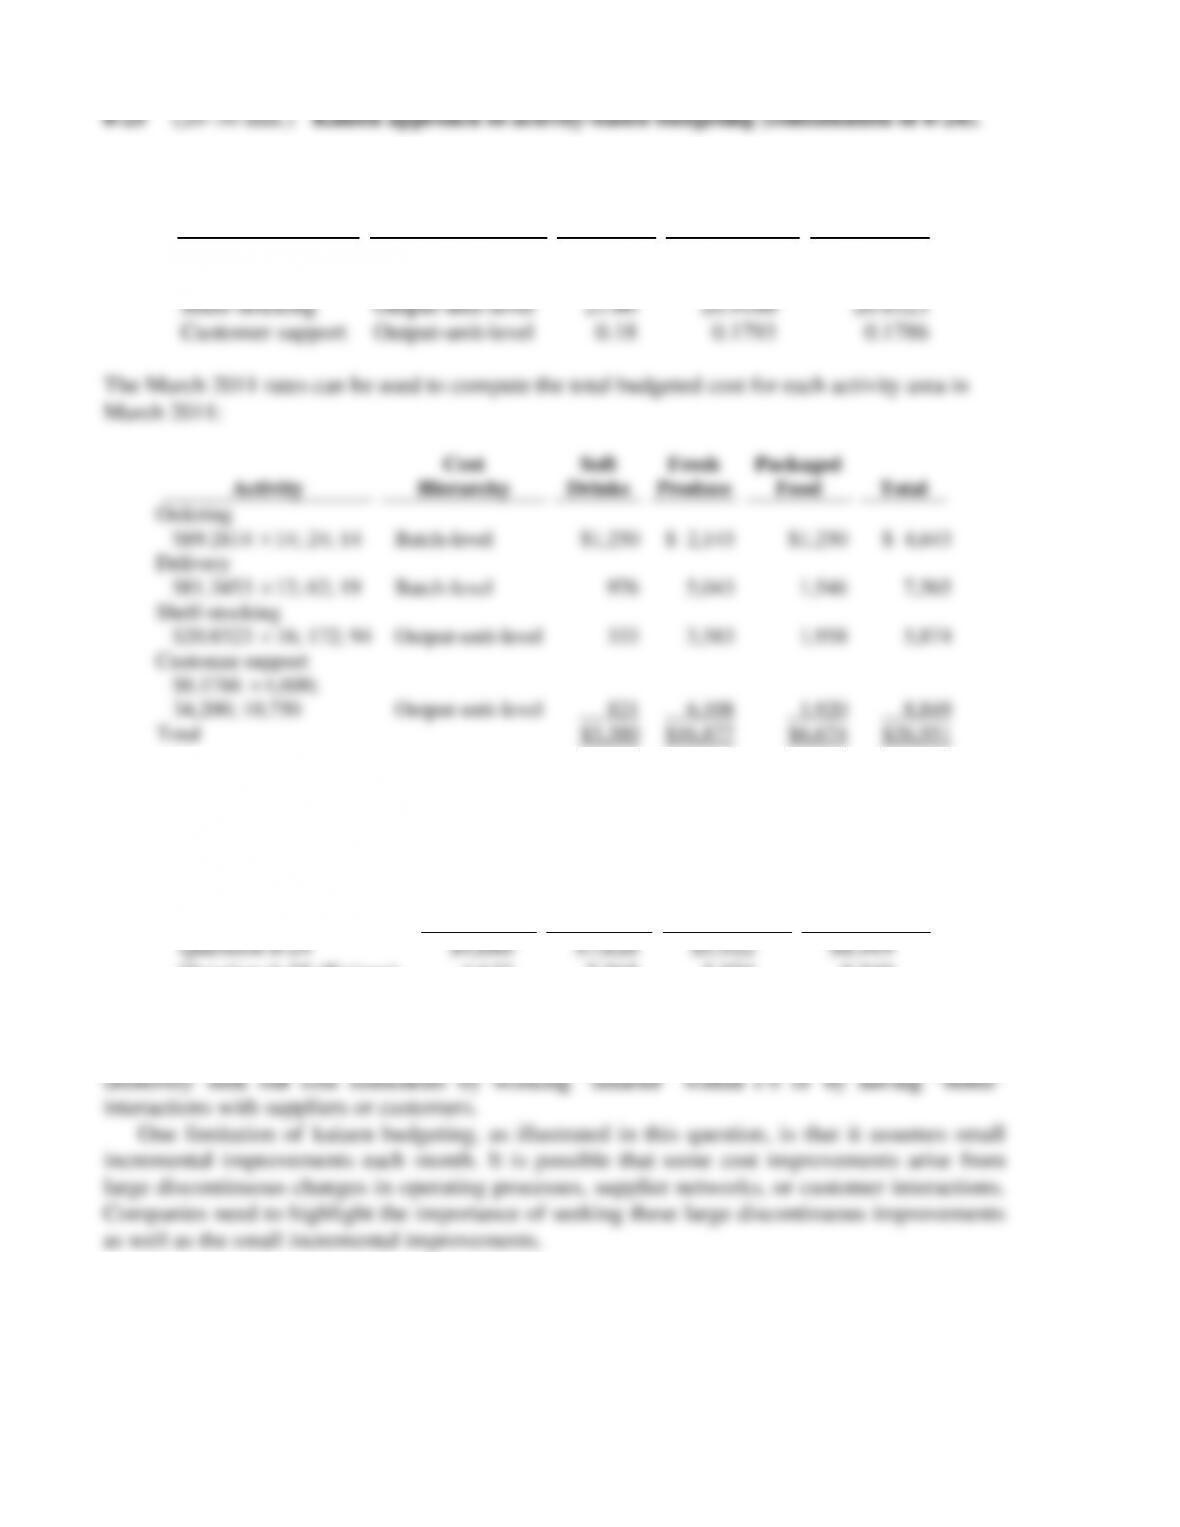
The March 2011 rates can be used to compute the total budgeted cost for each activity area in
March 2011:
Activity
Cost
Hierarchy
Soft
Drinks
Fresh
Produce
Packaged
Food
Total
Ordering
$89.2814
14; 24; 14
Delivery
$81.3453
12; 62; 19
Shelf-stocking
$20.8323
16; 172; 94
Customer support
$0.1786
4,600;
34,200; 10,750
Total
Batch-level
Batch-level
Output-unit-level
Output-unit-level
$1,250
976
333
821
$3,380
$ 2,143
5,043
3,583
6,108
$16,877
$1,250
1,546
1,958
1,920
$6,674
$ 4,643
7,565
5,874
8,849
$26,931
2. A kaizen budgeting approach signals management’s commitment to systematic cost
reduction. Compare the budgeted costs from Question 6–24 and 6-25.
Ordering
Delivery
Shelf-
Stocking
Customer
Support
Question 6-24
$4,680
$7,626
$5,922
$8,919
Question 6-25 (Kaizen)
4,643
7,565
5,874
8,849
The kaizen budget number will show unfavorable variances for managers whose activities do not
meet the required monthly cost reductions. This likely will put more pressure on managers to